 Open Access Article
Fluorescent probe for Cu2+ and the secondary application of the resultant complex to detect cysteine†
Meipan Yang *abc,
Lifeng Maabc,
Jing Liabc and
Longli Kang*abc
aKey Laboratory for Molecular Genetic Mechanisms and Intervention Research on High Altitude Disease of Tibet Autonomous Region, School of Medicine, Xizang Minzu University, Xianyang, 712082, China. E-mail: ymp1111@126.com; klongli@163.com
bKey Laboratory of High Altitude Environment and Gene Related to Disease of Tibet Autonomous Region, School of Medicine, Xizang Minzu University, Xianyang, 712082, China
cKey Laboratory for Basic Life Science Research of Tibet Autonomous Region, School of Medicine, Xizang Minzu University, Xianyang, 712082, China
First published on 29th May 2019
Abstract
A special fluorescent probe has been developed, one that demonstrated excellent “off-on-type” change in fluorescence with high selectivity toward Cu2+. Interestingly, the probe–Cu2+ complex could detect cysteine due to the ability of this amino acid to strongly coordinate Cu2+, and no obvious interference was observed from other amino acids and anions. According to the proposed mechanism, addition of cysteine induced decomplexation of the probe–Cu2+ form. Furthermore, the results of confocal microscopy experiments demonstrated the potential of using the probe to image Cu2+ in living cells and mice.
Introduction
As the third most abundant transition metal ion, copper is an essential element for life and plays vital roles in various biological processes. Its homeostasis is critical for the metabolism and development of living organisms.1–3 Fluorescent probes have been developed to meet the demand for molecular recognition tools. Fluorescent probes combine molecular recognition with fluorometric analysis and have as a result expanded applications. When reacting with or binding to an acceptor in a specific manner, the fluorophore of the probe could express the recognition process in the form of an optical signal. In recent years, several fluorescent probes for Cu2+ have been reported, and some of them have been successfully applied both in biological and environmental samples.4,5 Rhodamine derivatives bearing a spirolactam structure are non-fluorescent (off), whereas ring opening of the corresponding spirolactam gives rise to a strong fluorescence emission (on). So the study of outstanding probes for Cu2+ based on rhodamine is ongoing.Cysteine (Cys) is an important amino acid and biothiol, and plays an essential role in many significant cellular functions such as protein synthesis, detoxification, and metabolism.6,7 A deficiency of cysteine may lead to many syndromes such as slow growth in children, hair depigmentation, lethargy and liver damage.8–10 On the other hand, elevated levels of cysteine have been associated with cardiovascular disease, Alzheimer's disease, neural tube defects, and osteoporosis.11–13 Li and co-workers14 developed a novel ratiometric Cys-selective fluorescence probe. The biocompatible merocyanine probe showed highly selective detection and monitoring of Cys. The probe has been successfully applied to the ratiometric imaging and detection of mitochondrial Cys in cells and intact tissues. From the biological and pharmacological points of view, the detection of cysteine is particularly critical for the early diagnosis and treatment of related diseases.
Nowadays, fluorescence-based detection methods have been widely applied in the detection of biologically relevant ions and bio-molecules due to their advantages of being simple and highly sensitive. In the past few years, various fluorescent probes that detect thiols have been developed based on different mechanisms such as Michael addition,15–18 cyclization reaction with aldehyde,19–21 cleavage reaction induced by thiols,22–25 nucleophilic aromatic addition,26,27 and ligand displacement of metal complexes by thiols.28–30 Most of these fluorescent-labeling reagents contain a functional group, e.g., N-substituted maleimide, reactive halide or aziridine, that reacts with thiol groups in general, and thus are not specific to Cys.31,32 The common way developed to detect Cys is the so-called “chemosensing ensemble”. In this method, the fluorescent indicator is bound to the receptor through non-covalent interactions (such as coordination), and the fluorescence of the indicator is either quenched or enhanced by the receptor.33–35 The precise interactions between cysteine and copper in biological systems remain unknown. Of the 20 predominant biological amino acids, cysteine has a particularly strong binding affinity towards copper.36 Cu2+ could be recognized by the designed probe, and then Cys may be detected secondly by using the probe–Cu2+ complex. Qian and co-workers37 have synthesized a new rhodamine-based fluorescent chemosensor that can selectively and sensitively recognize Cu2+ and Zn2+ in different solutions. In addition, the zinc-containing complex shows selective recognition for His/Cys. Zhang and co-workers38 synthesized a probe for the specific detection of cysteine and homocysteine in water. The detection can be performed by observing the color changes from yellow to red upon addition of cysteine or homocysteine without interference by other amino acids. Wang and co-workers39 demonstrated the use of a molecular probe for the sensitive detection of cysteine in human plasma. The sensing mechanism was shown to involve release of the fluorescent probe from a non-fluorescent probe–copper complex upon exposure of the complex to Cys. The new dye was shown to have the desired properties suitable for bio-sensing applications. The ultimate goals of our research are designing and synthesizing “one-to-two” or even “one-to-many” probes for which high efficiency is achieved by a simultaneous functioning of probes operating based on different mechanisms. Sensitive identification of two or more target materials to maximize the use of resources has vitally important application values.
Keeping these goals in mind, we produced a probe for Cu2+, and then explored the ability of the probe–Cu2+ complex to detect Cys. The probe showed excellent recognition of Cu2+, with obvious absorption and fluorescence. Upon addition of Cys to the probe–Cu2+ complex solution, Cys was detected apparently by capturing Cu2+ from the probe–Cu2+ complex. Then the probe recovered the structure of the rhodamine lactam ring, and the absorption and fluorescence disappeared.
Experimental
Synthesis
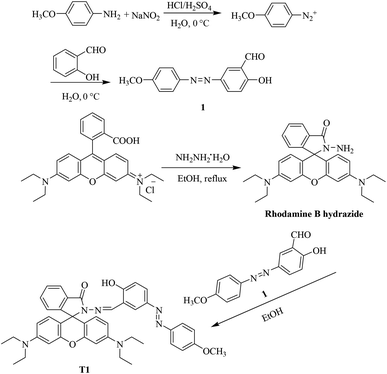
The synthetic route to the target probe is shown in Scheme 1. Compound 1 was obtained according to the literature.40Rhodamine B hydrazide was synthesized following the reported procedure.41,42 Rhodamine B hydrochloride (2.4 g, 0.005 mol) was dissolved in 20 mL of ethanol. Then, to this solution, an excess amount of hydrazine hydrate (3 mL) was added dropwise and the resulting reaction mixture was refluxed for 2 h. The mixture was then cooled, poured into water, and extracted with ethyl acetate. Finally, the solution was dried with anhydrous sodium sulfate, filtered, and then gave rhodamine B hydrazide.
Rhodamine B hydrazide (4.56 g, 10 mmol) was dissolved in 20 mL of ethanol, to which compound 1 (15 mmol) was then added, followed by stirring of the resulting the mixture for 6 h at room temperature. After that, the solvents were dried in vacuo and the crude product was purified by performing chromatography on silica gel. Yellow solid, yield: 53%. 1H NMR (400 MHz, CDCl3) δ (ppm) 11.44 (s, 1H), 9.12 (s, 1H), 8.05–7.90 (m, 1H), 7.83 (d, J = 12.0 Hz, 2H), 7.79 (d, J = 8.0 Hz, 1H), 7.69 (s, 1H), 7.60–7.46 (m, 2H), 7.18 (d, J = 8.0 Hz, 1H), 7.05–6.90 (m, 3H), 6.60–6.40 (m, 4H), 6.32–6.22 (m, 2H), 3.88 (s, 3H), 3.33 (q, J = 8.0 Hz, 8H), 1.16 (t, J = 6.5 Hz, 12H). 13C NMR (100 MHz, CDCl3) δ 163.5, 161.7, 154.9, 152.5, 149.9, 149.7, 148.1, 147.2, 144.5, 132.8, 128.3, 127.7, 127.5, 127.0, 124.8, 124.5, 123.7, 123.2, 122.5, 122.1, 117.8, 117.2, 115.1, 107.1, 103.9, 96.9, 65.5, 43.3, 11.6. HRMS (ESI) calcd. for C42H42N6O4 [M + H]+: 695.3340, found: 695.3343.
Materials and instrumentation
The fluorescence spectra and relative fluorescence intensity were obtained with a HITACHI F-4500 fluorescence spectrophotometer. The absorption spectra were acquired using a Shimadzu UV-1700 spectrophotometer at room temperature. Mass spectra (ESI-MS) were collected using an AXIMA-CFRTM plus MALDI-TOF mass spectrometer. 1H and 13C NMR spectra were recorded on a Varian INOVA-400 MHz spectrometer with tetramethylsilane (TMS) as an internal standard. Imaging of live mice was conducted employing an Xenogen IVIS spectrum imaging system. Chromatographic separations were done using Merck silica gel (250–400 mesh ASTM). Thin-layer chromatography (TLC) was performed on silica gel GF254.Double distilled water was used throughout the experiment. Unless specifically noted, the solvents and reagents were purchased from commercial sources and used as received. Rhodamine B, p-anisidine and salicylaldehyde were purchased from Aladdin (http://www.aladdin-e.com/zh_cn/). Hydrazine hydrate was purchased from Sinopharm Chemical Reagent Co., Ltd (https://www.reagent.com.cn/).
General procedures used to collect spectra for detection
Solutions of probe and detected ions (or amino acids) were prepared in methanol–water (3/7, v/v). The ions and amino acids tested were Fe3+, NH4+, Ag+, Ba2+, Al3+, Cd2+, Cr3+, Sn2+, Hg2+, Mg2+, Mn2+, Na+, Ni2+, Pb2+, Zn2+, Cl−, Br−, SO42−, SCN−, S2−, C2O42−, NO3−, NO2−, CN−, Hcy, GSH, Gly, Glu, Ala, Pro, His and Ser. Fresh solutions used for spectroscopic measurements were made by diluting stock solutions. Each sample was shaken for 10 s and then allowed to sit for 20 min at room temperature before taking the measurement. The excitation wavelength was 535 nm. The bandpass was set to 2.5 nm for this excitation wavelength and 5.0 nm for the emission wavelength.Fluorescence imaging for cells and mice
The HepG2 cells were cultured in Roswell Park Memorial Institute (RPMI) 1640 supplemented with 10% fetal bovine serum (FBS). Immediately before performing the experiments, cells were pretreated with probe (20 μM) for 1 h at 37 °C in humidified air and 5% CO2, washed three times with phosphate-buffered saline (PBS) and imaged. After incubation with CuCl2 (40 μM) for another 2 h, the cells were washed 3 times with PBS and imaged.All animal procedures for this study were followed in accordance with the requirements of the National Act on the use of experimental animals (China) and were approved by the Ethnics Committee of the medical department of Xizang Minzu University. The Kunming mouse (20–25 g) was given an intraperitoneal (i.p.) injection of probe (400 μL × 400 μM). The mouse was anesthetized by being made to inhale isoflurane and then imaged by using an imaging system. Then, CuCl2 (40 μL × 40 μM) was injected into the same region; and after 10 min, the mouse was then imaged again.
Results and discussion
Structural properties
The procedures used to synthesize probe T1 are summarized in the Scheme 1, and the structure was determined using various spectroscopic techniques, in particular 1H NMR, 13C NMR and mass spectroscopies.Spectral characteristics of the probe for Cu2+
As shown in Fig. 1, free probe T1 showed neither any absorption nor fluorescence, which was ascribed to the free probe adopting predominantly the spirolactam form. When Cu2+ was added to the probe solution (10 μM), a notable enhancement of absorption appeared at a wavelength of 552 nm. As the concentration of Cu2+ was increased, the absorption intensity also increased. These results indicated that the addition of Cu2+ induced the opening of the five-membered spiral ring of rhodamine. Further, the fluorescence spectra of the probe and Cu2+ were investigated. With the addition of Cu2+, a new emission peak appeared at 588 nm, which was attributed to the opening of the lactam ring in rhodamine. For concentrations of Cu2+ between 0 and 10 μM, the relationship between fluorescence intensity and concentration was found to be quite linear (Fig. S1†).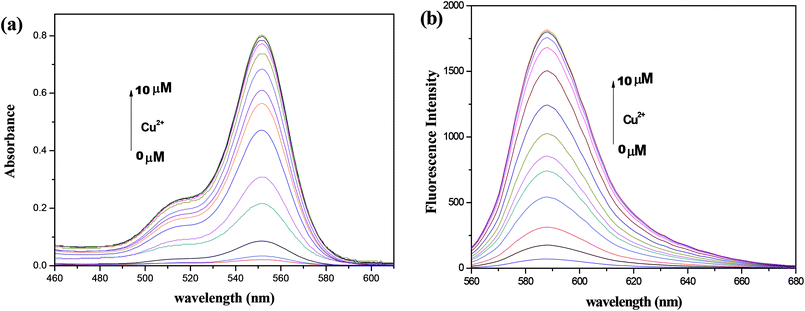 | ||
| Fig. 1 Absorption spectra (a) and fluorescence spectra (b) of the synthesized probe (10 μM) with various amounts of Cu2+. λex = 535 nm. | ||
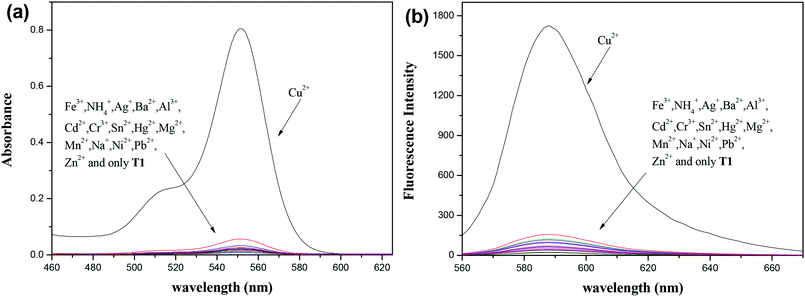
Selectivity is an important criterion for measuring probe performance. Fig. 2 shows the selectivity of 10 μM T1 after 10 μM of various common cations (including Fe3+, NH4+, Ag+, Ba2+, Al3+, Cd2+, Cr3+, Sn2+, Hg2+, Mg2+, Mn2+, Na+, Ni2+, Pb2+, and Zn2+) were each added to a separate probe solution sample. Only the addition of Cu2+ generated a new absorption peak at 552 nm. The fluorescence spectrum also showed similar changes.
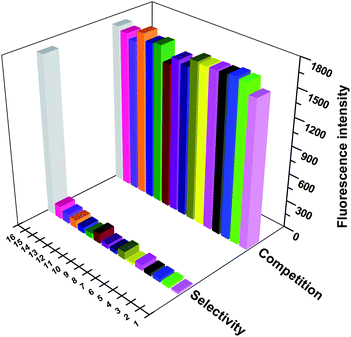
The tolerance of the probe (10 μM) during its detection of Cu2+ (10 μM) is displayed in Fig. 3. As expected, the Cu2+-induced spectral enhancement was not affected by the presence of any other tested background metal ion (20 μM) in a methanol–water (3/7, v/v) solution. These results showed the strong anti-interference ability of the probe.
Spectral characteristics of the probe for Cys in the presence of Cu2+
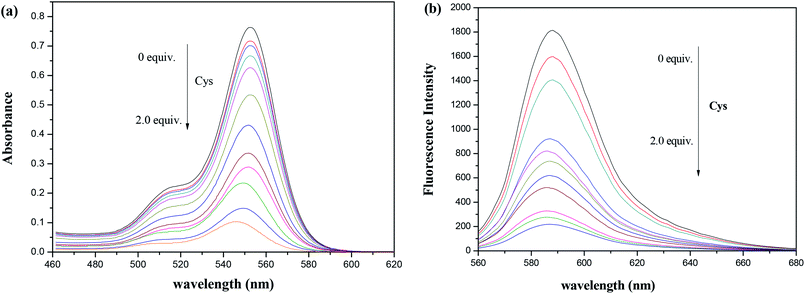
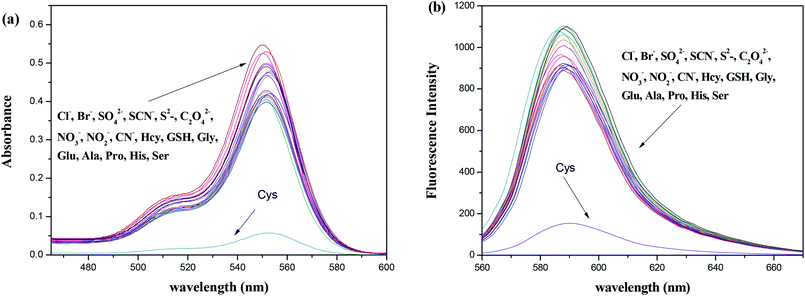
In addition, whether the T1–Cu2+ complex (10 μM probe and 10 μM Cu2+) could still retain the sensing response to Cys under the potential interferent was considered to be very important for the applicability of this fluorescent probe. As shown in Fig. S4,† the addition of Cys still resulted in large fluorescence changes even in the presence of 2.0 equiv. of interferents. The competitive anions tested showed virtually no influence on the fluorescence detection of Cys. These observations indicated that the probe–Cu2+ complex could serve as a potentially effective probe of Cys with excellent properties.
Mechanism
DFT calculations based on the Fukui function f+(r) were further carried out for T1 by using the Gaussian 09 program to explore the binding site better. The double-ζ quality (6-31 + G* for O and N, 6-31G** for C and H) basis set was applied for the geometry optimization and the following single-point energy calculation. According to the results of the vibration analysis, the optimized structure was proven to be the local minimum. Based on NBO analysis,44 the condensed Fukui functions of carbonyl O (0.026) and hydroxyl O (0.028) were larger than those of N1 (−0.001) and N2 (−0.002). These results indicated that the probe was most likely to chelate Cu2+ via carbonyl O and hydroxyl O (Fig. S5†).From the mass spectrum (Fig. S6†), a unique peak at an m/z of 756.2475, corresponding to [T1 + Cu–H]+, was clearly observed, demonstrating the formation of the T1–Cu2+ complex. Interestingly, the intensity of the peak at an m/z of 695.3342 increased a bit after addition of Cys to the T1–Cu2+ complex, corresponding to [T1 + H]+. This result indicated that the probe recovered the spirocyclic form under the present conditions.
Based on the various experiments that we carried out, a plausible mode of the binding of probe to Cu2+ and the progression to a secondary recognition of Cys was derived, and is shown in Scheme 2. Generally, the d orbital of Cu2+ is not underfilled by electrons, and the unpaired electrons lead to Cu2+ exhibiting paramagnetic properties, which make Cu2+ act as typical fluorescence quencher. In the meantime, the excellent photophysical properties of rhodamine, such as strong fluorescence emission and high fluorescence quantum yield, should be taken into consideration. Energy and electron transfer occurring when combining Cu2+ with the probe was expected to only cause partial loss of fluorophore emission energy. In general, the intensity of the fluorescence of the probe was observed to increase when Cu2+ bound. The flowing electrons of the Schiff base structure (–C![[double bond, length as m-dash]](https://www.rsc.org/images/entities/char_e001.gif) N–) of the probe was expected to cause a fluorescence emission. Azo dyes can be used to further increase the extent of the molecular conjugation of a system, and hence was expected in our experiments to serve as an effective chromophore group for the detection of ions. The combination of the two frameworks was expected to yield a novel fluorescent reagent with excellent properties. At the same time, oxygen atoms are classified as hard bases according to the hard and soft acid and base principle. As a result, increasing the number of oxygen atoms was expected to increase the ability of the probe to complex with Cu2+. In our experiments, these features indeed appeared to be beneficial for increasing the intensity of emission signals for yielding a better detection. Then, in the azophenol structure of the probe, the complexation of the Cu2+ with the phenolic hydroxyl group apparently effectively changed the distribution of charges in the molecule and realized the detection of Cu2+.
N–) of the probe was expected to cause a fluorescence emission. Azo dyes can be used to further increase the extent of the molecular conjugation of a system, and hence was expected in our experiments to serve as an effective chromophore group for the detection of ions. The combination of the two frameworks was expected to yield a novel fluorescent reagent with excellent properties. At the same time, oxygen atoms are classified as hard bases according to the hard and soft acid and base principle. As a result, increasing the number of oxygen atoms was expected to increase the ability of the probe to complex with Cu2+. In our experiments, these features indeed appeared to be beneficial for increasing the intensity of emission signals for yielding a better detection. Then, in the azophenol structure of the probe, the complexation of the Cu2+ with the phenolic hydroxyl group apparently effectively changed the distribution of charges in the molecule and realized the detection of Cu2+.
In summary, the complexation of Cu2+ with the probe induced the opening of the rhodamine lactam ring, resulting in an obvious increase in absorption and fluorescence. Cys, when added to this solution, apparently captured Cu2+, due to its ability to relatively strongly coordinate Cu2+, and then led to the lactam ring of the probe having formed again and to the UV-Vis absorption and fluorescence signals having nearly disappeared.
Fluorescence imaging
For biological research applications, low toxicity is a prerequisite. The toxicity of the probe to HepG2 cells was explored by using the (3,4,5-dimethyl-2-thiazolyl)-2,5-diphenyl-2-H-tetrazolium bromide (MTT) assay method45 with working concentrations of 80, 40, 20, 10, and 5 μM. As shown in Fig. S7,† the cell viability was about 86% when the probe concentration was 20 μM, indicative of low toxicity of the probe to cells and that the probe could be used in the fields of cell labeling, detection and staining.To further demonstrate the practical biological application of the probes, confocal microscopy experiments were carried out in living HepG2 cells. As shown in Fig. 6, the probe showed almost no fluorescence in the cells (Fig. 6a). After the addition of Cu2+, an obvious fluorescence was observed (Fig. 6b). Bright-field transmission images of cells treated with Cu2+ and the probe revealed that the cells were viable throughout the imaging experiments (Fig. 6c). The probe could bind to Cu2+ specifically in cells. After the introduction of Cu2+, the lactam ring of the probe molecule opened, and the fluorescence appeared. The above results showed the ability of the probe to display excellent cytocompatibility and permeability, features important for the effective use of reagents designed to detect intracellular Cu2+.
Encouraged by the results of the intracellular detection of Cu2+, we considered whether the probe can be further applied to fluorescence imaging in live animals. To test this idea, Kunming mice (20–25 g) were selected as the subjects of study, and the results of our experiments with these mice are shown in Fig. S8.† When the probe was injected intraperitoneally into a mouse, no fluorescence was observed (Fig. S8a†). When the mouse was injected with Cu2+ at the same region, a large fluorescence signal was noted. The results suggested the ability of the probe to be highly biocompatible with small animals and that it could be widely used in biological research.
Conclusions
In summary, we have developed a special fluorescent probe, on that showed “off-on” response to Cu2+ based on a ring-opening mechanism. Moreover, the ensemble probe–Cu2+ complex was shown to be an excellent sensory system for detecting Cys, indicating the promise of the metal-based complex as a tool to detect this amino acid. We further showed the ability of using the probe for bio-imaging not only in cells but also in live mice. We expect the synthesized probe to find additional interesting applications as sensing and labeling agents in biology and medicine.Conflicts of interest
There are no conflicts to declare.Acknowledgements
This work was supported by “The training plan for the youth” Support Program of Xizang Minzu University (No. 17MDQP03) and Natural Science Foundation of Xizang (Tibet) Autonomous Region (No. XZ2017ZGR-61).References
- J. A. Cotruvo Jr, A. T. Aron, K. M. Ramostorres and C. J. Chang, Chem. Soc. Rev., 2015, 44, 4400 RSC.
- S. G. Kaler, Nat. Rev. Neurol., 2011, 7, 15 CrossRef CAS PubMed.
- C. Vulpe, B. Levinson, S. Whitney, S. Packman and J. Gitschier, Nat. Genet., 1993, 3, 7 CrossRef CAS PubMed.
- F. Chen, G. Liu and Y. Shi, Talanta, 2014, 124, 139 CrossRef CAS PubMed.
- M. Yang, W. Meng and X. Liu, RSC Adv., 2014, 4, 22288 RSC.
- C. E. Paulsen and K. S. Carroll, Chem. Rev., 2013, 113, 4633 CrossRef CAS PubMed.
- K. G. Reddie and K. S. Carroll, Curr. Opin. Chem. Biol., 2008, 12, 746 CrossRef CAS PubMed.
- N. F. Ibrahim, J. Radiat. Res. Appl. Sci., 2012, 5, 647 CAS.
- S. M. Marino and V. N. Gladyshev, J. Mol. Biol., 2010, 404, 902 CrossRef CAS.
- E. Weerapana, C. Wang, G. M. Simon, F. Richter, S. Khare, M. B. D. Dillon, D. A. Bachovchin, K. Mowen, D. Baker and B. F. Cravatt, Nature, 2010, 68, 790 CrossRef.
- C. Yee, W. Yang and S. Hekimi, Cell, 2014, 157, 897 CrossRef CAS.
- S. Seshadri, A. Beiser, J. Selhub, P. F. Jacques, I. H. Rosenberg, R. B. D'Agostino, P. W. Wilson, P. A. Wolf and N. Engl, J. Med., 2002, 346, 476 CAS.
- X. F. Wang and M. S. Cynader, J. Neurosci., 2001, 21, 3322 CrossRef CAS PubMed.
- W. Niu, L. Guo and Y. Li, et al., Anal. Chem., 2016, 88, 1908 CrossRef CAS PubMed.
- Y. Q. Sun, M. Chen, J. Liu, X. Lv, J. F. Li and W. Guo, Chem. Commun., 2011, 47, 11029 RSC.
- L. Wang, Q. Zhou, B. Zhu, L. Yan, Z. Ma, B. Du and X. Zhang, Dyes Pigm., 2012, 95, 275 CrossRef CAS.
- Z. Guo, S. Nam, S. Park and J. Yoon, Chem. Sci., 2012, 3, 2760 RSC.
- D. Kand, A. M. Kalle, S. J. Varma and P. Talukdar, Chem. Commun., 2012, 48, 2722 RSC.
- X. Liu, X. Na and S. Liu, J. Mater. Chem., 2012, 22, 7894 RSC.
- H. Li, J. Fan and J. Wang, Chem. Commun., 2009, 5904 RSC.
- P. Wang, J. Liu and X. Lv, Org. Lett., 2012, 14, 520 CrossRef CAS PubMed.
- J. Shao, H. Sun and H. Guo, Chem. Sci., 2012, 3, 1049 RSC.
- B. Tang, Y. Xing, P. Li, N. Zhang, F. Yu and G. Yang, J. Am. Chem. Soc., 2007, 129, 11666 CrossRef CAS PubMed.
- H. Y. Shiu, M. K. Wong and C. M. Che, Chem. Commun., 2011, 47, 4367 RSC.
- Y. Chen, J. Zhao and H. Guo, J. Org. Chem., 2012, 77, 2192 CrossRef CAS PubMed.
- X. Chen, Y. Zhou, X. Peng and J. Yoon, Chem. Soc. Rev., 2010, 39, 2120 RSC.
- X. Chen, S. K. Ko and M. J. Kim, Chem. Commun., 2010, 46, 2751 RSC.
- L. Zhou, Y. Lin and Z. Huang, Chem. Commun., 2012, 48, 1147 RSC.
- H. S. Jung, J. H. Han and Y. Habata, Chem. Commun., 2011, 47, 5142 RSC.
- C. Luo, Q. Zhou and B. Zhang, et al., New J. Chem., 2011, 35, 45 RSC.
- W. Hao, A. Mcbride and S. Mcbride, et al., J. Mater. Chem., 2011, 21, 1040 RSC.
- G. Chwatko and E. Bald, Talanta, 2000, 52, 509 CrossRef CAS PubMed.
- Y. Fu, H. Li and W. Hu, et al., Chem. Commun., 2005, 3189 RSC.
- N. Shao, J. Y. Jin and S. M. Cheung, et al., Angew. Chem., 2010, 118, 5066 CrossRef.
- M. S. Han and D. H. Kim, Tetrahedron, 2004, 60, 11251 CrossRef CAS.
- H. Lu, H. Zhang and J. Chen, et al., Talanta, 2016, 46, 477 CrossRef PubMed.
- L. Xu, Y. Xu, W. Zhu, B. Zeng, C. Yang, B. Wu and X. Qian, Org. Biomol. Chem., 2011, 24, 8284 RSC.
- D. Zhang, Inorg. Chem. Commun., 2009, 12, 1255 CrossRef CAS.
- W. Hao, A. McBride, S. McBride, J. P. Gao and Z. Y. Wang, J. Mater. Chem., 2011, 21, 1040 RSC.
- J. Shao, Dyes Pigm., 2010, 87, 272 CrossRef CAS.
- Y. Xiang, A. Tong, P. Jin and Y. Ju, Org. Lett., 2006, 8, 2863 CrossRef CAS PubMed.
- M. Yang, W. Meng, X. Liu, N. Su, J. Zhou and B. Yang, RSC Adv., 2014, 4, 22288 RSC.
- Z. Xu, L. Zhang, R. Guo, T. Xiang, C. Wu and Z. Zheng, et al., Sens. Actuators, B, 2011, 156, 546 CrossRef CAS.
- W. D. Chen, W. T. Gong and Z. Q. Ye, et al., Dalton Trans., 2013, 42, 10093 RSC.
- D. Horowitz and A. G. King, J. Immunol. Methods, 2000, 244, 49 CrossRef CAS PubMed.
Footnote |
| † Electronic supplementary information (ESI) available. See DOI: 10.1039/c9ra02360g |
| This journal is © The Royal Society of Chemistry 2019 |

