 Open Access Article
Beneficial use of ultrasound irradiation in synthesis of beta–clinoptilolite composite used in heavy oil upgrading process
Sahar Safaria,
Reza Khoshbin b and
Ramin Karimzadeh*a
aFaculty of Chemical Engineering, Tarbiat Modares University, P. O. Box 14115-114, Tehran, Islamic Republic of Iran. E-mail: ramin@modares.ac.ir
bDepartment of Chemical and Materials Engineering, Buein Zahra Technical University, Buein Zahra, Qazvin, Iran
First published on 29th May 2019
Abstract
A novel beta–clinoptilolite composite was prepared from beta zeolite and alkaline treated clinoptilolite by employing conventional and sonicated mixing procedures. Parent and prepared catalysts were characterized by XRD, FE-SEM, N2 adsorption–desorption and NH3-TPD analyses. Prepared composite of beta zeolite and treated clinoptilolite exhibited improved structural properties especially upon sonicated mixing procedure. Employing ultrasound irradiation notably improved beta distribution in the composite and increased mesoporous volume and specific surface area from 0.245 cm3 g−1 and 171.3 m2 g−1 in conventionally mixed composite to 0.353 cm3 g−1 and 232.9 m2 g−1 in sonicated sample. Catalytic performance of prepared composite was evaluated in heavy oil upgrading process in a continuous fixed bed apparatus. Liquid product was specified by conducting SIMDIS-GC and GC/MS analyses. Spent catalysts were characterized by TGA, FTIR and XRD. Beta–clinoptilolite composite containing only 30 wt% of beta zeolite, exhibited similar performance to beta zeolite catalyst by resulting 75.3% viscosity reduction while producing lower amount of coke. Amount of light hydrocarbons produced over beta–clinoptilolite composite was 33.51 wt% while beta zeolite catalyst produced 35.58 wt% light hydrocarbons in upgrading process. Ultrasound irradiated composite showed more stable structure in catalytic cracking procedure compared to conventionally mixed composite. After 5 h time on stream, relative crystallinity of clinoptilolite phase in the conventionally mixed composite was reduced by 34.5% while sonicated sample remarkably preserved its structure during the reaction and only 1% reduction occurred for this sample.
1. Introduction
Depletion of conventional and light oil resources and increasing demand for high-grade light fuels in recent decades have provided economic and strategic justifications to improve the methods and techniques of heavy oil upgrading processes.1 Among all the thermochemical methods employed so far, such as thermal cracking, catalytic cracking, hydrocracking and catalytic pyrolysis,2–4 catalytic cracking has been widely noticed in recent years due to the moderate operating conditions and controlled product distribution.5–7Zeolites are popular catalysts in oil processing and fuel production industries due to their crystalline aluminosilicate structure, acidity and shape selectivity.8 However, preparation and regeneration costs have always been matter of concern in industrial scale. Unlike synthetic zeolites, natural zeolites are found in mines and deposits in many parts of the world abundantly and have low prices. Natural zeolites may have lower external surfaces or non-homogenous phase and impurities but they have noticeable acidities.9 Clinoptilolite is one natural small pore zeolite widely used because of its cation-exchange property and plentitude in nature.8 However, small pore size is one limitation for larger molecules such as heavy oils and lessens the rate of diffusion and mass transfer to the pores where active acidic sites are located.10 Presence of mesopores in zeolites alleviates the intracrystalline diffusion limitations and easier desorption of the products out of the structure takes place, resulting in more desired products due to the reduction of over cracking and secondary reactions.11 Different post treatment methods such as alkaline treatment and acid treatment have been widely employed to increase the porosity of different synthetic and natural zeolites by desilication and dealumination.12–16 Lin et al.17 studied physicochemical properties of clinoptilolite modified by NaOH and found out that alkaline treatment increased the proportion of mesopores and cation exchange capacity of clinoptilolite. Beside alkaline treatment, further modifications may be conducted on treated clinoptilolite to induce even more improvements in catalytic cracking performance of this natural zeolite.
One of the modification techniques, which has been a subject of interest in recent years, is preparing composites of different zeolites such as ZSM-5/MCM-41, E-CAT/MCM-41, Y/Beta, etc.18–23 These composites benefit from the advantageous features of different zeolites simultaneously. Zeolite beta is one of the zeolites numerously used in zeolite composites due to its moderate acidity and average pore size which makes it applicable in different petrochemical refinery processes such as alkylation, isomerization, methylation, esterification, cracking and etc.24,25 Different composites of zeolite beta have been synthesized for different intentions, for example it has been used in beta/Y composite in order to benefit from larger pore openings of beta zeolite coupled with high acidity of Y zeolite,26,27 or in beta/MCM-41 composite to induce larger mesopore volume attained from mesoporous structure of MCM-41 aluminosilicate paired with moderate acidity of zeolite beta.28–30 Therefore, beta zeolite has potential to be paired with different kinds of zeolites in a composite.
Zeolite composites may be synthesized by different methods such as crystallization process, seeding, hydrothermal synthesis, core shell structure, etc.30 However, these methods have many determining parameters such as temperature, alkaline environment, exact ratios of precursors and long synthesis times, which makes it difficult to have complete control over the synthesis procedure. Physical mixing is the easiest way to prepare a mixture of two zeolites. Although, result mixture may suffer from weak and nonhomogeneous dispersion. Particle dispersion in aqueous solutions is an important factor since particles are likely to aggregate together to form larger particles which affects different aspects such as stability and surface area.31,32 In order to achieve better distribution in the mixture ultrasound irradiation may be used in mixing procedure. As ultrasound wave passes through a liquid–solid medium explosion of micro bubbles (cavitation) occurs, resulting in formation of shock waves and hot spots with high temperatures and pressures which destroy particle agglomerations and cause a uniform distribution in medium.33,34 Positive effects of ultrasound irradiation on the dispersion level, size uniformity, decreased particle size, increased surface area and shortened preparation time on loading different materials on different supports such as zeolites have also been reported in the literature.35–38 Sene et al.39 investigated dispersion of TiO2 on clinoptilolite under low frequency probe type ultrasound irradiation. They concluded that ultrasound irradiation resulted in higher surface area and better distribution of TiO2 compared to conventional dispersion method.
The aim of this study is to develop a modification method to improve catalytic performance and structural stability of clinoptilolite in order to employ in heavy oil upgrading process. For this purpose, novel composite of alkaline treated clinoptilolite with beta zeolite was synthesized. Proposed composite benefits from low cost of natural zeolite and desirable catalytic performance of zeolite beta in light hydrocarbon production. Effect of ultrasound irradiation in physical mixing procedure was investigated to evaluate homogenous and stable dispersion compared to conventional mixing.
2. Experimental section
2.1. Materials
Beta zeolite (SiO2/Al2O3 = 25) in ammonium form was purchased from Zeolyst International Company (CP814E). Raw Iranian clinoptilolite was provided from Semnan deposits, in the northeast of Iran (Afrand Tuska Company). Raw materials used for treatments were sodium hydroxide (NaOH) and ammonium nitrate (NH4NO3) (Merck). A middle distillate cut used as feed in catalytic cracking experiments was provided from Arak Refinery.2.2. Catalyst preparation
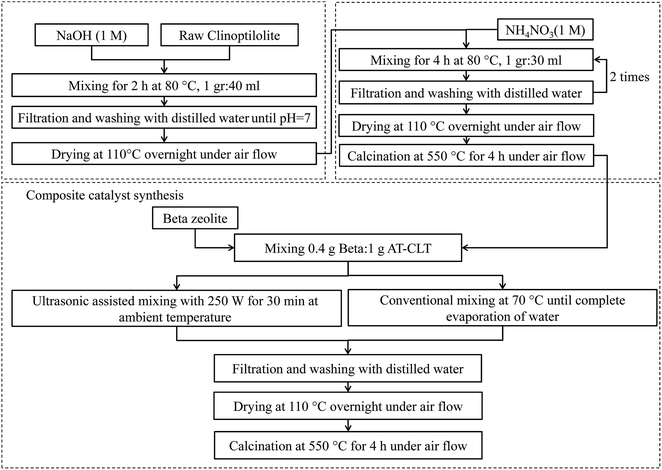
Beta zeolite was received in ammonium form, therefore, it was calcinated in furnace at 550 °C for 4 h in air stream in order to obtain protonated form of zeolite. This sample was labeled Beta. As received clinoptilolite zeolite was grinded to powder and sieved to particle size range of 100–250 μm. Then it was ion exchanged and converted to protonated form twofold by 1 molar ammonium nitrate solution at 80 °C for 4 h, filtered, washed with deionized water, and dried in oven at 110 °C over night. Finally, it was calcined at 550 °C for 4 hours in air stream. This sample was labeled CLT.In order to perform alkaline treatment, clinoptilolite powder was treated with 1 M NaOH solution (1 g/40 cm3) at 80 °C for 2 h. The suspension was immediately cooled down to room temperature in an ice-bath, filtered and washed until neutral pH was attained. The filtrate was dried in oven over night and then it was ion exchanged with ammonium nitrate solution as it was mentioned before. This sample was named AT-CLT.
Physical mixture of CLT and Beta was prepared by conventional mixing on a magnetically driven stirrer. 1 gram of CLT was mixed with adequate water and stirred for one hour in room temperature to make a homogenous suspension. Then, 0.4 gram of Beta sample was added to the mixture and stirred at 70 °C until total evaporation of water took place. The sample was dried in oven over night, calcinated at 550 °C for 4 h in air stream and labeled Beta/CLT.
Beta/AT-CLT sample was prepared likewise with AT-CLT sample instead of CLT sample.
Physical mixture of Beta and AT-CLT was also prepared under ultrasound irradiation using a UP400S apparatus (Hielscher, Germany) with 20 mm probe diameter. 1 gram of AT-CLT sample was mixed with adequate water and stirred for one hour in room temperature to make a homogenous suspension. Then, 0.4 gram of Beta sample was added to the mixture and slurry was exposed to ultrasound irradiation with 250 W power and 20 kHz frequency for 30 minutes in room temperature. Then it was dried in oven over night, calcinated at 550 °C for 4 h in air stream and referred to as US-Beta/AT-CLT. Composite preparation procedure is schematically illustrated in Fig. 1.
2.3. Catalyst characterization
Crystallinity and phase purity of samples were evaluated by XRD analysis carried out by using an X'Pert PRO MPD diffractometer (Philips, Netherland) using Cu Kα radiation (λ = 0.15405 Å) at 40 kV and 30 mA in scanned angle range of 5–60 with 0.02° s−1 step size. Samples were strewed on Zero Background Silicon Holder placed on PW1812 sample holders (both Philips).Relative crystallinity values of modified samples were determined based on the intensity of main characteristic diffraction picks of parent samples.
Nitrogen sorption isotherms were recorded by an ASAP 2020 V3.03 G Plus (Micromeritics, Norcross, Georgia, USA) instrument at 77 K in order to evaluate the structural and surface characteristics of the samples. Before the measurement, samples were degassed for 2 h at 200 °C. The specific surface areas of the obtained samples were calculated by the Brunauer–Emmett–Teller (BET) method, pore size distribution and volume of mesopores were determined by using Barrett–Joyner–Halenda (BJH) method derived from the nitrogen desorption isotherm and t-plot method was used to calculate the external surface area and micropore surface area and volume of micropores.
FE-SEM observations using Scanning Electron Microscope S4160 (HITACHI, Japan) apparatus were carried out in order to examine the morphologies of samples.
Surface acidity of the samples was evaluated by temperature programmed desorption of ammonia (NH3-TPD) using a BELCAT-A apparatus (MicrotracBEL, Japan) equipped with a TCD. 0.2 g of each sample was pretreated at 550 °C for 2 hours under He flow. Then it was cooled down to 200 °C and stripped for 10 minutes. Adsorption took place in a gas stream of NH3/He (50 cm3 min−1, 2.5 wt% of NH3) for 30 minutes followed by 0.5 h stripping to remove the weakly adsorbed amount of NH3. Temperature was then elevated to 1123 K with a 10 K min−1 ramp in a 50 cm3 min−1 He stream for desorption of NH3 molecules.
Changes in crystalline structure of spent catalysts after the process were studied from XRD analysis in order to investigate their stability. Spent catalysts were also examined with a SDT Q600 V20.9 Build 20 thermal gravimetric (TA Instruments, New Castle, DE, USA) to determine amount of coke deposited on their surfaces through thermogravimetric analysis. For this purpose, changes in samples weight were recorded during the rising of temperature from ambient temperature to 800 °C by a 10 °C min−1 ramp. FTIR spectra of spent catalysts were recorded by IR spectrometer (PerkinElmer spectrophotometer version 10.03.06, USA) using the potassium bromide (KBr) pressed disk technique in order to examine the type of coke deposited on the catalyst.
2.4. Catalyst performance test
The experimental apparatus used for catalytic cracking test is shown in Fig. 2. Tests were performed in a continuous down flow fixed bed reactor made from stainless steel in 10 mm internal diameter, which was placed in a conventional furnace to provide the reaction temperature. A thermocouple placed on the reactor outer surface was applied to monitor the furnace temperature.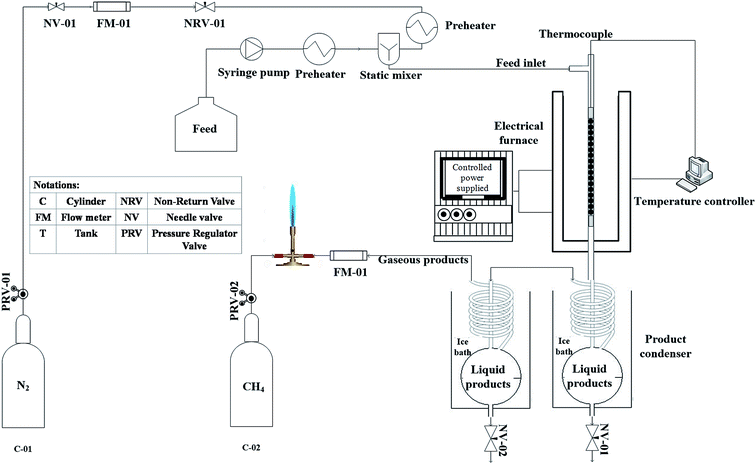 | ||
| Fig. 2 Schematic diagram of experimental apparatus for heavy oil cracking over beta–clinoptilolite physical composites. | ||
Prepared catalysts were shaped into pellets and reactor was loaded with 1 gram of catalyst sample placed between two pieces of quartz wool in the middle of the reactor. Temperature of catalyst bed was monitored using a K-type thermocouple inserted in the middle of the catalyst bed. A middle distillate cut with specifications listed in Table 1 provided from Arak refinery was used as feed. Nitrogen stream as carrier gas was mixed with feed, which was injected via syringe pump and were preheated up to 350 °C in the stream line before entering the reactor. The feed streamline has a by-pass valve before the reactor inlet. After starting the injection with syringe pump, adequate time was considered for feed stream to become steady. When the exiting flow rate of by pass stream became steady, the valve was closed and feed was directed to the reactor. Reactions were conducted at atmospheric pressure and 550 °C. Before the feed injection, reactor was purged with 50 cm3 min−1 nitrogen flow while bed temperature was elevated to 550 °C with a 10 °C min−1 ramp. When desired temperature was reached, feed flow with WHSV = 32 h−1 was injected into the reactor.
| Characteristic | Value |
|---|---|
| Viscosity (cSt) | 6.64 |
| Density (g cm−3) | 0.838 |
| Refractive index | 1.46 |
| Total sulphur (ppm) | 80 |
| IBP (°C) | 294 |
| FBP (°C) | 488 |
At the reactor outlet, exiting liquid product was led to a two-stage condenser and condensable products were collected. Exiting non-condensable gas products were measured in a flow meter and then burned in flare. Amounts of liquid product and volume of gas flow were recorded every 30 minutes. Amount of feed inverted to coke was determined by TGA analysis and amount of gas product was determined by mass balance. Yield of each product was calculated by following equations:
 | (1) |
 | (2) |
 | (3) |
The process was on going for 300 minutes in order to evaluate the stability of catalyst and then feed stream was stopped and nitrogen gas passed through the reactor for one more hour to purge the catalyst bed and take out the remaining hydrocarbons.
Collected liquid product was analyzed by a gas chromatograph-mass spectrometer, GC/MS, (Agilent 6890N/5973 Network Mass Selective Detector) equipped with a HP-1 Agilent column with dimensions measuring 30 m × 0.25 mm × 0.5 μm. The oven was programmed to be held at 50 °C for 2 min, followed by a temperature elevation to 300 °C with 8 °C min−1 ramping and then held for 10 min. The injection volume was 0.2 μl with split ratio equal to 1![[thin space (1/6-em)]](https://www.rsc.org/images/entities/char_2009.gif) :
:![[thin space (1/6-em)]](https://www.rsc.org/images/entities/char_2009.gif) 50 and injector temperature of 320 °C. The unknown compounds were identified by finding the matches of their retention times and MS spectra in the National Institute of Standards and Technology (NIST) library.40 Liquid product was also analyzed using a simulated distillation GC analyzer (Agilent, USA) equipped with flame ionization detector (FID) and a DB-2887 capillary column (10 m × 530 μm) based on ASTM D2887 standard method. Containing hydrocarbons were classified as three cuts based on boiling point ranges: naphtha + kerosene (30–250 °C), diesel (250–370 °C) and heavy oil (370 °C+). Conversion was calculated from below equation:
50 and injector temperature of 320 °C. The unknown compounds were identified by finding the matches of their retention times and MS spectra in the National Institute of Standards and Technology (NIST) library.40 Liquid product was also analyzed using a simulated distillation GC analyzer (Agilent, USA) equipped with flame ionization detector (FID) and a DB-2887 capillary column (10 m × 530 μm) based on ASTM D2887 standard method. Containing hydrocarbons were classified as three cuts based on boiling point ranges: naphtha + kerosene (30–250 °C), diesel (250–370 °C) and heavy oil (370 °C+). Conversion was calculated from below equation:
 | (4) |
Physical properties of liquid product such as density, refractive index (RI) and viscosity were also measured after the collection. Density was measured by using a 10 ml pycnometer (Isolab, Germany) at 20 °C based on ASTM D1480. Abbe Refractometer NAR-1T Liquid (Atago, Japan) was used for determining refractive index of liquid product as specified by ASTM D1218.
Kinematic viscosity of the liquid product was measured by a Cannon Fenske Opaque Liquid viscometer, size 75 (Normalab, France) used in a hot bath according to ASTM D445 standard which consists in measuring the time for a volume of liquid to flow under gravity through a calibrated glass capillary viscometer in certain temperature.
3. Results and discussion
3.1. Characterization of prepared catalysts
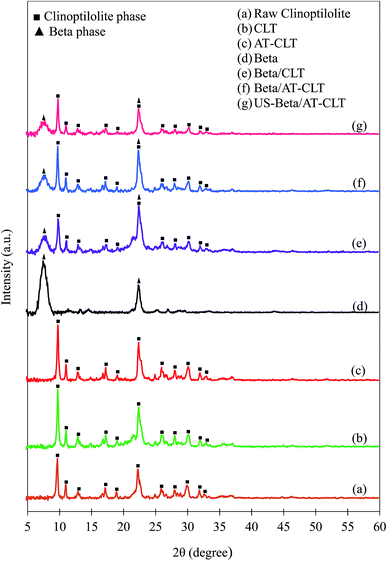 | ||
| Fig. 3 XRD patterns of (a) raw clinoptilolite and treated samples: (b) CLT, (c) AT-CLT, (d) Beta, (e) Beta/CLT, (f) Beta/AT-CLT, (g) US-Beta/AT-CLT (▲Beta phase, ■clinoptilolite phase). | ||
After performing ion exchange treatment, peak intensities have increased for CLT sample. Natural zeolite is a mineral extracted from deposits with slight impurities and dust. After two time ion exchange and filtration and washing with distilled water for several times the impurities are removed and peak intensities and crystallinity of clinoptilolite has increased which is in line with former reports.14,41 This increment in the crystallinity for CLT sample compared to raw clinoptilolite may also be due to the replacement of the metal cations of natural zeolite by protons (H+).41
A slight decrease in peak intensities was observed for AT-CLT and crystalline structure was preserved after alkaline treatment. Silicon extraction from zeolite structure takes place during alkaline treatment of a zeolite as have been revealed numerously in literature so far, which in turn results in a more open structure and mesoporosity.42–44 The OH− present in alkali solution attacks the zeolite structure but since clinoptilolite is negatively charged and silicon atoms are preserved with neighboring four ligand Al atoms, framework damage does not occur and selective dissolution of silicon takes place,17 therefore, only slight decrease in crystallinity is observed. Calculated relative crystallinities are presented in Table 2.
| Sample name | Fresh catalyst relative crystallinity (%) | Spent catalyst relative crystallinity (%) | ||
|---|---|---|---|---|
| Clinoptilolite | Beta | Clinoptilolite | Beta | |
| CLT | 100 | — | 82.8 | — |
| AT-CLT | 92.6 | — | 76.6 | — |
| Beta | — | 100 | — | 100 |
| Beta/CLT | 69.5 | 53.8 | 55.8 | 41.4 |
| Beta/AT-CLT | 85.2 | 52.2 | 55.8 | 35.9 |
| US-Beta/AT-CLT | 49.2 | 37.5 | 48.4 | 33.7 |
XRD pattern of Beta sample presents typical diffraction pattern of zeolite beta with detected peaks at 2θ = 7.5 and 22.4 (JCPDS 48-0074).
Beta/CLT sample XRD pattern displays both crystalline phases of clinoptilolite and beta zeolite indicating the co-existence of both phases in the physical mixture of beta and clinoptilolite, meanwhile, no new peak is observed. Intensities of all the peaks have decreased compared to their parents, CLT and Beta, which is in line with results of Gao et al.30 in which, diffraction peaks have lower intensities after making a physical mixture of Beta-MCM-41.
Ultrasound irradiation has affected the crystalline structure of treated physical mixture sample compared to Beta/AT-CLT sample. Intensities of all the peaks have decreased for US-Beta/AT-CLT sample compared to Beta/AT-CLT sample but crystalline structure is conserved. It has been reported in the literature that reduction in relative crystallinity in the presence of ultrasound irradiation can be ascribed to improvement of active phase dispersion over the catalyst support.38,39,45 Explosion of cavitation bubbles results in formation of microjets in solid–liquid interface, which suppress the formation of agglomeration on the support surface. In other words, higher level of dispersion is achievable by increment of micromixing and creation of harsh agitations due to the employing ultrasound during catalyst synthesis.46
 | ||
| Fig. 4 Nitrogen adsorption–desorption isotherms for prepared samples: (a) CLT, (b) AT-CLT, (c) Beta/CLT, (d) Beta/AT-CLT, (e) US-Beta/AT-CLT, (f) Beta. | ||
 | ||
| Fig. 5 BJH pore size distribution of treated samples: (a) CLT, (b) AT-CLT, (c) Beta/CLT, (d) Beta/AT-CLT, (e) US-Beta/AT-CLT, (f) Beta. | ||
| Sample | SBET (m2 g−1) | SEXTa (m2 g−1) | Smicb (m2 g−1) | Vtc (cm3 g−1) | Vmicd (cm3 g−1) | Vmesoe (cm3 g−1) |
|---|---|---|---|---|---|---|
| a t-Plot external surface area.b t-Plot micropore surface area.c Volume adsorbed at P/P0 = 0.99.d t-Plot micropore volume.e Mesopore volume (Vtotal − Vmicro). | ||||||
| Beta | 708.9 | 252.6 | 456.4 | 0.943 | 0.210 | 0.733 |
| CLT | 34.5 | 21.1 | 13.4 | 0.081 | 0.006 | 0.075 |
| AT-CLT | 41.1 | 25.1 | 15.9 | 0.144 | 0.007 | 0.137 |
| Beta/CLT | 170.6 | 69.1 | 101.5 | 0.260 | 0.046 | 0.214 |
| Beta/AT-CLT | 171.3 | 72.2 | 99.1 | 0.290 | 0.045 | 0.245 |
| US-Beta/AT-CLT | 232.9 | 97.9 | 135 | 0.415 | 0.062 | 0.353 |
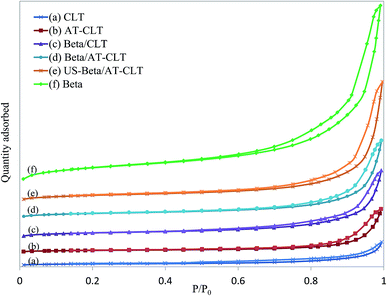
Beta sample shows a typical type IV isotherm with H-3 type hysteresis loop at high relative pressures, indicating on presence of slit mesoporous structure.25 Extracted data from N2 adsorption–desorption analysis by BET method reveals that Beta sample has a very high surface area (708.9 m2 g−1) and large total pore volume (0.94 cm3 g−1). Micropore area and micropore volume derived from the adsorption isotherm by means of t-plot method are equal to 252.6 m2 g−1 and 0.21 cm3 g−1 respectively.
Results revealed that alkaline treatment has notably influenced porous structure of clinoptilolite. Ion exchanged clinoptilolite sample (CLT) and alkaline treated sample (AT-CLT), have shown type II isotherms attributed to unrestricted monolayer-multilayer adsorption material with hysteresis type 3, which is associated with the filling and emptying of mesopores. CLT sample and AT-CLT samples have similar isotherms at low relative pressure, but at higher pressures, the quantity adsorbed is larger on AT-CLT, which is explained by larger total pore volume of the latter. Alkaline treatment increased total pore volume of CLT by 77.8%. Microporous volume and mesoporous volume were increased by 16% and 83% respectively. These improved textural properties which are consistent with results of previous researches,17,47 arise from silicon extraction from zeolite structure which results in creation of voids and increment of pore volumes and external surface area.17 It has been demonstrated in literature that sever silicon extraction may destroy micropore channels of zeolite structure, hence microporous volume decreases.34 Increase in micropore volume during alkaline treatment proves that moderate conditions of alkaline treatment have been applied which is in line with XRD results. Since active sites are located in micropores it is an advantage that alkaline treatment has successfully improved both microporous and mesoporous volumes.
Physical mixture of Beta and CLT, Beta/CLT with 30 wt% of Beta, presents higher surface area as well as pore volume compared to CLT sample. BET surface area has increased to 170.6 m2 g−1 and microporous and mesoporous volumes have notably increased to 0.046 cm3 g−1 and 0.214 cm3 g−1 respectively. Distributed Beta particles in the mixture are the reason of these textural improvements. Adsorption isotherm of Beta/CLT is attributed to materials containing both micropores and mesopores and can be classified as type II with hysteresis evidencing presence of mesoporous structure and compared to CLT sample has much higher N2 adsorption at high relative pressures.
Beta/AT-CLT has presented similar isotherm with higher uptakes compared to Beta/CLT at high relative pressures, which regards to higher mesopore volume of Beta/AT-CLT resulting in higher adsorbed quantity. These physically mixed samples, show larger hysteresis loops and higher N2 uptakes due to the presence of Beta distributed in the mixtures, which results in more mesoporosity and internal voids.
Physical mixture of Beta and AT-CLT sample prepared under ultrasound irradiation, US-Beta/AT-CLT, has notable superiorities in textural properties compared to Beta/AT-CLT. Applying ultrasound irradiation during mixing improved specific surface area, micropore surface area and mesopore volume by 34%, 36% and 44% respectively while the treatment took place in shorter time and was conducted in room temperature compared to conventional mixing method.
It has been previously revealed in the literature that ultrasound irradiation has a positive effect on particle distribution in aqueous media.35–38 During conventional mixing pore plugging and agglomeration of surface particles occur. These problems are partially solved under sonication due to the induced agitations by microjets.39 Better distribution of Beta in physical mixture has led to increment of specific surface area and pore volume.
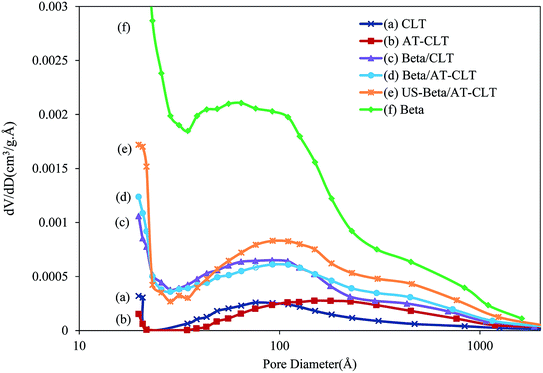
The BJH pore size distributions of the samples are displayed in Fig. 5. Beta presents two peaks around 10 nm and 100 nm with narrower distribution around 10 nm. The relating pattern for Beta evidences the presence of high amount of mesopores with pore diameter sizes approximately around 10 nm in this sample. CLT diagram exhibits one peak around 10 nm with much smaller pore volume compared to Beta. After alkaline treatment, noticeable shift of the diagram to larger pore diameters around 100 nm has occurred for AT-CLT sample. This phenomena is in line with results of Wang et al.,48 who observed pore size increment after performing alkaline treatment on clinoptilolite and attributed this to desilication.
Distribution pattern of Beta/CLT presents two peaks similar to Beta sample. Pores with diameters around 100 nm in the composite, come from Beta particles distributed in the mixture, however with lower pore volume amounts compared to Beta sample. Duan et al.29 observed similar results in preparing beta-MCM-48 composite.
Pattern of US-Beta/AT-CLT is clearly more similar to Beta sample with more centralized pore size distribution around 10 nm and 100 nm, compared to Beta/AT-CLT. These results clearly demonstrate that Beta has been dispersed more uniformly in the composite under sonication exhibiting higher number of pores as well as narrower size distributions.49
 | ||
| Fig. 6 SEM pictures of prepared samples, (a) Beta, (b) CLT, (c) AT-CLT, (d) Beta/CLT, (e) Beta/AT-CLT, (f) US-Beta/AT-CLT. | ||
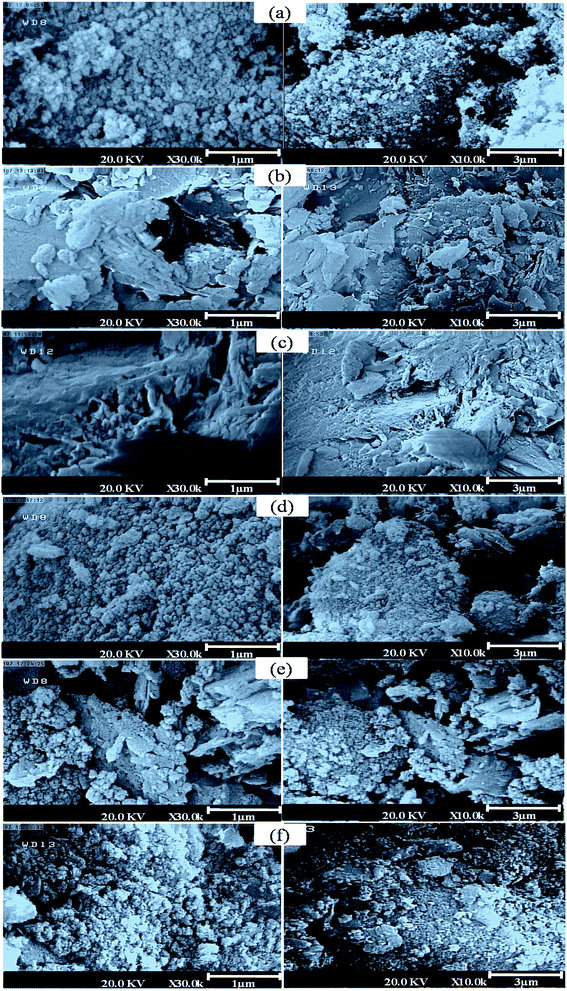
Fig. 6(d) shows nanometric particles of Beta with different shapes distributed on plates of CLT in Beta/CLT sample. Aggregates of Beta particles on the surface are observable which indicates nonhomogeneous distribution of Beta on CLT sample. Minor morphological differences are observed between this sample and Beta/AT-CLT sample (Fig. 6(e)).
However, SEM pictures of US-Beta/AT-CLT shown in Fig. 6(f) compared to Beta/AT-CLT reveal that ultrasound irradiation has affected the distribution of Beta particles on AT-CLT surface. Better surface coverage and more homogenous distribution with less aggregate formation are achieved by using ultrasound irradiation. Explosion of cavitation bubbles formed during sonication causes shock waves which push the aggregated particles on the external surface, smashing them and leading them to penetrate into the pores and forming smaller particles.39,53 Some fine particles are observed in this sample, which is a result of harsh environment of sonicated mixing.
 | ||
| Fig. 7 NH3-TPD spectra of prepared samples: (a) CLT, (b) AT-CLT, (c) Beta, (d) Beta/CLT, (e) Beta/AT-CLT, (f) US-Beta/AT-CLT. | ||
| Samples | AT (mmol g−1) | AW (mmol g−1) | AM (mmol g−1) | AS (mmol g−1) |
|---|---|---|---|---|
| a AT: Total acidity. AM: Medium acidity. AW: Weak acidity. AS: Strong acidity. | ||||
| CLT | 0.62 | 0.03 | 0.07 | 0.53 |
| AT-CLT | 2.29 | 1.43 | 0.38 | 0.48 |
| Beta | 1.16 | 0.44 | 0.32 | 0.39 |
| Beta/CLT | 1.67 | 1.09 | 0.25 | 0.33 |
| Beta/AT-CLT | 1.89 | 1.15 | 0.32 | 0.42 |
| US-Beta/AT-CLT | 1.70 | 1.14 | 0.23 | 0.34 |
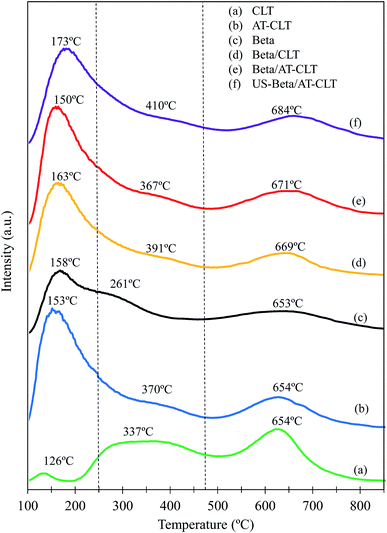
According to the patterns obtained for CLT and Beta samples these two zeolites have different intrinsic acidic properties. Ammonia desorption profile for Beta zeolite indicates on the presence of weak, medium and strong acidity, which is compatible with results revealed elsewhere.29,50 High concentration of weak and moderate acidic sites on Beta, which prevents over cracking of products and reactants, is the reason of higher selectivity of this zeolite to intermediate cracking products in heavy oil upgrading.30 CLT sample has also three distinct peaks at 126 °C, 337 °C and 654 °C. It has been proposed that high temperature peak is associated to the framework Al atoms which induce strong acidity, while low temperature peak represents weak acid sites ascribed to non-framework Al atoms.54,55 Natural zeolite used in this research has a Si/Al ratio equal to 5.66, which indicates the presence of high amount of framework Al atoms inducing strong acidity in the zeolite. Total acidity of Beta is larger than CLT due to the higher amounts of weak and medium-strong acid sites present in the Beta sample.
After conducting alkaline treatment on clinoptilolite, amount of weak acid sites has extremely increased for AT-CLT sample in expense of strong acid sites. Li et al.56 observed similar results after ZSM-5 alkaline treatment and it was demonstrated that transformation of strong Brønsted acid sites to Lewis acid sites which have weaker acidity strength, is attributed to the Si–OH sites removal due to the desilication and relocating of extracted Al atom sites on external surface of the zeolite and changing into non-framework Al atoms.56 Temperature of desorption for weak and moderate acid sites on AT-CLT sample are slightly higher than that of CLT sample (154 °C and 370 °C). Therefore, one can say these acid sites are slightly stronger than those on CLT sample.55
Beta/AT-CLT sample presented higher acidity compared to Beta/CLT. All three kinds of acidic sites possess higher amounts compared to Beta/CLT since alkaline treatment extremely increased the acidity of clinoptilolite. US-Beta/AT-CLT exhibits slightly lower acidity compared to Beta/AT-CLT which may be due to the lower crystallinity of prepared composite under ultrasound irradiation which is in agreement with results of XRD analysis for this sample.
3.2. Catalytic performances of prepared samples in heavy oil upgrading process
In order to investigate and compare the catalytic performances of different prepared samples in upgrading of heavy oil, continuous fixed bed catalytic cracking of heavy oil feed was conducted for each sample according to the procedure explained in Section 2.4. Catalytic activity was evaluated based on the yield of liquid product after 5 h time on stream and liquid product quality for each sample. In addition, TGA, FTIR and XRD analysis of spent catalyst were studied after the process.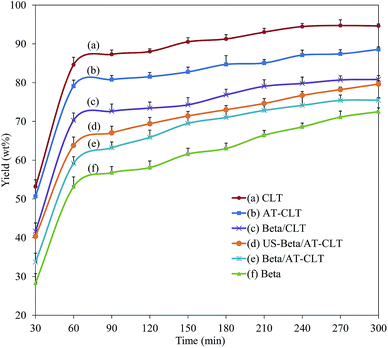 | ||
| Fig. 8 Liquid product yield as a function of time on stream for prepared samples (reaction conditions: temperature = 550 °C, pressure = 1 atm and TOS = 300 min). | ||
Amount of liquid production on Beta/CLT and Beta/AT-CLT has reached to an approximately constant value after 270 minutes, which could be due to the lower mesoporous volume of these samples. CLT and AT-CLT with lowest mesoporosities among all the samples have reached their maximum values after around 240 minutes time on stream.
Gas, liquid and coke products yields and physical properties of liquid products of heavy oil upgrading process are presented in Table 5. Conversion of heavy oil feed during the catalytic cracking is companied by production of gaseous products over catalytic active sites. Higher amount of gas production indicates on higher activity of acidic sites of the catalyst. Maximum gas yield was obtained over Beta and minimum gas yield occurred on CLT sample. Alkaline treatment and creation of larger mesoporous structure as well as increased acidity led to increase in the gas yield over AT-CLT sample. Compared to CLT, amount of gaseous products increased by 40% over AT-CLT. The same result was observed by Oruji et al.43 after performing alkaline treatment on Y zeolite, where gas production and catalyst activity increased upon inducing mesopores in Y zeolite through alkaline treatment.
| Sample | Beta | CLT | AT-CLT | Beta/CLT | Beta/AT-CLT | US-Beta/AT-CLT |
|---|---|---|---|---|---|---|
| a Calculated from eqn (4) based on GC/SIMDIS results. | ||||||
| Product yield, wt% | ||||||
| Gas | 40.1 | 13.2 | 18.5 | 27.7 | 32.3 | 30.5 |
| Liquid | 59.8 | 86.8 | 81.4 | 72.2 | 67.6 | 69.3 |
| Coke | 0.14 | 0.092 | 0.07 | 0.095 | 0.105 | 0.117 |
| Total | 100 | 100 | 100 | 100 | 100 | 100 |
![[thin space (1/6-em)]](https://www.rsc.org/images/entities/char_2009.gif) |
||||||
| Liquid properties | ||||||
| Viscosity, cSt | 1.51 | 4.38 | 3.87 | 2.46 | 1.64 | 1.87 |
| Density, g cm−3 | 0.829 | 0.837 | 0.837 | 0.835 | 0.832 | 0.833 |
| Refractive index, nd | 1.451 | 1.46 | 1.458 | 1.455 | 1.452 | 1.453 |
| Conversiona (%) | 29 | 49.8 | 59.9 | 68 | 69.7 | 71 |
Beta/CLT composite yielded 27.7 wt% gaseous products, which is two times larger than amount of gas yield on CLT sample (13.2 wt%). Presence of 30 wt% Beta in the composite and higher mesoporous structure along with higher total acidity increase the catalyst activity. It should be noticed that amount of gaseous products obtained over this composite is higher than sum of gas produced over each phase individually. In another words there is a synergetic effect between two phases, which results in higher activity. Induced mesopores in the composite structure originating from Beta, facilitate the diffusion of hydrocarbon molecules into clinoptilolite micropores, where strong acid sites are located and more cracking reactions occur.
Beta/AT-CLT has produced higher amount of gaseous products with 32.3 wt%. US-Beta/AT-CLT sample yielded partially lower gas product with 30.5 wt%. Although, largest amount of mesopore volume and surface areas were induced in this sample due to the sonication, higher acidity of Beta/AT-CLT resulted in partially higher activity of the later. These results are in line with result of Zhou et al.54 as well as Plana-Pallejà et al.,58 who concluded that optimal catalytic performance is dependent on tuned structural properties and acidity of the zeolite.
US-Beta/AT-CLT sample has higher amount of mesopore volume and external surface compared to Beta/AT-CLT sample but slight decrease in acidity and crystallinity has resulted in less catalytic activity and viscosity reduction.13 Densities and refractive indexes have decreased over the samples by similar order as viscosity.
Liquid products and feed were also analyzed by SIMDIS GC in order to determine the boiling point distribution and were divided into three different cuts: naphtha + kerosene (30–250 °C), diesel (250–370 °C) and heavy oil (370 °C+). Amount of conversion over each sample, calculated from eqn (4), is presented in Table 5.
As shown in Fig. 9, it is revealed that the feed used in this process is mostly composed of heavy hydrocarbons with 97.8 wt% of 370 °C+ cut. Amount of diesel cut and naphtha + kerosene cut in the feed were 2.8 wt% and 0.005 wt% respectively. Catalytic cracking over CLT with 29% conversion has increased these cuts to 28.54 wt% and 2.3 wt% which was the lowest conversion achieved among all the samples. On the other hand, Beta sample has predictably yielded the highest amount of light cuts with 71% conversion and 35.58 wt% naphtha + kerosene and 35.72 wt% of diesel cut.
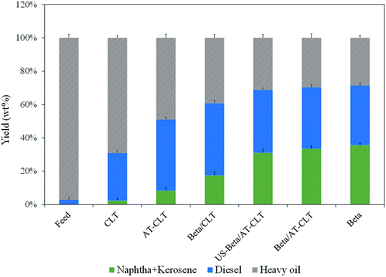 | ||
| Fig. 9 Boiling point distribution of feed and products of different prepared catalysts (reaction conditions: temperature = 550 °C, pressure = 1 atm and TOS = 300 min). | ||
Performing alkaline treatment on CLT sample has influenced the liquid product content and has increased naphtha + kerosene cut from 2.3 wt% to 8.32 wt% and diesel range hydrocarbons have increased to 42.61 wt% from 28.54 wt% on CLT.
Mixing beta zeolite with clinoptilolite has resulted in much more production of light hydrocarbons as can be seen for composite samples. Beta/AT-CLT has shown a remarkable performance in production of lighter hydrocarbons, very close to Beta sample. Production of 33.51 wt% naphtha + kerosene range hydrocarbons and 69.7% conversion compared to Beta sample is quite satisfactory. Results for US-Beta/AT-CLT sample are quite similar with minor decrease in conversion, which could be attributed to lower acidity compared to Beta/AT-CLT sample. These results are also in line with values of liquid physical properties displayed in Table 5. Conversion of high boiling point hydrocarbons present in feed, to lighter hydrocarbons leads to the formation of products with lower viscosities.
Bulky molecules of heavy hydrocarbons fail to enter the micropores with small openings, where acidic sites are located. Mesoporosity increases diffusion and mass transfer rate in zeolite pore structure, resulting in more efficient cracking performance toward higher hydrocarbons. Results obtained from heavy oil upgrading process reveal that synergetic effect of optimized acidity and mesoporous structure induced in the composite has improved catalytic performance of 30 wt% Beta/AT-CLT and US-Beta/AT-CLT to a comparable level to the Beta sample.
Liquid products were also explored by GC/MS analysis to determine the PONA distribution of naphtha + kerosene fraction produced over the catalysts. Since viscosity reduction and conversion on CLT and AT-CLT samples were low, GC/MS analysis was only performed on the products of Beta and three composite samples, which resulted more comparable conversions. Based on the results presented in Table 6, it was revealed that amount of paraffins, olefins, naphthenes and aromatics in the produced naphtha + kerosene fraction is different for each sample depending on the pore structure and acidity properties of catalyst in spite of similar degree of conversion. Amount of paraffin produced over different samples does not change remarkably but yield of aromatics and olefins and naphthenes have noticeable differences.
| PONA yield (wt%) | Catalyst sample | |||
|---|---|---|---|---|
| Paraffin | Olefin | Naphthene | Aromatic | |
| Beta | 5.6 | 24.5 | 0.98 | 68.9 |
| Beta/CLT | 4.3 | 48.1 | 10.2 | 37.4 |
| Beta/AT-CLT | 4.5 | 36.6 | 4.8 | 54.9 |
| US-Beta/AT-CLT | 4.2 | 38.6 | 12.9 | 44.3 |
According to the literature, strong Brønsted acidic sites are responsible of hydrogen transfer reactions and aromatic production.54,61 With optimized amount of acidity, naphthenes and olefins have the possibility to convert to aromatics and paraffins according to the general reaction:43
| Naphthenes + olefins → aromatics + paraffins |
This conversion could be attributed to the hydrogen transfer ability of the catalyst, which is a function of acidity and mesoporosity. Beta sample has produced highest amount of paraffinic and aromatic hydrocarbons due to the high acidity and mesoporous structure, which facilitates diffusion through the micropores. Minimum amount of aromatic production has occurred for Beta/CLT sample. Conducting alkali treatment has increased aromatic production from 37.4% over Beta/CLT composite to 54.9% over Beta/AT-CLT sample due to the improved mass transfer inside the pores as well as acidity. Ultrasound irradiated sample has shown lower improvement in aromatic production due to the lower acidity compared to Beta/AT-CLT sample.
Plana et al.58 observed same results in their research on the effect of catalyst properties on hydrocarbon distribution in the product, during Fischer–Tropsch synthesis (FTS). Based on their results higher aromatic production occurs over the sample with highest acidity. It has been demonstrated58 that aromatization occurs in both the external acid sites and in Brønsted acid sites located inside the micropores (with diffusion constraints). Therefore, Beta/AT-CLT sample shows close performance to Beta sample, since it has a lot of surface acidity induced after alkaline treatment.
Alkaline treatment has decreased the amount of coke formation on AT-CLT due to the increased mesopore volume and external surface area compared to CLT. The highest amount of coke was deposited over Beta sample due to the higher degree of catalytic activity and high amount of aromatics produced over this sample.
Beta/AT-CLT and US-Beta/AT-CLT sample exhibited lower coke production compared to Beta while resulted similar degree of conversion.
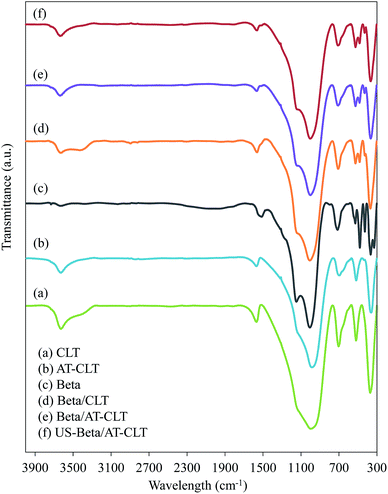
Coke produced over the samples was also examined by FTIR analysis. Fig. 10 shows FTIR spectra recorded for all the prepared samples. The main characteristic bands of clinoptilolite are at the regions of 4000–3000 cm−1 and 1900–400 cm−1 in which, observed peak at 467 cm−1 is related to the vibration of Al–O bands and the one at 612 cm−1 is ascribed to the external linkage of tetrahedral. Characteristic peaks observed at 792 cm−1 and 1079 cm−1 belong to the vibration of Si–O–Si bands (asymmetric and symmetric vibrations of T–O–T) and existence of characteristic peak at 3644 cm−1 (3400 and 3800 cm−1) represents hydroxyl presence.14,17,64
FTIR spectra of Beta sample shows characteristic peaks of beta zeolite. Peaks at 522 cm−1 and 574 cm−1 are due to the presence of five-six membered rings and peak around 1087 cm−1 is related to asymmetric O–T–O stretching vibration which is related to Si/Al ratio of the framework.65
Based on the literature the bands located in 1300–1700 cm−1 region are assigned to unsaturated carbonaceous components deposited on the catalyst.43,66 Peaks around 1600 cm−1 observed in all the samples, are attributed to the stretching vibrations of C![[double bond, length as m-dash]](https://www.rsc.org/images/entities/char_e001.gif) C band in the aromatic rings.67 Peak observed at 1583 cm−1 for Beta sample is corresponded to polycondensed aromatic coke and peak observed at 1635 cm−1 for CLT and AT-CLT samples could be attributed to the conjugated olefin coke according to the previous reports.43,66,68 This is also in line with GC-Mass results, which revealed that aromatic compounds were dominating products over Beta sample while composites of beta and clinoptilolite resulted in production of more olefin compounds compared to Beta. Beta/CLT, Beta/AT-CLT and US-Beta/AT-CLT samples represent shifted peaks at 1630 cm−1, which is explained by more olefins produced on these samples compared to Beta sample.
C band in the aromatic rings.67 Peak observed at 1583 cm−1 for Beta sample is corresponded to polycondensed aromatic coke and peak observed at 1635 cm−1 for CLT and AT-CLT samples could be attributed to the conjugated olefin coke according to the previous reports.43,66,68 This is also in line with GC-Mass results, which revealed that aromatic compounds were dominating products over Beta sample while composites of beta and clinoptilolite resulted in production of more olefin compounds compared to Beta. Beta/CLT, Beta/AT-CLT and US-Beta/AT-CLT samples represent shifted peaks at 1630 cm−1, which is explained by more olefins produced on these samples compared to Beta sample.
Bands located in 2800–3100 cm−1 region, are related to stretching vibrations of aliphatic coke,66–68 and the band at 1558 cm−1 is assigned to the stretching vibration of C![[double bond, length as m-dash]](https://www.rsc.org/images/entities/char_e001.gif) C band in microcrystalline graphitic carbon structures which none of them are observed for prepared samples as can be seen in Fig. 10.43 In addition, bands at 3000–3400 cm−1 are assigned to weak C–H stretching vibration corresponded to aromatic groups and absence of these peaks reveals that aromatic groups deposited on these catalysts have low content of hydrogen.67
C band in microcrystalline graphitic carbon structures which none of them are observed for prepared samples as can be seen in Fig. 10.43 In addition, bands at 3000–3400 cm−1 are assigned to weak C–H stretching vibration corresponded to aromatic groups and absence of these peaks reveals that aromatic groups deposited on these catalysts have low content of hydrogen.67
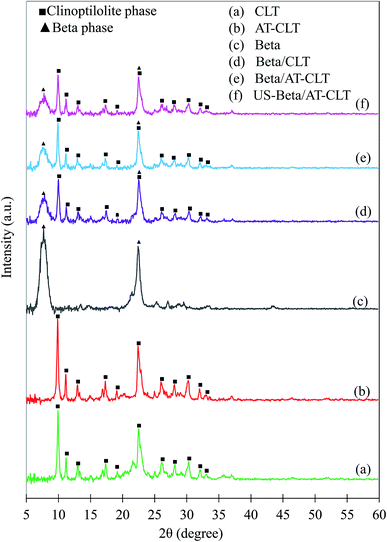 | ||
| Fig. 11 XRD patterns of calcinated spent catalysts: (a) CLT, (b) AT-CLT, (c) Beta, (d) Beta/CLT, (e) Beta/AT-CLT, (f) US-Beta/AT-CLT (▲Beta phase, ■clinoptilolite phase). | ||
Among the prepared composites, US-Beta/AT-CLT shows the minimum decrease in crystallinity, which means that ultrasound irradiation has improved the stability of prepared composite structure. Khoshbin et al.49 also studied the spent ZSM-5 catalysts modified with sonication and concluded that ultrasound irradiation increased the stability of catalyst compared to conventional modification. Larger external surface area of sonicated sample could be the reason of higher stability compared to conventionally mixed composite. Higher external surface area leads to formation of higher number of pore openings inhibiting the pore blockage. In other words, increment in number of pore openings reduces the likelihood of pore plugging and deactivation of catalyst. Sene et al.39 also demonstrated that formation of microjets after bubble implosions near the surface of the particles, cause high-velocity interparticle collisions in solid–liquid system resulting in more stable positioning of particles on the clinoptilolite surface in the mixture.39
This evaluation reveals that although Beta/AT-CLT sample shows slightly better cracking performance toward production of lighter hydrocarbons, US-Beta/AT-CLT exhibits more stability in cracking reaction after 5 h time on stream and is more suitable for regeneration and further utilizations.
4. Conclusions
Physical composites of beta zeolite and treated clinoptilolite samples were prepared by conventional and sonicated mixing procedures. XRD analysis proved the presence of both zeolitic phases in the composites while preserving crystalline structure. Results revealed that alkaline treatment of clinoptilolite zeolite increased mesopore volume and total acidity of this sample. Preparing 30 wt% composites of beta with clinoptilolite samples also resulted in improved mesoporosity and acidity based on BET and NH3-TPD analyses. Prepared samples were examined in heavy oil upgrading process and the highest amount of light hydrocarbon production occurred on beta zeolite predictably, although composite of beta and alkali treated clinoptilolite exhibited very similar results to pure beta sample in viscosity reduction and lighter hydrocarbon production, while producing lower amount of coke compared to beta zeolite. Preparing composite under ultrasound irradiation remarkably increased the structural stability of the composite after 5 h time on stream.30 wt% beta–clinoptilolite physical composite prepared in this study exhibited comparable cracking performance to pure beta zeolite and noticeable structural stability. Obtaining these results is satisfactory since development of modification processes, which improve catalytic performance and structural stability of natural zeolite is economically desirable, especially for heavy oil upgrading processes with massive catalyst consumptions.
Conflicts of interest
There are no conflicts to declare.References
- B. Sarkar, W. Kwek, D. Verma and J. Kim, Appl. Catal., A, 2017, 545, 148–158 CrossRef CAS
.
- M. Ghashghaee and S. Shirvani, Ind. Eng. Chem. Res., 2018, 57, 7421–7430 CrossRef CAS
.
- A. Demirbas, A. Bafail and A.-S. Nizami, Pet. Sci. Technol., 2016, 34, 303–308 CrossRef CAS
.
- M. S. Rana, V. Sámano, J. Ancheyta and J. A. I. Diaz, Fuel, 2007, 86, 1216–1231 CrossRef CAS
.
- B. Roozbehani, M. Motevassel, M. Mirdrikvand, S. I. Moqadam and A. Kharaghani, Clean Technol. Environ. Policy, 2017, 19, 123–136 CrossRef CAS
.
- A. C. F. Coriolano, A. A. A. Oliveira, R. A. F. Bandeira, V. J. Fernandes and A. S. Araujo, J. Therm. Anal. Calorim., 2015, 119, 2151–2157 CrossRef CAS
.
- A. AfsharEbrahimi and S. Tarighi, Pet. Sci. Technol., 2015, 33, 415–421 CrossRef CAS
.
- S.-C. Baek, Y.-J. Lee, K.-W. Jun and S. B. Hong, Energy Fuels, 2009, 23, 593–598 CrossRef CAS
.
- A. S. M. Junaid, H. Yin, A. Koenig, P. Swenson, J. Chowdhury, G. Burland, W. C. McCaffrey and S. M. Kuznicki, Appl. Catal., A, 2009, 354, 44–49 CrossRef CAS
.
- X. Fu, X. Sheng, Y. Zhou, Z. Fu, S. Zhao, X. Bu and C. Zhang, RSC Adv., 2016, 6, 50630–50639 RSC
.
- F. Gorzin, J. Towfighi Darian, F. Yaripour and S. M. Mousavi, RSC Adv., 2018, 8, 41131–41142 RSC
.
- L. Zhao, J. Gao, C. Xu and B. Shen, Fuel Process. Technol., 2011, 92, 414–420 CrossRef CAS
.
- K. Tarach, K. Góra-Marek, J. Tekla, K. Brylewska, J. Datka, K. Mlekodaj, W. Makowski, M. C. Igualada López, J. Martínez Triguero and F. Rey, J. Catal., 2014, 312, 46–57 CrossRef CAS
.
- M. Moradi, R. Karimzadeh and E. S. Moosavi, Fuel, 2018, 217, 467–477 CrossRef CAS
.
- H. Sun, P. Peng, Y. Wang, C. Li, F. Subhan, P. Bai, W. Xing, Z. Zhang, Z. Liu and Z. Yan, J. Porous Mater., 2017, 24, 1513–1525 CrossRef CAS
.
- A. Dziedzicka, B. Sulikowski and M. Ruggiero-Mikołajczyk, Catal. Today, 2016, 259, 50–58 CrossRef CAS
.
- H. Lin, Q.-l. Liu, Y.-b. Dong, Y.-h. He and L. Wang, Microporous Mesoporous Mater., 2015, 218, 174–179 CrossRef CAS
.
- W. Ma, B. Liu, X. Ji, X. Li, B. Yan, Z. Cheng and G. Chen, Biomass Bioenergy, 2017, 102, 31–36 CrossRef CAS
.
- A. A. Ebrahimi, S. Tarighi and A. B. Ani, Kinet. Catal., 2016, 57, 610–616 CrossRef CAS
.
- Y. Li, W. Zhang, X. Wang, Y. Zhang, T. Dou and K. Xie, J. Porous Mater., 2008, 15, 133–138 CrossRef CAS
.
- J. Zheng, X. Zhang, Y. Wang, Y. Bai, W. Sun and R. Li, J. Porous Mater., 2008, 16, 731 CrossRef
.
- Y. Zhao, X. Zhao, J. Deng and C. He, J. Radioanal. Nucl. Chem., 2016, 308, 701–709 CrossRef CAS
.
- P. G. Smirniotis and E. Ruckenstein, Ind. Eng. Chem. Res., 1994, 33, 800–813 CrossRef CAS
.
- U. Khalil, O. Muraza, H. Kondoh, G. Watanabe, Y. Nakasaka, A. Al-Amer and T. Masuda, Energy Fuels, 2016, 30, 1304–1309 CAS
.
- Z. Liu, L. Zhao, T. Zhang, Y. Wang, Y. Xu, S. Komarneni, Y. Wang, X. Liu and Z. Yan, J. Porous Mater., 2018 DOI:10.1007/s10934-018-0697-x
.
- X. Zhang, Q. Guo, B. Qin, Z. Zhang, F. Ling, W. Sun and R. Li, Catal. Today, 2010, 149, 212–217 CrossRef CAS
.
- B. Ren, S. Bai, J. Sun, F. Zhang and M. Fan, RSC Adv., 2014, 4, 22755–22758 RSC
.
- Y.-S. Ooi, R. Zakaria, A. R. Mohamed and S. Bhatia, Appl. Catal., A, 2004, 274, 15–23 CrossRef CAS
.
- A. Duan, C. Wang, Z. Zhao, Z. Tong, T. Li, H. Wu, H. Fan, G. Jiang and J. Liu, J. Porous Mater., 2013, 20, 1195–1204 CrossRef CAS
.
- L. Gao, Z. Shi, U. J. Etim, P. Wu, D. Han, W. Xing, S. Mintova, P. Bai and Z. Yan, Microporous Mesoporous Mater., 2019, 277, 17–28 CrossRef CAS
.
- H. He, B. Wu and C. Yang, Int. J. Environ. Sci. Technol., 2018 DOI:10.1007/s13762-018-2148-2
.
- H. He, Y. Cheng, C. Yang, G. Zeng, C. Zhu and Z. Yan, J. Environ. Sci., 2017, 54, 135–141 CrossRef PubMed
.
- M. Faryadi, M. Rahimi, S. Safari and N. Moradi, Chem. Eng. Process., 2014, 77, 13–21 CrossRef CAS
.
- R. Khoshbin and R. Karimzadeh, Adv. Powder Technol., 2017, 28, 1888–1897 CrossRef CAS
.
- S. Bennici, A. Gervasini and V. Ragaini, Ultrason. Sonochem., 2003, 10, 61–64 CrossRef CAS PubMed
.
- L. Belaya, V. Doronin and T. Sorokina, Catalysis in Industry, 2009, 1, 237–242 CrossRef
.
- H. Liu, S. Zhang, Y. Zhou, Y. Zhang, L. Bai and L. Huang, Ultrason. Sonochem., 2011, 18, 19–22 CrossRef CAS PubMed
.
- Y. Vafaeian, M. Haghighi and S. Aghamohammadi, Energy Convers. Manage., 2013, 76, 1093–1103 CrossRef CAS
.
- R. Akbari Sene, G. R. Moradi and S. Sharifnia, Ultrason. Sonochem., 2017, 37, 490–501 CrossRef CAS PubMed
.
- C. Ma, J. Yu, Q. Yan, Z. Song, K. Wang, B. Wang and L. Sun, Polym. Degrad. Stab., 2017, 146, 1–12 CrossRef CAS
.
- A. Ates and C. Hardacre, J. Colloid Interface Sci., 2012, 372, 130–140 CrossRef CAS PubMed
.
- S. Asadi, L. Vafi and R. Karimzadeh, Microporous Mesoporous
Mater., 2018, 255, 253–260 CrossRef CAS
.
- S. Oruji, R. Khoshbin and R. Karimzadeh, Fuel Process. Technol., 2018, 176, 283–295 CrossRef CAS
.
- R. A. Sene, S. Sharifnia and G. R. Moradi, Int. J. Hydrogen Energy, 2018, 43, 695–707 CrossRef CAS
.
- F. Rahmani, M. Haghighi and S. Mahboob, Ultrason. Sonochem., 2016, 33, 150–163 CrossRef CAS PubMed
.
- M. Rahimi, S. Safari, M. Faryadi and N. Moradi, Chem. Eng. Process., 2014, 78, 17–26 CrossRef CAS
.
- M. Akgül and A. Karabakan, Microporous Mesoporous Mater., 2011, 145, 157–164 CrossRef
.
- C. Wang, S. Leng, H. Guo, L. Cao and J. Huang, Appl. Surf. Sci., 2019, 478, 319–326 CrossRef CAS
.
- R. Khoshbin and R. Karimzadeh, Adv. Powder Technol., 2017, 28, 973–982 CrossRef CAS
.
- T. De Baerdemaeker, B. Yilmaz, U. Müller, M. Feyen, F.-S. Xiao, W. Zhang, T. Tatsumi, H. Gies, X. Bao and D. De Vos, J. Catal., 2013, 308, 73–81 CrossRef CAS
.
- L. I. Gurevich Messina, P. R. Bonelli and A. L. Cukierman, Fuel Process. Technol., 2017, 159, 160–167 CrossRef CAS
.
- D. Verboekend, T. C. Keller, M. Milina, R. Hauert and J. Pérez-Ramírez, Chem. Mater., 2013, 25, 1947–1959 CrossRef CAS
.
- S. Allahyari, M. Haghighi, A. Ebadi and S. Hosseinzadeh, Ultrason. Sonochem., 2014, 21, 663–673 CrossRef CAS
.
- F. Zhou, Y. Gao, G. Wu, F. Ma and C. Liu, Microporous Mesoporous Mater., 2017, 240, 96–107 CrossRef CAS
.
- A. Ghahri, F. Golbabaei, L. Vafajoo, S. M. Mireskandari, M. Yaseri and S. J. Shahtaheri, Int. J. Environ. Res., 2017, 11, 327–337 CrossRef
.
- J. Li, X. Li, G. Zhou, W. Wang, C. Wang, S. Komarneni and Y. Wang, Appl. Catal., A, 2014, 470, 115–122 CrossRef CAS
.
- T. E. Tshabalala and M. S. Scurrell, Catal. Commun., 2015, 72, 49–52 CrossRef CAS
.
- J. Plana-Pallejà, S. Abelló, C. Berrueco and D. Montané, Appl. Catal., A, 2016, 515, 126–135 CrossRef
.
- A. Feliczak-Guzik, Microporous Mesoporous Mater., 2018, 259, 33–45 CrossRef CAS
.
- R. Asgharzadeh Shishavan, M. Ghashghaee and R. Karimzadeh, Fuel Process. Technol., 2011, 92, 2226–2234 CrossRef CAS
.
- E. E. Kolesnikova, T. K. Obukhova, N. V. Kolesnichenko, G. N. Bondarenko, O. V. Arapova and S. N. Khadzhiev, Pet. Chem., 2018, 58, 863–868 CrossRef CAS
.
- Y. Li, S. Liu, S. Xie and L. Xu, Appl. Catal., A, 2009, 360, 8–16 CrossRef CAS
.
- X. Gao, Z. Tang, G. Lu, G. Cao, D. Li and Z. Tan, Solid State Sci., 2010, 12, 1278–1282 CrossRef CAS
.
- E. Moradiyan, R. Halladj, S. Askari and P. Moghimpour Bijani, J. Phys. Chem. Solids, 2017, 107, 83–92 CrossRef CAS
.
- J. Li, H. Liu, T. An, Y. Yue and X. Bao, RSC Adv., 2017, 7, 33714–33725 RSC
.
- S. Abbasizadeh and R. Karimzadeh, Ind. Eng. Chem. Res., 2018, 57, 7783–7794 CrossRef CAS
.
- H. Zhang, S. Shao, R. Xiao, D. Shen and J. Zeng, Energy Fuels, 2014, 28, 52–57 CrossRef CAS
.
- A. T. Aguayo, P. Castaño, D. Mier, A. G. Gayubo, M. Olazar and J. Bilbao, Ind. Eng. Chem. Res., 2011, 50, 9980–9988 CrossRef CAS
.
| This journal is © The Royal Society of Chemistry 2019 |

