DOI:
10.1039/C9RA02246E
(Paper)
RSC Adv., 2019,
9, 13916-13926
Novel Al2O3/GO/halloysite nanotube composite for sequestration of anionic and cationic dyes
Received
23rd March 2019
, Accepted 30th April 2019
First published on 7th May 2019
Abstract
In this study, an Al2O3/graphene oxide/halloysite nanotube (Al2O3/GO/HNT) nanocomposite has been synthesized and used as an adsorbent for the sequestration of cationic methylene blue (MB) and anionic congo red (CR) dyes from wastewater. The properties of the synthesized Al2O3/GO/HNT were characterized by X-ray diffraction (XRD), X-ray photoelectron spectroscopy (XPS), scanning electron microscopy (SEM) and transmission electron microscopy (TEM). Various factors such as pH, contact time, initial concentration and temperature have been investigated for evaluation of the optimum adsorption in the batch sorption experiment and experimental results showed the highest adsorption capacity was found to be 329.8 mg g−1 for CR and 258.4 mg g−1 for MB at an initial concentration of 500 mg l−1 which was three times higher than the individual Al2O3 GO and HNT concentrations. Freundlich and Langmuir adsorption isotherm models were fitted to the experimental data and the results implied that the adsorption of MB well described with Langmuir and CR is related to the Freundlich isotherm model. The kinetics data of CR and MB adsorption was well fitted to pseudo-first-order. The calculated values for thermodynamic parameters indicated that the MB and CR adsorption process were spontaneous and exothermic in nature. The effectiveness of the Al2O3/GO/HNT composite was also tested for adsorption of Cu(II), oxytetracycline (OTC) antibiotic, and 2-chlorophenol (2CP) and the results revealed that the Al2O3/GO/HNT composite is a promising adsorbent for the dyes as well as heavy metals and other organic pollutants.
1. Introduction
Excessive anthropogenic activities have a remarkable impact on the environment and contamination of natural resources including water.1 The different industries like textiles, food and beverage, printing, cosmetics, etc. are extensively using dyes for coloring applications and releasing a large volume of contaminated wastewater. Congo red (CR) and methylene blue (MB) both are well-known dyes for their applications and toxic properties. These dyes may have an adverse effect on the environment, aquatic life, and humans.2–4
Different chemical, physical and biological processes including chemical flocculation,5 chemical oxidation,6 biological degradation,7 photocatalysis,8 adsorption,9–11 ion exchange,12 and membrane filtration13 have been used to removed contaminants from wastewater. The previous studies revealed that adsorption is more acceptable method due to its high efficiency and cost-minimizing for dyes sequestration from wastewater.1 Different adsorbents including modified clay,14 peanut hulls,15 aloe vera,16 cashew nutshells,17 kaolin18, activated carbon,11 alumina,19 and graphene oxide20 etc. have been investigated for the removal of the pollutants. Gupta et al. reported that the activated carbon is the most effective adsorbent for color removal, but it is expensive as well as time-consuming for regeneration.21 Wasti and Awan have been examined and find out the alumina as one of the efficient and economically reasonable adsorbents.19 Moreover, alumina (Al2O3) possesses excellent physical and textural characteristics, which make it one of the most favorable adsorbent material. It has the ability to alter the mechanical strength, porosity, hydrophilicity and sorption capacity of nanocomposite materials.22 Al2O3 has been doped with other material for improving the efficiency of wastewater treatment such as; CNTs-TiO2/Al2O3,23 Al2O3/MWNTs.24,25 Deng et al., revealed that the graphene oxide (GO) another potential adsorbent having hydrophilic nature, eagerly disperses into a form a stable suspension for removal of dyes.20 It has investigated that, the halloysite nanotube (HNT) is hollow and layered structure ultrafine particles with diameters < 100 nm and having a large surface area ranging from ∼500 nm to >1.2 microns, are ease to chemically modify to increase the adsorption efficiency.25 It was also reported HNT is a promising, inexpensive compared to other nanotubes, nontoxic, safe and environment-friendly adsorbent for dye sequestration in the wastewater treatment process.26,27 Recently, researchers are exploring low-cost composite adsorbents with nanoparticles for effective adsorption.28
This study aimed to evaluate the adsorption capacity of Al2O3/GO/HNT nanocomposite for sequestration of MB and CR dyes from aqueous solution. The effect of pH, temperature, initial concentration, and contact time was evaluated. Freundlich and Langmuir's models have been applied to equilibrium data. Pseudo-first order and pseudo-second-order kinetic models are also fitted to the adsorption data to find the rate of the dyes adsorption process.
2. Materials and methods
2.1. Materials
In this experiment pure grad materials have been used without further purification. CR having a molecular formula of C32H22N6Na2O6S2 (anionic dye), and MB with a molecular formula of C16H18ClN3S·xH2O (cationic dye), were purchased from the Techno Pharm Chem, Haryana, India, and used as model pollutants. Variable concentrations like 100, 250, 500 and 1000 mg l−1 stock solutions of both MB and CR dyes were prepared by dissolving the required amount in de-ionized water. The pH of the solution was adjusted using dilute HCl (0.1 M) and NaOH (0.1 M) in the range of 2–10.
2.2. Synthesis
Al2O3/GO/HNT nanocomposite has been synthesized via a standard procedure. Initially, 25 mg GO was dissolved in 100 ml of distilled water at 25 °C under stirring then 1.5 g HNT were added and constantly stirred for 1 hour. Thereafter, 0.625 g of Al(NO3)2 dissolved in 50 ml H2O was added to the HNT and GO solution under stirring condition. After 30 min, 12 ml NH4OH solution was added dropwise and stirred for 24 hours at 25 °C. The obtained precipitate was filtered and washed several times with distilled water and acetone. Finally, Al2O3/GO/HNT composite was dried in an oven at 105 °C for 12 hours. The same method was used for the synthesis of Al2O3 in the absence of HNT and GO.
2.3. Characterization experiments
The synthesized materials Al2O3 and HNT, Al2O3/GO/HNT composite were characterized by using scanning electron microscopy (SEM), transmission electron microscopy (TEM), X-ray diffraction (XRD) and X-ray photoelectron spectrometer (XPS). The XRD analysis was recorded on a PAN analytical X'Pert PRO 3040/60 X-ray diffractometer (Almelo, The Netherland) consisting X-rays source of Cu Kα at 45 kV and 40 mA. The morphology was studied with a JSM-5910 scanning electron microscope, SEM (JEOL, Tokyo, Japan). The transmission electron microscopy (TEM) images of Al2O3/GO/HNT were recorded by JEOL 200CX electron microscope operated at 200 kV. The XPS analysis was performed using a Thermo VG Scientific X-ray photoelectron spectrometer.
2.4. Adsorption experiments
A series of primary experiments were conducted to optimize the operating conditions for CR and MB adsorption onto Al2O3/GO/HNT. The effects of variable factors like initial concentrations of dyes, solution pH, contact time and temperatures have been investigated in batch experiments. A fixed dose of Al2O3/GO/HNT nanocomposite (0.02 g) was mixed in 20 ml of MB and CR solutions. The effect of initial solution pH was investigated by adjusting the initial solution pH between 2–10 and equilibrium studies were performed in the constant time between 15–420 min. The effect of initial dyes concentrations (50–1000 mg l−1) and temperature (30–50 °C) was also investigated. The batch experiments were replicated three times to keeping the accuracy of the obtained data. Adsorption equilibrium capacity (qe mg g−1) and the amount of dye adsorbed at the time (qt mg g−1) were calculated by the following equations:where Ct is equilibrium concentration at a time; Co and Ce are initial concentration and equilibrium dyes concentrations in the solution (mg l−1) respectively. V is the volume of solution (L), and m is the mass of adsorbent (g).
2.5. Point of zero charge analysis
The point of zero charge (pHzpc) is a vital characteristic of adsorbent material to evaluate the surface charge. In this experiment, 0.1 M KCl has been used and 0.02 g of Al2O3/GO/HNT nanocomposite was added in each flask containing 20 ml prepared solution then adjusted the pH between 2–10 using NaOH and HCl solution. The solutions were agitated for 24 hours at 30 °C temperature. Thereafter, the final pH of the solution was measured and a graph was plotted between initial and final solution pH values to find the pHzpc of the Al2O3/GO/HNT nanocomposite.
3. Results and discussion
3.1. Characterization
The SEM images of Al2O3 and Al2O3/GO/HNT nanocomposite are shown in Fig. 1. Fig. 1a is showing the agglomerated flakey structure of Al2O3. A high-resolution SEM images (Fig. 1b) of Al2O3 is showing the irregular shaped nanoparticle. The SEM and TEM images of the Al2O3/GO/HNT nanocomposite are shown in Fig. 1c–f. Both SEM and TEM images are showing the tubular structures belong to the HNT and dispersed particle for Al2O3 and sheets for GO in Al2O3/GO/HNT nanocomposite. The images are confirming the successful deposition of Al2O3 and GO onto HNT.
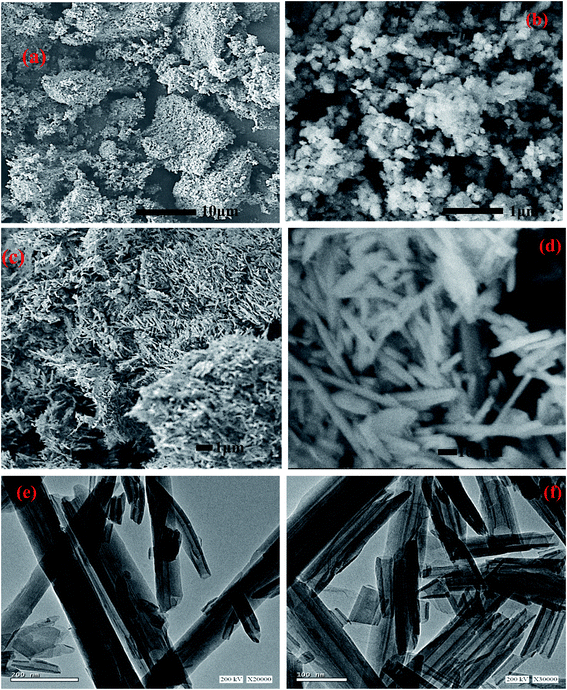 |
| | Fig. 1 SEM images of (a and b) Al2O3 (c and d) Al2O3/GO/HNT (e and f) TEM of Al2O3/GO/HNT nanocomposite. | |
The XRD pattern of Al2O3, HNT and Al2O3/GO/HNT nanocomposite is shown in Fig. 2. The XRD pattern of Al2O3 in Fig. 2 is showing the mixed phase for alumina which is in the form of boehmite (JCPDS – 00-001-1283) and bayerite (JCPDS – 00-020-0011) at 2θ° around 13(020), 18(001), 20(02), 27.90(120), 37(140), 40.7(201), 48(200), 53(024), 55(151), 57(240), 59(211), 63(071), and 64(071). The XRD pattern of HNT showing the major reflections at 2θ° corresponding to the planes at 12(001), 20(100), 25(002), 35(110), 54(210) and 62(300) matching with the JCPD card no. 00-029-1487. The XRD pattern of Al2O3/GO/HNT nanocomposite is closely matching with the pattern of Al2O3 and HNT. Almost the same peaks appeared at a slightly shifted angle which is showing the good interaction between the Al2O3, GO and HNT. However, there is no peak was appeared for the GO due to its lower amount in the composite.
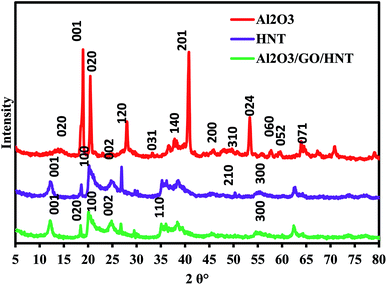 |
| | Fig. 2 XRD pattern of Al2O3, HNT and Al2O3/GO/HNT nanocomposite. | |
X-ray photoelectron spectrometer (XPS) has been used for characterization of Al2O3/GO/HNT nanocomposite and the recorded spectrum are shown in Fig. 3. A complete scan survey of Al2O3/GO/HNT nanocomposite is shown in Fig. 3a, the appeared peaks belong to Al 2p, O 1s, C 1s and Si 2p at the binding energies 75.25 eV, 532.58 eV, 285.47 eV, and 103.44 eV, respectively. The Al 2p peak centered at 75.25 eV belong to HNT and Al2O3. The recorded O 1s peak at 532.47 eV and 531.38 (Fig. 3b) belongs to oxygen at present in hydroxyl and carboxylic group.29,30 The wide scan spectra for C 2p is shown in Fig. 3c which is demonstrating the different type of the carbon functional groups present in the GO at the binding energy between 283 eV to 289 eV. Fig. 3d belongs to the Si 2p at the binding energy 102.92 eV and 105.56 eV as a major constituent (Si–OH) in the HNT.
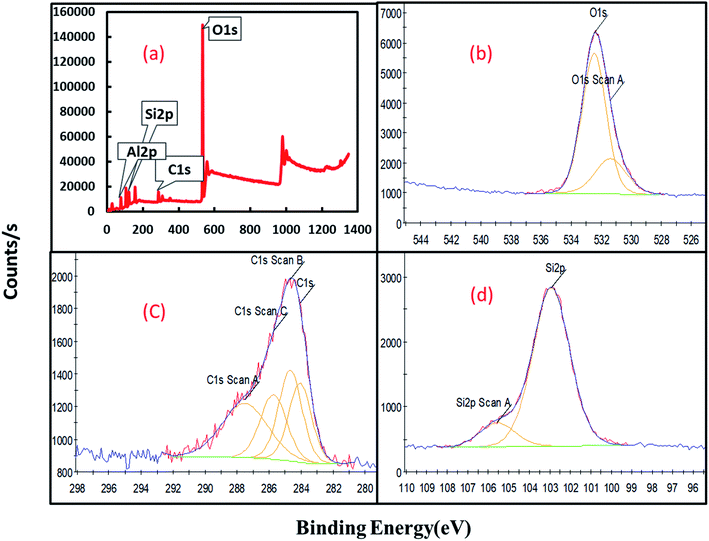 |
| | Fig. 3 XPS spectrum of Al2O3/GO/HNT nanocomposite (a) scan survey (b) O 1s (c) C 1s (d) Si 2p. | |
3.2. Adsorption studies
3.2.1. Effect of solution pH. The effect of solution pH is one of the determining factors of the adsorption process by influencing both adsorbent and adsorbate surface charges.31 The pHzpc of the Al2O3/GO/HNT nanocomposite was found to be around 7 as shown in Fig. 4a. To examine the effect of solution pH on both MB and CR dyes, the adsorption experiments were performed at two different initial concentrations, 50 mg l−1, and 500 mg l−1 and the experimental results are presented in Fig. 4b. It is clear that the uptake capacity of CR dye was decreased with the increase in solution pH and the maximum adsorption capacity of CR at both concentrations was optimum at pH 3 because the surface of the Al2O3/GO/HNT was positively charged at pH < 7 and negatively charged at pH > 7. On the other hand, the adsorption capacity of MB onto Al2O3/GO/HNT nanocomposite increased with the increase in solution pH and the optimum adsorption was recorded at pH 9. Both dyes showed the opposite adsorption behaviors onto Al2O3/GO/HNT nanocomposite due to their charge. MB is a cationic dye and CR is an anionic dye. Below pH 7, CR showed electrostatic attraction with positively charge Al2O3/GO/HNT nanocomposite while above pH 7, MB attached on the Al2O3/GO/HNT surface electrostatically.32,33 Based on these results, pH 3 for CR and pH 9 for MB were selected for further adsorption studies.
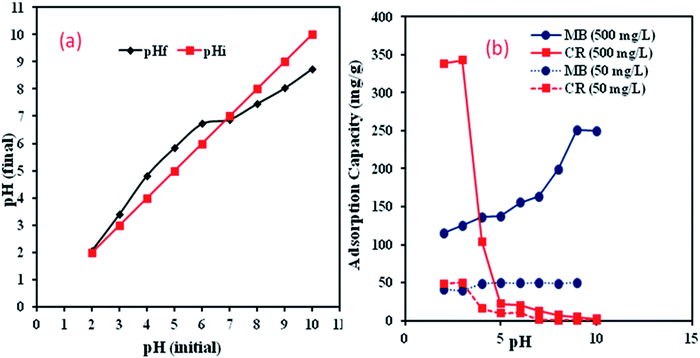 |
| | Fig. 4 (a) pHzpc of Al2O3/GO/HNT nanocomposite (b) effect of pH on MB and CR removal onto Al2O3/GO/HNT nanocomposite (concentration-50 mg l−1 and 500 mg l; temp-30 °C, contact time-6 h; V-20 ml, M-0.02 g). | |
3.2.2. Effect of initial concentration. The effect of initial concentration for sequestration of CR and MB onto Al2O3/GO/HNT nanocomposite proceeded in the range of initial concentrations from 50 mg l−1 to 1000 mg l−1. The results have been illustrated in Fig. 5a and revealed that the uptake capacities of both dyes were increased with the increase in dyes concentrations. However, the % adsorption was decreased from 99.22 to 48.9% for MB and 80 to 40.5% for CR as the dyes initial concentrations were increased from 50 mg l−1 to 1000 mg l−1. At lower dyes concentrations, the uptake capacities were sharply raised due to available vacant sites on the surface of Al2O3/GO/HNT nanocomposite. Further increased of initial concentrations from 200 mg l−1 of both dyes, the adsorption capacities gradually increased with the increase of initial concentrations for both CR and MB removal onto Al2O3/GO/HNT. Further increment of concentration after 900 mg l−1, no significant changes were observed due to the lack of available active sites on the surface.34 Increasing driving force for mass transfer with an increase in dyes concentrations might have an influence on the adsorption process.35
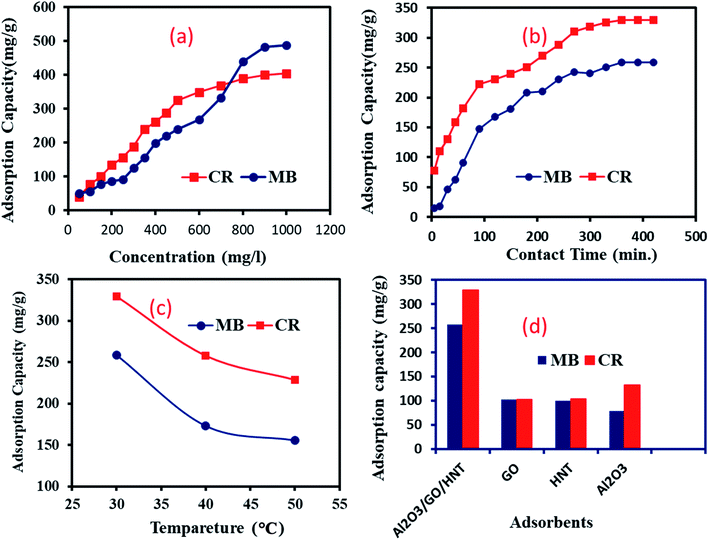 |
| | Fig. 5 (a) Effect of concentration on MB and CR removal onto Al2O3/GO/HNT nanocomposite (pH-3 for CR and pH-9 for MB; temp-30 °C; contact time-6 h; V-20 ml; M-0.02 g); (b) effect of contact time on MB and CR removal onto Al2O3/GO/HNT nanocomposite (concentration-500 mg l; pH-3 for CR and pH-9 for MB; temp-30 °C; V-20 ml; M-0.02 g); (c) effect of temperature on MB and CR removal onto Al2O3/GO/HNT nanocomposite (concentration-500 mg l; pH-3 for CR and pH-9 for MB; contact time-6 h; V-20 ml; M-0.02 g); (d) comparison of adsorption efficiency of Al2O3/GO/HNT nanocomposite with others adsorbents for removal of MB and CR dye (concentration-500 mg l; pH-3 for CR and pH-9 for MB, temp-30 °C, contact time-6 h; V-20 ml, M-0.02 g). | |
3.2.3. Effect of contact time. The contact time is one of the most important factors of the adsorption process, especially for the low-cost adsorbent. To optimize the equilibrium for this study, experiments were conducted at reaction time 15 to 420 min at the 500 mg l−1 concentrations of dyes. The obtained results are presented in Fig. 5b. The adsorption of both dyes onto Al2O3/GO/HNT nanocomposite was fast at the initial time, followed by a gradual increase up to 360 minutes. After that, the adsorption capacities of both dyes have not been significantly changed. This can be due to accessibility for diffused dyes molecules and availability of active sites on the surface of Al2O3/GO/HNT nanocomposite. After 120 minutes of adsorption time, uptake capacities of both dyes gradually increased, probably due to the migration of dyes molecules from the upper surface to inner pores of Al2O3/GO/HNT nanocomposite. After 360 minutes, the adsorption capacities of both dyes have not been changed due to the absence of vacant active sites.
3.2.4. Effect of temperature. The effect of temperature on CR and MB adsorption process onto Al2O3/GO/HNT was carried out at 30 °C, 40 °C, and 50 °C. The experimental data have been illustrated in Fig. 5c and revealed that the adsorption capacities of CR and MB decreased with the increase of temperature. The highest uptake capacities of both dyes were at 30 °C temperature. These results indicated that, as the reaction temperature increase, kinetic energy of CR and MB also increases. Thus, the interaction between adsorbates and surface of Al2O3/GO/HNT also reduces. These results revealed that adsorption of CR and MB onto Al2O3/GO/HNT nanocomposite was exothermic in nature.
3.2.5. Adsorption of dyes onto Al2O3, GO and HNT. The adsorption capacity of Al2O3/GO/HNT nanocomposite for MB and CR dyes has been compared with Al2O3, GO and HNT to find the effectiveness of the prepared nanocomposite adsorbent as shown in Fig. 5d. The experiments were conducted at optimum adsorption conditions at solution pH 3 for CR and pH 9 for MB, 500 mg l−1 of dyes concentration, 0.02 g adsorbents and contact time 6 hours at 30 °C. The results indicated that the adsorption efficiency of Al2O3/GO/HNT nanocomposite is three times higher than that of the individually Al2O3, GO and HNT for removal of CR and MB, respectively. This may be due to the unique characteristics of Al2O3/GO/HNT nanocomposite such as extended surface area large number for functional groups on its surface.
3.2.6. Adsorption of other pollutants. To examine the effectiveness and efficiency of Al2O3/GO/HNT nanocomposite for other pollutants such as hexavalent chromium Cr(VI), copper Cu(II), oxytetracycline (OTC) and 2-chlorophenol (2-CP) were investigated. The adsorption experiments were conducted at initial adsorbates concentrations ranging from 50 mg l−1 to 600 mg l−1 at pH 5 and 30 °C. The experimental data have been plotted and presented in Fig. 6. The revealed that the significant adsorption for 2-CP and OTC and maximum adsorption was found to be 275 mg g−1 and 236.5 mg g−1 for removal of 2-CP and OTC, respectively. While the adsorption of heavy metals was comparatively low and maximum adsorption capacity for Cu(II) was 112 mg g−1. On the other hand, Cr(VI) obtained equilibrium at 50 mg l−1 of initial concentration with capacity at 16 mg g−1. This might be due to the influence of driving force for mass transfer with an increase of adsorbates concentration. These results confirming that the Al2O3/GO/HNT nanocomposite is effective adsorbent and can be used for the removal of organic as well as inorganic pollutants.
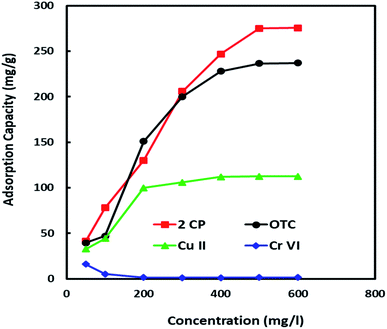 |
| | Fig. 6 Adsorption of other adsorbates onto Al2O3/GO/HNT nanocomposite (pH-5; temp-30 °C; contact time-6 h; V-20 ml; M-0.02 g). | |
3.2.7. Isotherm studies. To examine the best-fitted adsorption isotherm model for CR and MB removal, Langmuir and Freundlich's models are fitted to the equilibrium data. The Langmuir and the Freundlich models can be explained by the following equations;| | |
Ce/qe = Ce/qm + 1/qmb
| (3) |
| |
log![[thin space (1/6-em)]](https://www.rsc.org/images/entities/char_2009.gif) qe = log qe = log![[thin space (1/6-em)]](https://www.rsc.org/images/entities/char_2009.gif) kF + (1/n)log kF + (1/n)log![[thin space (1/6-em)]](https://www.rsc.org/images/entities/char_2009.gif) Ce Ce
| (4) |
where kF is Freundlich equilibrium constant (l g−1), b is Langmuir equilibrium constant (l g−1), n is a strength factor, qm is the maximum adsorption capacity (mg g−1), Ce is equilibrium concentration of MB or CR in solution (mg l−1) and qe is adsorption capacity of MB or CR at equilibrium (mg g−1). The linear plot form of experimental data for the adsorption of MB and CR onto Al2O3/GO/HNT has been illustrated in Fig. 7a and 8a. The calculated isotherm parameters values for adsorption of CR and MB onto Al2O3/GO/HNT are presented in Table 1.
 |
| | Fig. 7 Langmuir isotherm for the adsorption process; (a) CR, MB (b) 2CP, OTC and Cu(II) (c) Cr(VI). | |
 |
| | Fig. 8 Freundlich isotherm plots for the adsorption process; (a) CR, MB (b) 2CP, OTC and Cu(II) (c) Cr(VI). | |
Table 1 Langmuir and Freundlich isotherm parameters values for adsorption of various pollutants onto Al2O3/GO/HNT nanocomposite
| Adsorbate |
Langmuir isotherm model |
Freundlich isotherm model |
| qe mg g−1 (exp) |
qm mg g−1 (Cal) |
KL (mg l−1) |
R2 |
KF (mg l−1) |
n |
R2 |
| MB |
258.4 |
526.3 |
0.00625 |
0.9616 |
0.054 |
1.995 |
0.9485 |
| CR |
329.8 |
2000 |
0.000541 |
0.0416 |
0.0432 |
0.889 |
0.5405 |
| 2-CP |
275 |
384.6 |
0.01092 |
0.9689 |
0.0641 |
1.948 |
0.9659 |
| OTC |
236.5 |
400 |
0.00607 |
0.6553 |
6.081 |
1.778 |
0.7391 |
| Cu(II) |
112 |
144.9 |
0.01298 |
0.9794 |
−0.104 |
1.375 |
0.855 |
| Cr(VI) |
16 |
0.888 |
−0.01626 |
0.9887 |
1.165 |
3.900 |
0.8963 |
The obtained R2 values form both isotherm models revealed that MB adsorption onto Al2O3/GO/HNT nanocomposite follows the Langmuir isotherm model. The best fitting of the Langmuir model indicates that homogeneous, monolayer MB adsorption of onto Al2O3/GO/HNT nanocomposite surface. The results also indicated that the Langmuir model was not followed for CR due to low R2 values (0.0416). The higher R2 value obtained from the Freundlich model for CR removal indicating that the adsorption of CR onto Al2O3/GO/HNT nanocomposite followed the Freundlich isotherm model. The value of R2 is 0.9485 of Freundlich is slightly lower than the value of R2 0.9616 of Langmuir isotherm for MB. This model also describes the adsorption of MB. Although, the R2 is 0.5405 for the Freundlich model is higher than the value of R2 is 0.0416 Langmuir isotherms for CR, still, there is a significant deviation from the fitted equations.
On the other hand, the adsorption equilibrium data for the removal of 2-CP, OCT, Cu(II) and Cr(VI) were also fitted to the Langmuir and Freundlich isotherm models. The linear plots for both models are shown in Fig. 7b, c and 8b, c and the values of their respective parameters are tabulated in Table 1. The adsorption of 2-CP, Cr(VI) and Cu(II) were well described with the Langmuir isotherm model while the and OTC adsorption data followed the Freundlich isotherm model.
3.2.8. Kinetic studies. The sorption kinetics for CR and MB removal onto Al2O3/GO/HNT has been investigated by fitting the kinetic data to the pseudo-first-order and pseudo-second-order kinetic models, expressed by the following equations;| |
pseudo-first-order: log![[thin space (1/6-em)]](https://www.rsc.org/images/entities/char_2009.gif) (qe − qt) = log (qe − qt) = log![[thin space (1/6-em)]](https://www.rsc.org/images/entities/char_2009.gif) qe − (k1t/2.303) qe − (k1t/2.303)
| (5) |
| | |
pseudo-second-order: t/q = (1/k2qe2) + (t/qe)
| (6) |
where qe is adsorption capacity at equilibrium, qt is adsorption capacity at the time, k1 is pseudo-first-order constant (min−1), and k2 is pseudo-second-order constant (g (mg min)−1). The kinetics plots for MB and CR adsorption onto Al2O3/GO/HNT nanocomposite are shown in Fig. 9. The calculated values of k1, k2, qe, and R2 have been tabulated in Table 2. The correlation coefficient (R2) values are 0.9451 and 0.9779 obtained for pseudo-first-order equation while 0.9849, and 0.9134 obtained from pseudo-second-order for CR and MB kinetics adsorption, respectively. Both models are showing the high R2 values, indicating the applicability of both models. However, the calculated adsorption capacity values are closed to experimental qe values for pseudo-first order model which indicated that adsorption of both dyes followed the pseudo-first-order kinetic model.
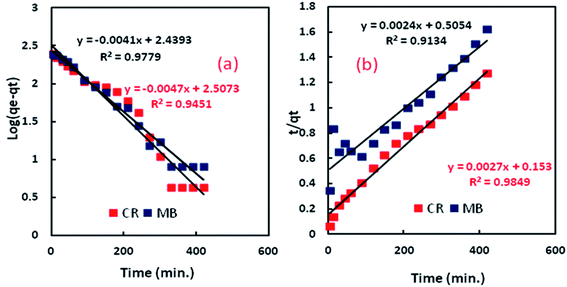 |
| | Fig. 9 (a) Pseudo-first-order kinetic for the adsorption process; (b) pseudo-second-order kinetic for the adsorption process. | |
Table 2 Kinetics parameters for CR and MB adsorption onto Al2O3/GO/HNT nanocomposite
| Adsorbates |
Pseudo-first-order |
Pseudo-second-order |
| qe (mg g−1) |
k1 (min−1) |
R2 |
qe (mg g−1) |
k2 (g mg−1 min−1) |
R2 |
| CR |
321.588 |
0.0108 |
0.9451 |
370.3 |
0.0000476 |
0.9849 |
| MB |
274.789 |
0.0094 |
0.9779 |
416.7 |
0.0000113 |
0.9134 |
3.3. Adsorption mechanism
The adsorption mechanism of MB and CR adsorption onto Al2O3/GO/HNT has been illustrated in Fig. 11. Both dyes, CR and MB have the opposite charge. As the effect of the solution pH studies demonstrated that acidic condition favors the adoption of CR while optimum adsorption of MB occurs in the basic medium due to the electrostatic interaction. Besides the electrostatic interaction, CR and MB dyes molecules can be attached to the Al2O3/GO/HNT nanocomposite surface through the hydrogen bonding, π–π interaction, van der Waals forces, etc.36–38 The surface of Al2O3/GO/HNT nanocomposite consists of hydroxyl, carboxylic, silicate and aluminol groups. The interaction of these groups with the CR and MB dyes molecules are shown in Fig. 11.
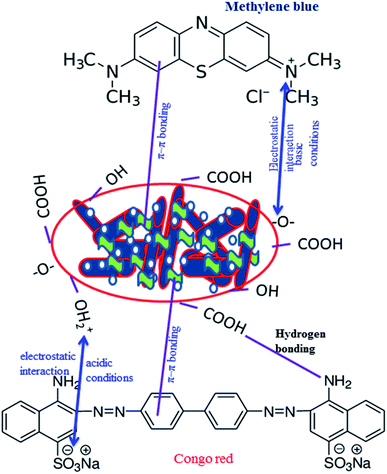 |
| | Fig. 11 Proposed mechanism for MB and CR adsorption onto Al2O3/GO/HNT nanocomposite. | |
3.4. Comparison of adsorption studies
The efficiency of Al2O3/GO/HNT nanocomposite has been compared with other adsorbents used for the MB and CR adsorption. The maximum adsorption capacity of the adsorbents is shown in Table 4. The comparison results show that Al2O3/GO/HNT nanocomposite is an efficient material for the removal of both eyes.
Table 4 Comparison of adsorption capacity of previously used adsorbents with Al2O3/GO/HNT nanocomposite for adsorption of MB and CR
| Adsorbents |
MB |
CR |
References |
| qm (mg g−1) |
qm (mg g−1) |
| Active carbon |
16.43 |
|
39 |
| Cylindrical graphene–carbon nanotube hybrid |
81.97 |
40 |
| Silica nanosheets |
12.66 |
41 |
| Polyaniline nanotubes base/silica composite |
10.31 |
42 |
| Exfoliated graphene oxide |
17.3 |
43 |
| Almond shell activated carbon |
1.33 |
44 |
| Orange peel |
18.6 |
45 |
| Carbonized peanut shell (CPS) |
5.34 |
46 |
| Porous carbon |
5.13 |
47 |
| Sumac leaves (SL) |
5.80 |
48 |
| Polydopamine (PDA) microspheres |
88.89 |
49 |
| Hollow poly (cyclotriphosphazene-co-phloroglucinol) (PCPP) microspheres |
61.24 |
50 |
| Al2O3/GO/HNT |
526.3 |
This study |
| Activated carbon (laboratory grade) |
|
1.88 |
51 |
| AC/DDAC |
769.23 |
52 |
| Chitosan/montmorillonite nanocomposite |
54.52 |
53 |
| Chitosan beads modified with CTAB |
94.39 |
54 |
| Maghemite nanoparticles |
208.33 |
55 |
| CTAB modified chitosan beads |
352.2 |
56 |
| Al2O3/GO/HNT |
2000 |
This study |
4. Conclusion
Herein, a novel Al2O3/GO/HNT nanocomposite has been successfully synthesized for removal of both cationic MB and anionic CR dye. The solution pH, initial concentration, temperature and contact time, etc. parameters were evaluated to identify the most suitable conditions for the highest adsorption of both dyes. The optimum CR uptake capacity onto Al2O3/GO/HNT was achieved 329.8 mg g−1 within 6 hours at pH-3 and 30 °C while MB adsorption capacity was 258.4 mg g−1 at pH −9. The experimental kinetic data of MB and CR adsorption were governed by the pseudo-first-order kinetic. The Freundlich isotherm model describe the adsorption of the CR while MB equilibrium data followed the Langmuir isotherm model. The maximum monolayer adsorption capacities for both CR and MB have been compared with previous studies and results revealed that the adsorption capacities of both MB and CR onto Al2O3/GO/HNT are highest compared to the previously reported adsorbent. Based on this study, it can be concluded that Al2O3/GO/HNT nanocomposite is an efficient adsorbent for the removal of the pollutants from the aqueous solution.
Conflicts of interest
There are no conflicts of interest to declare
Acknowledgements
This work was supported by the Deanship of Scientific Research (DSR), King Abdulaziz University, Jeddah, under the Grant No. (D-020-155-1440). The authors, therefore, gratefully acknowledge the DSR technical and financial support.
References
- A. Ahmad, S. H. M. Setapar, C. S. Chuong, A. Khatoon, W. A. Wani, R. Kumar and M. Rafatullah, RSC Adv., 2015, 5, 30801–30818 RSC.
- T. M. Elmorsi, J. Environ. Prot., 2011, 2, 817–827 CrossRef CAS.
- B. R. Ganapuram, M. Alle, R. Dadigala, A. Dasari, V. Maragoni and V. Gutte, Int. Nano Lett., 2015, 5, 215–222 CrossRef CAS.
- S. Banerjee, M. Chattopadhyaya, V. Srivastava and Y. C. Sharma, Environ. Prog. Sustainable Energy, 2013, 33, 3 Search PubMed.
- A. K. Verma, R. R. Dash and P. Bhunia, J. Environ. Manage., 2012, 93, 154–168 CrossRef CAS PubMed.
- C. Edwards, MSc thesis, Virginia Polytechnic Institute and State University, 2000.
- N. U. Maheswari and S. Sivagami, International Journal of Pure & Applied Bioscience, 2016, 4(4), 123–128 Search PubMed.
- H. B. Manh, D. N. Ngoc and H. N. Quoc, Sci. Technol. Dev., 2016, 19, M1-2016 Search PubMed.
- M. Khodadadi, M. H. Saghi, N. A. Azadi and S. Sadeghi, J. Mazandaran Univ. Med. Sci., 2016, 26(141), 70–82 Search PubMed.
- H. Chen and J. Zhao, Adsorption, 2009, 15(4), 381 CrossRef CAS.
- Z. Cheng, L. Zhang, X. Guo, X. Jiang and T. Li, Spectrochim. Acta, Part A, 2015, 137(11), 26–43 Search PubMed.
- D. Kaušpėdienė, E. Kazlauskienė and S. V. C. Aušra, Ion Exch. Lett., 2010, 3, 19–24 Search PubMed.
- I. Koyuncu, Desalination, 2002, 143, 243–253 CrossRef CAS.
- A. Kausar, M. Iqbal, A. Javed, K. Aftab, Z. H. Nazli, H. N. Bhattiand and S. Nouren, J. Mol. Liq., 2018, 256, 395–407 CrossRef CAS.
- A. M. Etorki and F. M. N. Massoudi, Orient. J. Chem., 2011, 27(3), 875–884 CAS.
- H. Basiri, H. Nourmoradi, F. M. Moghadam, K. F. Moghadam, J. Mohammadian and Y. O. Khaniabadi, Der Pharma Chemica, 2015, 7(11), 149–155 CAS.
- A. A. Spagnoli, D. A. Giannakoudakis and S. Bashkova, J. Mol. Liq., 2017, 229, 465–471 CrossRef CAS.
- B. K. Nandi, A. Goswami and M. K. Purkai, Appl. Clay Sci., 2009, 42, 583–590 CrossRef CAS.
- A. Wasti and M. A. Awan, J. Assoc. Arab Univ. Basic Appl. Sci., 2016, 20, 26–31 Search PubMed.
- J. H. Deng, X. R. Zhang, G. M. Zeng, J. L. Gong, O. Y. Niu and J. J. Liang, Chem. Eng. Sci., 2013, 226, 189–200 CrossRef CAS.
- V. K. Gupta, B. Gupta, A. Rastogi, S. Agarwal and A. Nayak, J. Hazard. Mater., 2011, 186, 891–901 CrossRef CAS PubMed.
- J. Jaafari, G. M. Ghozikali, A. Azari, B. M. Delkhosh, B. A. Javid, A. A. Mohammadi, A. S. Shilpi, K. V. Gupta, M. Sillanpää, G. A. Tkachev and E. A. Burakov, J. Ind. Eng. Chem., 2018, 57, 396–404 CrossRef CAS.
- H. Zhao, H. Li, H. Yu, H. Chang, X. Quan and S. Chen, Sep. Purif. Technol., 2013, 116, 360–365 CrossRef CAS.
- Y. Li, S. Wang, A. Cao, D. Zhao, X. Zhang, C. Xu, Z. Luan, D. Ruan, J. Liang, D. Wu and B. Wei, Chem. Phys. Lett., 2001, 350, 412–416 CrossRef CAS.
- S. Desai, A. Pandey and M. S. Dahiya, Int. J. PharmTech Res., 2017, 10(1), 62–76 Search PubMed.
- I. D. Mall, V. C. Srivastava and N. K. Agarwal, J. Hazard. Mater., 2007, 143, 386–395 CrossRef CAS PubMed.
- D. Rawtani and Y. K. Agrawal, Rev. Adv. Mater. Sci., 2012, 30, 282–295 CAS.
- R. Kumar, M. A. Laskar, I. F. Hewaidy and M. A. Barakat, Earth Systems and Environment, 2019, 3, 83–93 CrossRef.
- B. J. Tan, K. J. Klabunde and P. M. A. Sherwood, J. Am. Chem. Soc., 1991, 113, 855–861 CrossRef CAS.
- E. Paparazzo, Surf. Interface Anal., 1988, 12, 115–118 CrossRef.
- S. Banerjee, G. C. Sharma, M. C. Chattopadhyaya and Y. C. Sharma, J. Environ. Chem. Eng., 2014, 2, 1870 CrossRef CAS.
- E. L. Abd, M. M. Latif and A. M. Ibrahim, Desalin. Water Treat., 2009, 6, 252–268 CrossRef.
- P. K. Malik, Dyes Pigm., 2003, 56, 239–249 CrossRef CAS.
- N. Barka, S. Qouzal, A. Assabbane, A. Nounhan and Y. A. Ichou, J. Saudi Chem. Soc., 2011, 15, 263–267 CrossRef CAS.
- J. Iqbal, F. H. Watto, M. H. S. Watto, R. Malik, S. A. Tirmizi, M. Imran and A. B. Ghangro, Arabian J. Chem., 2011, 4, 389–395 CrossRef CAS.
- D. Shen, J. Fan, W. Zhou, B. Gao, Q. Yue and Q. Kang, J. Hazard. Mater., 2009, 172, 99–107 CrossRef CAS PubMed.
- K. V. Kumar, J. Hazard. Mater., 2006, B137, 638–639 CrossRef PubMed.
- F. Wu, R. Tseng and R. Juang, Water Res., 2001, 35, 613–618 CrossRef CAS PubMed.
- S. Karagoz, T. Tay, S. Ucar and M. Erdem, Bioresour. Technol., 2008, 99, 6214–6222 CrossRef PubMed.
- L. Ai and J. Jiang, Chem. Eng. J., 2012, 192, 156–163 CrossRef CAS.
- M. F. Zhao, Z. B. Tang and P. Liu, J. Hazard. Mater., 2008, 158, 43–51 CrossRef CAS PubMed.
- M. M. Ayad, A. A. El-Nasr and J. Stejskal, J. Ind. Eng. Chem., 2012, 18, 1964–1969 CrossRef CAS.
- G. K. Ramesha, A. V. Kumara, H. B. Muralidhara and S. Sampath, J. Colloid Interface Sci., 2011, 361, 270–277 CrossRef CAS PubMed.
- A. Aygun, S. Yenisoy-Karakas and I. Duman, Microporous Mesoporous Mater., 2003, 66, 189–195 CrossRef CAS.
- G. Annadurai, R. Juang and D. Lee, J. Hazard. Mater., 2002, 92, 263–274 CrossRef CAS PubMed.
- J. Gulen and F. Zorbay, Water Environ. Res., 2017, 89(9), 805–816 CrossRef CAS PubMed.
- J. Gulen and M. Iskeceli, Mater. Test., 2017, 59(2), 188–194 CrossRef CAS.
- J. Gulen, B. Akin and M. Ozgur, Desalin. Water Treat., 2016, 57(20), 9286–9295 CrossRef CAS.
- J. Fu, Z. Chen, M. Wang, S. Liu, J. Zhang, J. Zhang, R. Han and Q. Xu, Chem. Eng. J., 2015, 259, 53–61 CrossRef CAS.
- J. Fu, Z. Chen, X. Wu, M. Wang, X. Wang, J. Zhang, J. Zhang and Q. Xu, Chem. Eng. J., 2015, 281, 42–53 CrossRef CAS.
- I. D. Mall, V. C. Srivastava, N. K. Agarwal and I. M. Mishra, Chemosphere, 2005, 61(4), 492–501 CrossRef CAS PubMed.
- Z. Cheng, L. Zhang, X. Guo, X. Jiang and T. Li, Spectrochim. Acta, Part A, 2015, 137, 1126–1143 CrossRef CAS PubMed.
- L. Wang and A. Wang, J. Hazard. Mater., 200, 147(3), 979–985 CrossRef PubMed.
- S. Rouf, M. Nagapadma and R. R. Rao, Int. J. Eng. Res. Ind. Appl., 2015, 5(3), 75–82 Search PubMed.
- A. Afkhami and R. Moosavi, J. Hazard. Mater., 2010, 174(1–3), 398–403 CrossRef CAS PubMed.
- R. Jain and S. Sikarwar, Int. J. Environ. Pollut., 2006, 27(1–3), 158–178 CrossRef CAS.
|
| This journal is © The Royal Society of Chemistry 2019 |
Click here to see how this site uses Cookies. View our privacy policy here.  Open Access Article
 *ab,
Rajeev Kumar
 a,
M. Balkhyoura and
Md. Abu Taleba

![[thin space (1/6-em)]](https://www.rsc.org/images/entities/char_2009.gif) qe = log
qe = log![[thin space (1/6-em)]](https://www.rsc.org/images/entities/char_2009.gif) kF + (1/n)log
kF + (1/n)log![[thin space (1/6-em)]](https://www.rsc.org/images/entities/char_2009.gif) Ce
Ce

![[thin space (1/6-em)]](https://www.rsc.org/images/entities/char_2009.gif) (qe − qt) = log
(qe − qt) = log![[thin space (1/6-em)]](https://www.rsc.org/images/entities/char_2009.gif) qe − (k1t/2.303)
qe − (k1t/2.303)

![[thin space (1/6-em)]](https://www.rsc.org/images/entities/char_2009.gif) ln
ln![[thin space (1/6-em)]](https://www.rsc.org/images/entities/char_2009.gif) Kc
Kc
![[thin space (1/6-em)]](https://www.rsc.org/images/entities/char_2009.gif) Kc = ΔS°/R − ΔH°/RT
Kc = ΔS°/R − ΔH°/RT
![[thin space (1/6-em)]](https://www.rsc.org/images/entities/char_2009.gif) Kc = (ΔS°/2.303R) − (ΔH°/2.303RT)
Kc = (ΔS°/2.303R) − (ΔH°/2.303RT)
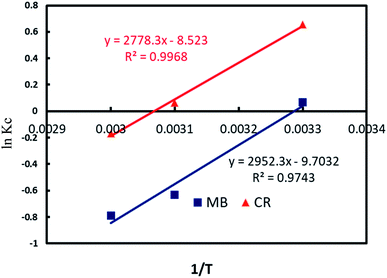
![[thin space (1/6-em)]](https://www.rsc.org/images/entities/char_2009.gif) Kc versus 1/T from experimental data is illustrated in Fig. 10 and the calculated values are reported in Table 3. The results indicated that the adsorption CR and MB molecules onto Al2O3/GO/HNT nanocomposite was not favored at high temperature and negative values of ΔG° indicating the spontaneous adsorption process. The negative ΔH° values for both CR and MB indicating that the adsorption process was exothermic in nature. On the other hand, the calculated negative values ΔS° for both CR and MB adsorption indicate the increase in randomness at the solid solution interface.
Kc versus 1/T from experimental data is illustrated in Fig. 10 and the calculated values are reported in Table 3. The results indicated that the adsorption CR and MB molecules onto Al2O3/GO/HNT nanocomposite was not favored at high temperature and negative values of ΔG° indicating the spontaneous adsorption process. The negative ΔH° values for both CR and MB indicating that the adsorption process was exothermic in nature. On the other hand, the calculated negative values ΔS° for both CR and MB adsorption indicate the increase in randomness at the solid solution interface.


