 Open Access Article
A wearable fiber-shaped supercapacitor based on a poly(lactic acid) filament and high loading polypyrrole†
Wenqi Nie a,
Lianmei Liu
 *b,
Qiao Lia,
Suyi Zhanga,
Jiyong Huac,
Xudong Yanga and
Xin Ding
 *a
*a
aKey Laboratory of Textile Science and Technology, Ministry of Education of China, Donghua University, Shanghai 201620, China. E-mail: xding@dhu.edu.cn
bCollege of Materials and Textile Engineering, Jiaxing University, Jiaxing, Zhejiang 314001, China. E-mail: 1122038@mail.dhu.edu.cn
cKey Laboratory of High Performance Fibers and Products, Ministry of Education, Donghua University, Shanghai, 201620, China
First published on 18th June 2019
Abstract
There is a growing interest in fiber-shaped supercapacitors, which are likely to meet the demands of wearable electronics. However, the loading of active material is so small that the energy density of fiber supercapacitors is low. In this research, a graphene oxide/poly(pyrrole) (GO/PPy) hybrid was applied as the active material and a novel method to accomplish a high loading of the active material on poly(lactic acid) (PLA) filaments is proposed. Iron ions, as positive ions, are intercalated into GO sheets to form complexes which can be absorbed on the surface of the PLA. Furthermore, iron ions can be used as initiators to initiate pyrrole polymerization. Using complexes in which iron ions are intercalated into GO, instead of pure GO, then coated onto PLA and then polymerized using pyrrole, this method could effectively increase the loading of PPy. As a result, the active material loading is 0.121 mg cm−1, and the weight gain rate even reached 72.4%. A high areal specific capacitance of 158.8 mF cm−2 and energy density of 3.5 μW h cm−2 are achieved using the proposed fiber-shaped supercapacitor. Meanwhile, it shows great potential for textile shaped electronics because of its fiber format.
1. Introduction
Wearable energy storage devices have recently become of great interest because of their portability, flexibility and wearability.1–5 Compared with lithium ion batteries, supercapacitors are considered as the most promising type of energy source because of their advantages of high power density, fast charge–discharge capability, long cycle life and safety.1,6 Traditional planar supercapacitors are bulky, rigid, and difficult to be integrated into systems of various configurations. In contrast, fiber-shaped supercapacitors are lightweight, flexible and easy to shape into textiles.7–10 Therefore, much effort has been devoted to developing fiber-shaped supercapacitors.11 However, one of the major problems with fiber-shaped supercapacitors is that the active materials cannot be coated on to fiber substrates in great amounts, and the low mass loading of active materials limits the improvement of the device performance.12–15Usually, there are two methods to prepare fiber-shaped supercapacitors. One is a spinning method, which can achieve a high performance for energy-storage fibers.16,17 But the tensile strength of these fibers is much lower than the requirements for the subsequent textile processing. The other is coating the active materials onto the traditional textile fiber, (e.g., cotton or chemical filaments), which have been proved to be an effective method to obtain fiber-shaped supercapacitors by many researchers.18,19 Using this method enables the original tensile strength of the textile fibers to be kept, whereas the energy storage is relatively low. To improve capacitance, combining two active materials (e.g., carbonaceous materials and conducting polymer materials13,18) as a composite is an effective method. As is known, the molecular structure of graphene oxide (GO) has a lot of functional groups, including carbon sp2 (C![[double bond, length as m-dash]](https://www.rsc.org/images/entities/char_e001.gif) C), carbonyl (C
C), carbonyl (C![[double bond, length as m-dash]](https://www.rsc.org/images/entities/char_e001.gif) O), and carboxylates (O–C
O), and carboxylates (O–C![[double bond, length as m-dash]](https://www.rsc.org/images/entities/char_e001.gif) O). Therefore, it is easily coated on fiber [such as cotton, poly(lactic acid) (PLA), poly(imide), and so on] using chemical or hydrogen bonding. Meanwhile, poly(pyrrole) (PPy), is composed of aromatic rings with carbon (C), nitrogen (N) elements and also has carbon sp2 (C
O). Therefore, it is easily coated on fiber [such as cotton, poly(lactic acid) (PLA), poly(imide), and so on] using chemical or hydrogen bonding. Meanwhile, poly(pyrrole) (PPy), is composed of aromatic rings with carbon (C), nitrogen (N) elements and also has carbon sp2 (C![[double bond, length as m-dash]](https://www.rsc.org/images/entities/char_e001.gif) C). So, the π–π interactions and hydrogen bonding between the GO sheets and PPy can play a significantly role in the formation of GO/PPy nanocomposites. Therefore, they are usually applied to fiber-shaped supercapacitors.20,21
C). So, the π–π interactions and hydrogen bonding between the GO sheets and PPy can play a significantly role in the formation of GO/PPy nanocomposites. Therefore, they are usually applied to fiber-shaped supercapacitors.20,21
Using GO/PPy as the active material for the preparation of fiber supercapacitors, some researchers have proved its feasibility. Xu et al.20 coated GO on cotton and then compositing it with PPy on the substance to prepare a reduced graphene oxide (RGO)/PPy/cotton supercapacitor. The capacitance of the complex electrode is superior to that of an RGO/cotton electrode. Lyu et al.22 also reported an RGO/PPy/cellulose paper supercapacitor, whose energy density could reach 0.28 mW h cm−3. Although a lot of work has been done on GO/PPy coated on fibers, the fiber energy density is still low. As far as is known, it has been reported that the capacitance depends on the PPy mass loading, and a high mass loading can provide high performance.23 So, the main reason for the low energy density of a fiber supercapacitor is the energy of the substance coated on the fiber is less. Generally, PPy can be obtained using chemical polymerization.24 In the process of chemical polymerization, ferric chloride (FeCl3) is often used as the initiator. The polymerization process agrees with the kinetics given by Bjorklund.25 The pyrrole gets positive charges when oxidized by FeCl3. The charged pyrrole has a preference for adhering onto the surface of the object in solution, and then the PPy long chain macromolecules are formed when more positively charged pyrrole molecules contact. So, the PPy can be randomly grown in the fiber surface when the fiber is put into the pyrrole solution. However, it is difficult for PPy to grow evenly onto the fiber, because PPy is not uniform and the mass is low. In some cases, a GO adsorption layer on the fiber substrates prior to the PPy coating is beneficial to the electrochemical performance.17 However, the mass loading of PPy is still less. Therefore, it is necessary to find a way to increase the mass loading of PPy on the GO-coated fiber substrates.
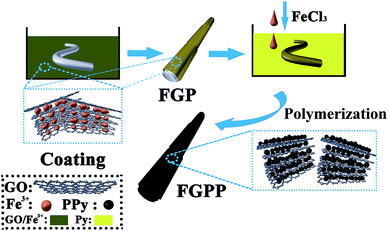
In this research, GO was modified by introducing iron ions. The GO is an electronegative material, so using iron ions (positive charge) can be used to achieve modified GO to form a stable mixture. The mixture was first coated onto a PLA filament, as the substrate material, which can keep its tensile strength after coating with active materials. This step makes the mixed active material (FeCl3 and GO) coated on the surface of PLA. After that, the modified PLA was put into pyrrole solution. The iron ions are intercalated into the interlayers of the GO sheets and also act as an effective initiator for pyrrole polymerization.15,26 As a result of this, the pyrrole is first oxidized to form a charged intermediate attached to the PLA filament. When additional FeCl3 solution is added dropwise, the charged pyrrole is more easily bound to the charged pyrrole which is already attached to the PLA. Thus, a high loading of PPy can be achieved. As a result, iron ions intercalated with GO composited with PPy as an active material grown onto the PLA filament (FGPP). The mass percentage of PPy is improved from 53% to 72.4% after introducing the iron ions, and the active material loading is 0.121 mg cm−1. Furthermore, the resultant FGPP yarns are assembled into a flexible fiber-shaped supercapacitor with a high specific capacitance of 158.8 mF cm−2 and an energy density of 3.5 μW h cm−2. In addition, the resulting fiber-shaped supercapacitor retains the strength of the original yarn and its high flexibility, which shows a great potential for wearable electronics.
2. Experimental section
2.1. Materials
A commercial PLA filament with a density of 0.83 g cm−3, a cross-sectional area of 2.00 × 10⁻⁴ cm2 and a fineness of 150 D/75f was purchased from Zhejiang Xuri Fiber Co. Ltd. The PLA fiber was selected as the substrate because it is non-toxic, biodegradable and possesses good mechanical properties. The pyrrole monomer, anthraquinone-2-sulfonic acid (AQSA) and FeCl3·6H2O were purchased from Sinopharm Chemical Reagent Co., Ltd. The GO was prepared using the chemical oxidation of natural graphite powder using the modified Hummer's method.272.2. Intercalation of FeCl3 into GO
The GO was mixed ultrasonically for 1 h at room temperature to form a stable suspension with a concentration of 2 mg mL−1. Then the FeCl3 was added to the GO solution. The mass ratios of GO to FeCl3 were: 6![[thin space (1/6-em)]](https://www.rsc.org/images/entities/char_2009.gif) :
:![[thin space (1/6-em)]](https://www.rsc.org/images/entities/char_2009.gif) 0, 6
0, 6![[thin space (1/6-em)]](https://www.rsc.org/images/entities/char_2009.gif) :
:![[thin space (1/6-em)]](https://www.rsc.org/images/entities/char_2009.gif) 1, 6
1, 6![[thin space (1/6-em)]](https://www.rsc.org/images/entities/char_2009.gif) :
:![[thin space (1/6-em)]](https://www.rsc.org/images/entities/char_2009.gif) 2, 6
2, 6![[thin space (1/6-em)]](https://www.rsc.org/images/entities/char_2009.gif) :
:![[thin space (1/6-em)]](https://www.rsc.org/images/entities/char_2009.gif) 6 (GO, FG-1, FG-2, FG-3), respectively. Afterwards, the mixtures were stirred for 30 min and then mixed ultrasonically for another 30 min at room temperature.
6 (GO, FG-1, FG-2, FG-3), respectively. Afterwards, the mixtures were stirred for 30 min and then mixed ultrasonically for another 30 min at room temperature.
2.3. Preparation of GOFeCl3/PPy@PLA composite fibers
The preparation of the GOFeCl3/PPy@PLA (FGPP) composite fibers is shown schematically in Fig. 1. Firstly, the PLA filaments were rinsed sequentially with acetone and de-ionized water to remove any impurities. Then the filaments were dipped into solutions of mixtures of GO with FeCl3 (FG) for 5 min, and this dipping operation was repeated to design various FG loads. Next, the filaments were dried at 80 °C, resulting in GOFeCl3@PLA (FGP) filaments. As a control sample, GO@PLA (GP) filaments were obtained without using FeCl3. Secondly, PPy was deposited onto the FGP or GP filaments using in situ chemical polymerization. The filaments were immersed in an aqueous solution with AQSA (0.01 M) and pyrrole (0.12 M) at 0 °C for 2 h. This causes the pyrrole to first be oxidized to form a charged intermediate attached to the PLA filament. When additional FeCl3 solution is added dropwise, the charged pyrrole is more easily bound to the charged pyrrole which is attached to the PLA. The AQSA dopant is able to strongly interact with the PPy main chain.28 Then an FeCl3 aqueous solution (0.18 M) was added dropwise to initiate polymerization. The polymerization reaction lasted for 2 h at 0 °C. Finally, the PPy-coated filaments were obtained after washing with water to remove impurities and then dried in an oven at 100 °C. The FGPP composite fibers with different mass ratios of GO and FeCl3 were labeled as GPP, FGPP-1, FGPP-2, FGPP-3.2.4. Characterization
The X-ray diffraction (XRD) pattern was obtained using a diffractometer (D/Max-2250 PC, Rigaku, Japan) with Cu Kα radiation, operated at 200 mA and 40 kV. The Fourier-transform infrared spectra (FTIR) was recorded using a spectrometer (Nicolet 6700, Thermo Electron Scientific Instruments Co. Ltd., USA) and X-ray photoelectron spectroscopy (XPS, Escalab 250, ThermoScientific, USA). The surface morphologies of the filaments were characterized using scanning electron microscopy (SEM, TM3000, Hitachi, Japan). The tensile properties of the FGPP and PLA were tested in a yarn tester (YG061FQ, Laizhou Electron Instrument Co., Ltd). The electrochemical measurements were carried out using a three-electrode and a two-electrode test cell on a CHI 660D electrochemical workstation (CH Instruments) at room temperature. For the three-electrode test, the counter electrode was platinum and the reference electrode was silver/silver chloride (Ag/AgCl).29 The electrolyte was an aqueous solution of 1 mol L−1 sodium chloride (NaCl). The voltage window ranged was 0 to 0.8 V, and the current densities varied from 125 mA cm−3 to 1250 mA cm−3. For the two-electrode test system, a gel electrolyte was used. To prepare the gel electrolyte, water (10 mL) and phosphoric acid (10 mL) were mixed and stirred for 30 min. The poly(vinyl alcohol) (PVA) powder (10 g) was dissolved in 90 mL of water at 90 °C and then added to the above solution with stirring for 1 h, followed by cooling down to room temperature.30 According to a previous report on a fiber supercapacitor, the areal specific capacitance (Cs), areal energy density (Es) and areal power density (Ps) of supercapacitor were calculated using the following equations:20| Cs = (I × Δt)/(S × ΔU) |
| Es = (Cs × ΔU2)/7200 |
| Ps = (Es × 3600)/Δt |
3. Results and discussion
3.1. Structure of the intercalation of GO with FeCl3
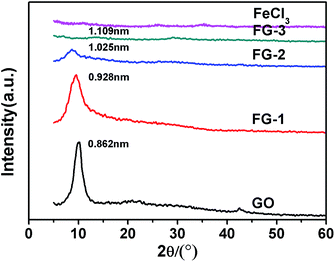
The XRD patterns of the FeCl3-modified GO sheets are shown in Fig. 2. Because of the oxygenated functional groups, the interlayer spacing of the GO sheets obtained from the (001) peak was approximately 0.826 nm (2θ = 10.3°), which was larger than that of graphite (0.34 nm).31 By increasing the mass ratio of the FeCl3, the intensity of the peak at 10.3° was significantly reduced and the interlayer spacing of the intercalated complex was gradually increased (Fig. S1, ESI†). This phenomenon indicated that FeCl3 enlarged the sheet distance of the GO layer and destroyed the orderly arrangement of the GO sheets. For the mass ratio of FeCl3 to GO of 6![[thin space (1/6-em)]](https://www.rsc.org/images/entities/char_2009.gif) :
:![[thin space (1/6-em)]](https://www.rsc.org/images/entities/char_2009.gif) 6, the peak at 10.3° disappeared completely. So, according to the results of previous work, FeCl3 can achieve intercalation of the GO sheets to form a stable mixture.32
6, the peak at 10.3° disappeared completely. So, according to the results of previous work, FeCl3 can achieve intercalation of the GO sheets to form a stable mixture.32
The effective intercalation of FeCl3 into the GO layers was further verified from the FTIR results (Fig. S2, ESI†). The peak at 3433 cm−1 assigned to the O–H groups33 between the GO sheets was downshifted after FeCl3 was added to GO. For the plain GO solution, the peaks at 1630, 1400 and 1061 cm−1 were attributed to the C![[double bond, length as m-dash]](https://www.rsc.org/images/entities/char_e001.gif) C groups,34 the C–OH groups35 and the C–O groups,36 respectively. After the intercalation of FeCl3, the intensities of the characteristic peaks were reduced, which was thought to be because of the positive charges of the Fe3+ ions which could bind the negative charges in GO. It was confirmed that the FeCl3 had been successfully intercalated within the GO layers. The Raman spectra of the PLA filaments, GO, FGP and FGPP are shown in Fig. S3 (ESI).† The typical D (1350 cm−1) and G (1580 cm−1) bands for the crystalline graphitic carbon were observed for GO. After the intercalation of FeCl3 into GO, the D peak was broadened, indicating that the GO structure layer was disturbed, which agreed with the XRD results.37 The FGPP, peaks around 1065 cm−1 and 968 cm−1 were related to the in-plane and out-of-plane vibrations of the N–H, and C–H modes, respectively, which implied that the PPy had grown on the surface of the FGP.38 Furthermore, the XPS spectrum of FGPP is shown in Fig. S4 (ESI),† from which only oxygen (O), C and N elements were detected.22 However, the PLA fiber did not contain elemental N, which was partly because of the PPy deposition.
C groups,34 the C–OH groups35 and the C–O groups,36 respectively. After the intercalation of FeCl3, the intensities of the characteristic peaks were reduced, which was thought to be because of the positive charges of the Fe3+ ions which could bind the negative charges in GO. It was confirmed that the FeCl3 had been successfully intercalated within the GO layers. The Raman spectra of the PLA filaments, GO, FGP and FGPP are shown in Fig. S3 (ESI).† The typical D (1350 cm−1) and G (1580 cm−1) bands for the crystalline graphitic carbon were observed for GO. After the intercalation of FeCl3 into GO, the D peak was broadened, indicating that the GO structure layer was disturbed, which agreed with the XRD results.37 The FGPP, peaks around 1065 cm−1 and 968 cm−1 were related to the in-plane and out-of-plane vibrations of the N–H, and C–H modes, respectively, which implied that the PPy had grown on the surface of the FGP.38 Furthermore, the XPS spectrum of FGPP is shown in Fig. S4 (ESI),† from which only oxygen (O), C and N elements were detected.22 However, the PLA fiber did not contain elemental N, which was partly because of the PPy deposition.
3.2. The morphology of the FGPP fibers
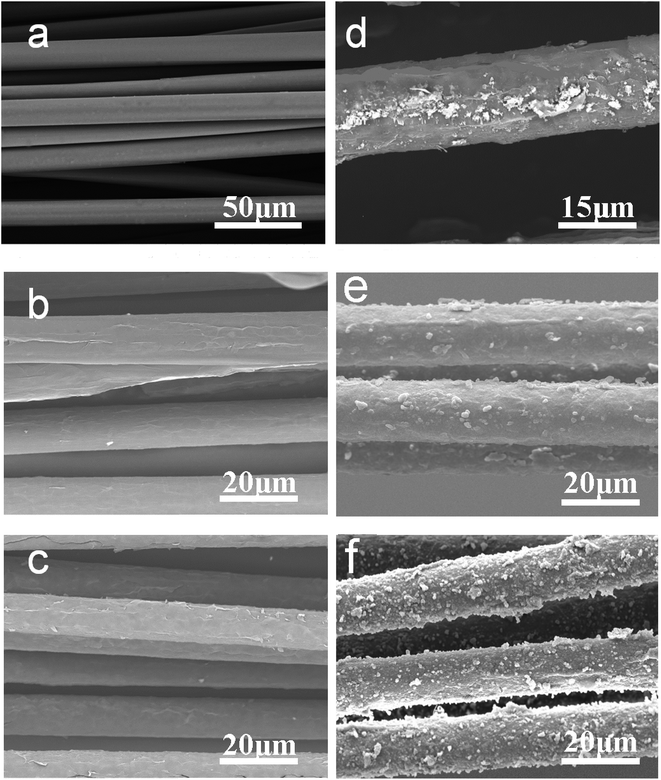
In situ chemical polymerization of pyrrole (Py) was conducted to prepare an FGPP fiber. The bare PLA filaments were clean and smooth (Fig. 3a). After dipping in the GO and FG solutions, the PLA filaments were fully covered with a layer of GO (Fig. 3b) and FG (Fig. 3c) film, respectively. The FG was coated uniformly on the surface of the PLA fibers (Fig. S5a, ESI†). It can be seen that some PPy particles were attached to the surface of the FGP (Fig. 3d) after just throwing the FGP filaments into the Py monomer solution without initiators, which confirmed the presence of Fe3+ ions on the surface of filaments. However, the PPy particles were unevenly distributed and there were very few on the filaments because the amount of Fe3+ ions was not enough to generate further polymerization. As a result, the initiation of the polymerization could not entirely rely on the adsorbed Fe3+ ions. Only some small PPy particles were formed, but these particles can provide a place for subsequent pyrrole polymerization. When additional Fe3+ ions were added to the Py solution, Py was oxidized to form a charged free radical. These PPy particles were more likely to trap charged Py molecules. Therefore, more PPy can be formed on the fibers. A comparison was made of the morphology of the GPP and FGPP filaments (Fig. 3e and f). It was observed that the mass loading of PPy attached to the filament's surface was markedly increased after the intercalation of FeCl3. Furthermore, the PPy coating was uniform and well-bonded (Fig. S5b, ESI†). This phenomenon was attributed to the π–π conjugation and hydrogen bonding between PPy and GO, but also the FeCl3 absorbed inside the filaments. Therefore, the presence of FeCl3 was vital for the PPy polymerization. The mass ratios of FeCl3 to GO also play a critical role in the subsequent polymerization. The PPy mass loading was increased with the increasing mass ratio up to 6![[thin space (1/6-em)]](https://www.rsc.org/images/entities/char_2009.gif) :
:![[thin space (1/6-em)]](https://www.rsc.org/images/entities/char_2009.gif) 6. The weight percentage of PPy was improved from 53% to 72.4% (Fig. S6, ESI†). As was demonstrated, the best performance of the conductive polymers was reached the when the loadings reached 70%.39 Therefore, increasing the mass loading of PPy could effectively improve the performance of the fiber-shaped supercapacitors.
6. The weight percentage of PPy was improved from 53% to 72.4% (Fig. S6, ESI†). As was demonstrated, the best performance of the conductive polymers was reached the when the loadings reached 70%.39 Therefore, increasing the mass loading of PPy could effectively improve the performance of the fiber-shaped supercapacitors.
3.3. The mechanism of the intercalation of FeCl3 into GO sheets
From the XRD results, it could be seen that the interlayer spacing of the GO sheets was 0.826 nm. When FeCl3 was mixed with GO, the interlayer spacing of the GO sheets was enlarged to 1.109 nm. It is known that the intercalation can be achieved by the reaction between the positive charges of FeCl3 and the negative charges of GO. The ionic radius of Fe3+ is 0.4 nm. The XRD results show that the interlayer spacing of GO was increased by nearly 0.3 nm, which indicated the successful insertion of FeCl3 into the GO layer. When the FeCl3-modified GO was coated onto the PLA surface, it was expected that the structure of the FeCl3-modified GO was maintained. For the polymerization of Py with FeCl3, its process agrees with the kinetics given by Bjorklund.25 The process of pyrrole (P) polymerization is described in the following equations:| P + Fe3+ → P+ + Fe2+ | (1) |
| 2P+ → P–P + 2H+ | (2) |
| P–P + Fe3+ → P–P+ + Fe2+ | (3) |
| P–P+ + P+ → P–P–P + 2H+ | (4) |
Thus, by just throwing the FGP filaments into the Py monomer solution without initiators for 2 h, Py was first oxidized to form a charged intermediate attached onto a PLA filament. When additional FeCl3 solution was added dropwise, the charged Py was more easily bound to the charged pyrrole which was attached to the PLA. Therefore, it was better to form a homogeneous hybrid active material in the presence of FeCl3 and the mass loading was also increased. The interaction between Py and FGP involved both physical and chemical processes. The PPy was grown on fibers using chemical polymerization of Py monomers using Fe3+ as oxidants, and this was a chemical process. Meanwhile, the Py monomers and GO were intercalated through the π–π interaction and the electropositive and negative physical adsorption, which was a physical process.40
3.4. Electrical performance of FGPP fibers
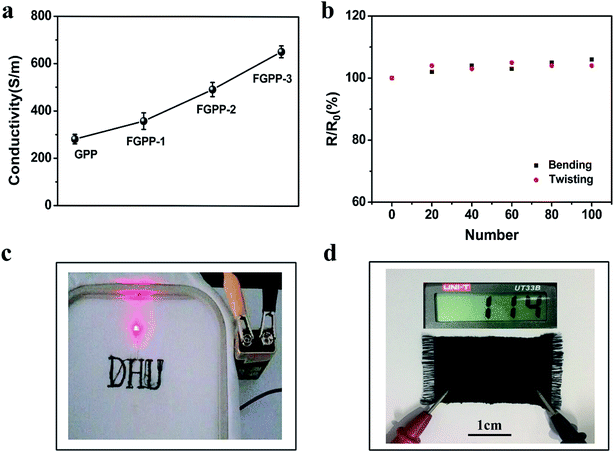
Before the characterization of the electrical properties, the tensile properties of the PLA and FGPP were tested in a yarn tester. Fig. S7 (ESI)† shows the results of the testing which showed that the modified PLA had a high tensile strength and the coating process did not damage the strength of the fibers.The conductivity of the FGPP fibers was determined and the results are shown in Fig. 4. The addition of FeCl3 has an important influence on the conductivity. An increase in the conductivity was witnessed when the mass of the FeCl3 increased (Fig. 4a). In particular, the conductivity of the FGPP-3 fiber was 652 S m−1. The conductive stability of the FGPP-3 fiber is shown in Fig. 4b. The conductivity was almost stable when the composite fiber underwent bending (180°) and twisting (90°) deformations. More interestingly, using a simple sewing machine, the fiber could be woven into a pattern of “DHU” and a twill sample (Fig. 4c). In all cases, the fibers could effectively act as flexible conductor wires and have a high and stable conductivity (Fig. 4d). At the same time, the conductive fabric, which was obtained by weaving the FGPP fibers, had a low resistance value.
3.5. Electrochemical performance of FGPP fibers
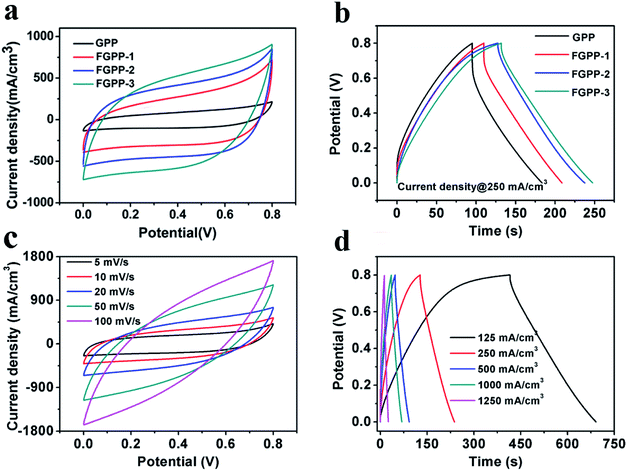
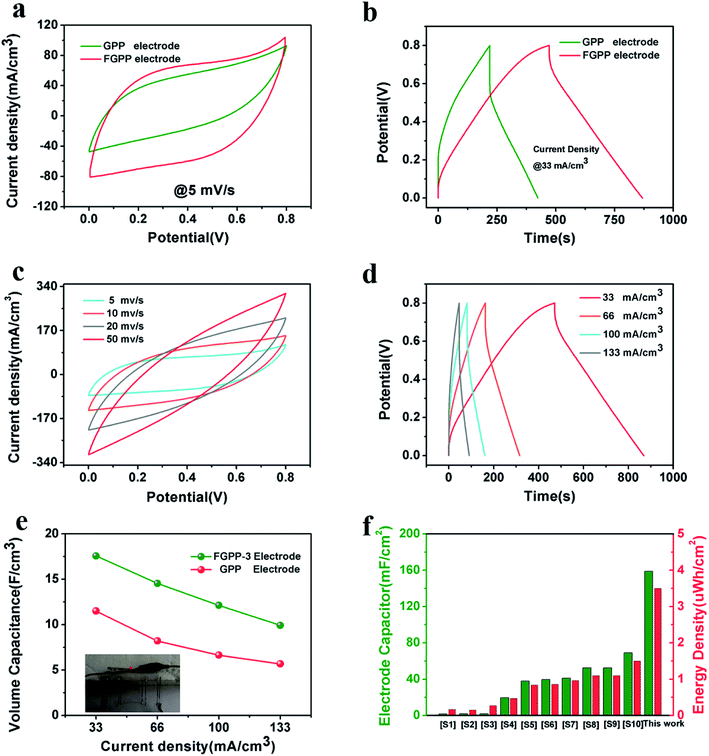
To evaluate the electrochemical properties of the FGPP composite fibers, the electrochemical performance was measured using three-electrode and two-electrode measuring systems. Fig. 5a and b compares cyclic voltammograms (CV) and galvanostatic charge–discharge profiles (GCD) of the electrodes based on four different mass ratios of FeCl3 to GO in a three-electrode test system. From the CV curves (Fig. 5a), it can be seen that they share the same shape but with different areas, which indicated that there were similar redox reactions but different specific capacitances. Furthermore, all the composite electrodes exhibited a symmetrical and closely linear slope during charging and discharging processes (Fig. 5b), suggesting that there was a good supercapacitor electrode behavior. There was a potential difference (IR drop) in voltage during discharge which mainly originated from the electrolyte resistance, electrode resistance and charge transfer resistance (Rct) of the entire devices. The IR drop was decreased with the increasing proportions of FeCl3 corresponding to the decreasing Rct. That is to say, the intercalated structure effectively improved the conductivity and reduced the overall resistance. The FGPP-3 displayed the highest electrochemical performance and was carefully investigated further. Fig. 5c shows the CV curves of the FGPP-3 composite electrode at various scan rates. It can be seen that the FGPP-3 electrode displayed relatively rectangular CV curves at a low scan rate (5 mV s−1). When the scanning rate was increased to 100 mV s−1, the curve still showed a slightly sloped rectangular-like shape within a potential window from 0–0.8 V, which showed there was a high rate performance with efficient ionic and electronic transports. Fig. 5d shows the GCD of the FGPP-3 electrode at different current densities and all of the curves exhibit triangular shapes. At a low current density (125 mA cm−3), some side reactions will occur in the electrochemical redox reaction, resulting in slow charging at a high potential. As the current density increased, the charge and discharge time decreased, and the electrochemical process was mainly affected by the double-layer structure, and the coulomb efficiency increases. In particular, the coulombic efficiency can be kept at 95% even if the current density was as high as 250 mA cm−3, which verified the excellent reversibility of the electrode.The FGPP-3 filaments were further assembled into a flexible fiber shaped supercapacitor. Two FGPP-3 filaments with a length of 3 cm were coated with a gel electrolyte and then arranged in parallel to form a supercapacitor. The GPP electrodes were also fabricated into fiber shaped supercapacitors. Fig. 6a shows the CV curves of two of the supercapacitors at a scan rate 5 mV s−1. It was obvious that the CV area of the FGPP-3-based device was much larger than that of the GPP-based device. The GCD curves, at a current density of 33 mA cm−3, of the solid-state supercapacitors are shown in Fig. 6b. The IR drop of the FGPP-3-based device was small and the GCD curve demonstrated a nearly symmetrical triangular shape, which implied excellent electrochemical capacitive behavior. All of these results proved that the absorbed FeCl3 was beneficial for the improvement of the electrochemical properties. Fig. 6c and d show the CV curves and the GCD curves of a FGPP-3 fiber shaped supercapacitor at different scan rates and current densities, respectively. The CV curves displayed relatively rectangular CV curves at a relatively low scan rate (5 mV s−1), which indicated a nearly ideal supercapacitor behavior (Fig. 6c). The GCD at different current densities exhibited triangular shapes with a coulombic efficiency of ∼95% (Fig. 6d), and the areal specific capacitances (Cs) of FGPP-3 were 39.7 (17.58 F cm−3), 32.61, 27.38 and 22.4 mF cm−2 at 0.075, 0.15, 0.225 and 0.3 mA cm−2, respectively, which were higher than those of the GPP, which were 26, 18.51, 14.98, 12.79 mF cm−2 at the same current density (Fig. 6e). It is well known that the specific capacitance of each electrode (single electrode) was four times the total cell specific capacitance. According to the formula, the areal specific capacitance for each electrode of the cell used in this work was 158.8 mF cm−2. A common pseudocapacitance material is PPy, and with an increase of current density, the electrode surface reactants will rapidly decrease, the concentration polarization of the system will increase, and the incomplete chemical redox reaction will occur, which was reflected in the decrease of capacitance value with the increase of current density.40 The energy density of the supercapacitor assembled in this work was then calculated to be 3.5 μW h cm−2 (1.56 mW h cm−3) and the power density was 0.032 mW cm−2, which was a higher value than those reported in some previous research [Fig. 6f, Table S1 (ESI)†].
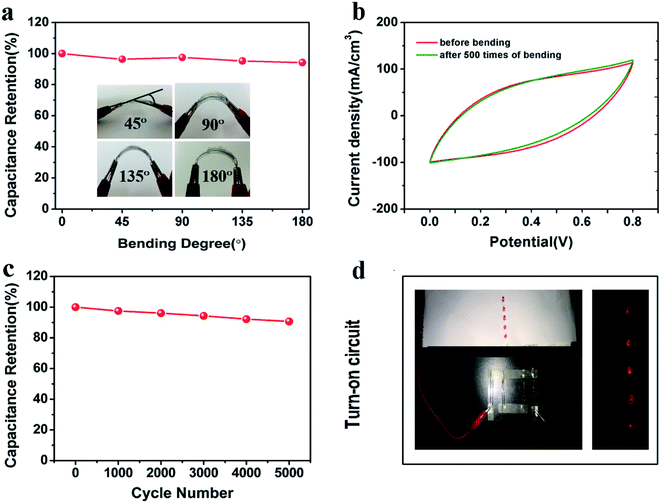
The flexibility and stability of the resulting supercapacitor based on two FGPP-3 fibers was also explored. Significantly, the specific capacitances were almost unchanged under bending with a bending angle of 180° (Fig. 7a), and the CV curves were almost overlapped before and after bending for 500 cycles (Fig. 7b). This means that this fiber supercapacitor has a superb stable capacitance with bending. Furthermore, the device showed an excellent long-life performance up to 5000 cycles with a retention of ∼90.7% (Fig. 7c). For the XRD spectrum (Fig. S8, ESI†), the diffraction peaks around 16° and 21° were attributed to PPy41 and the PVA electrolyte.42 There was little change before and after the cycle as shown in the XRD patterns of FGPP with electrolyte, which implied that the PPy did not collapse after the cycle. As a demonstration of energy storage, the fiber-shaped supercapacitors can be readily connected in series to provide a high power output, e.g., four FGPP-based supercapacitors were connected to power five light-emitting diodes (LEDs) (Fig. 7d).
4. Conclusions
In summary, in order to improve the capacitance and energy density of fiber-shaped electrodes, GO sheets were modified by intercalation with FeCl3. The mass ratio of FeCl3 to GO had a great effect on the loading capability of the active material (PPy) and the subsequent electrochemical properties. The optimal fiber-shaped supercapacitor with a mass ratio of 6![[thin space (1/6-em)]](https://www.rsc.org/images/entities/char_2009.gif) :
:![[thin space (1/6-em)]](https://www.rsc.org/images/entities/char_2009.gif) 6 produced a high mass loading of PPy and a high areal specific capacitance of 158.8 mF cm−2. The energy density of the assembled supercapacitor was 3.5 μW h cm−2 at a power density of 0.032 mW cm−2, which was much higher than those results found in other reports. This fiber-shaped supercapacitor was flexible and performed stably under bending deformation, which rendered it promising for use in many emerging fields such as portable and wearable electronics.
6 produced a high mass loading of PPy and a high areal specific capacitance of 158.8 mF cm−2. The energy density of the assembled supercapacitor was 3.5 μW h cm−2 at a power density of 0.032 mW cm−2, which was much higher than those results found in other reports. This fiber-shaped supercapacitor was flexible and performed stably under bending deformation, which rendered it promising for use in many emerging fields such as portable and wearable electronics.
Conflicts of interest
The authors declare that they have no conflicts of interest.Acknowledgements
This work is supported by the Fundamental Research Funds for the Central Universities (2232018G-02).References
- W. Liu, M. S. Song, B. Kong and Y. Cui, Adv. Mater., 2017, 29, 1603436 CrossRef PubMed.
- R. Raccichini, A. Varzi, S. Passerini and B. Scrosati, Nat. Mater., 2015, 14, 271–279 CrossRef CAS PubMed.
- X. Chen, H. Lin, J. Deng, Y. Zhang and X. Sun, et al., Adv. Mater., 2014, 26, 8126–8132 CrossRef CAS PubMed.
- Y. Wang, Z. Shi, Y. Huang, Y. Ma and C. Wang, et al., J. Phys. Chem. C, 2009, 113, 13103–13107 CrossRef CAS.
- Z. Y. Zhou, Q. C. Zhang, J. Sun, B. He, J. B. Guo, Q. L. Li, C. W. Li, L. Y. Xie and Y. G. Yao, ACS Nano, 2018, 12, 9333–9341 CrossRef CAS PubMed.
- S. Wang, N. Liu, J. Su, L. Li and F. Long, et al., ACS Nano, 2017, 5, 2066–2074 CrossRef PubMed.
- M. Li, M. Zu, J. Yu, H. Cheng and Q. Li, Small, 2017, 13, 1602994 CrossRef PubMed.
- X. Jiang, D. Jianning, Z. Xiaoshuang, Z. Yang and Z. Wenjun, J. Power Sources, 2017, 340, 302–308 CrossRef.
- Q. C. Zhang, W. W. Xu, J. Sun, Z. H. Pan, J. X. Zhao, X. N. Wang, J. Zhang, P. Man, J. B. Guo, Z. Y. Zhou, B. He, Z. X. Zhang, Q. W. Li, Y. G. Zhang, L. Xu and Y. G. Yao, Nano Lett., 2017, 17, 7552–7560 CrossRef CAS PubMed.
- J. X. Zhao, Y. Zhang, Y. N. Huang, J. X. Xie, X. X. Zhao, C. W. Li, J. Y. Qu, Q. C. Zhang, J. Sun, B. He, Q. L. Li, C. H. Lu, X. H. Xu, W. B. Lu, L. Q. Li and Y. G. Yao, Adv. Sci., 2018, 5, 1801114 CrossRef PubMed.
- Z. Y. Li, M. S. Akhtar and O. B. Yang, J. Alloys Compd., 2015, 653, 212–218 CrossRef CAS.
- Q. Li, N. Mahmood, J. Zhu, Y. Hou and S. Sun, Nano Today, 2014, 9, 668–683 CrossRef CAS.
- T. G. Yun, B. Hwang, D. Kim, S. Hyun and S. M. Han, ACS Appl. Mater. Interfaces, 2015, 7, 9228–9234 CrossRef CAS PubMed.
- X. B. Zang, X. Li, M. Zhu, X. M. Li and Z. Zhen, et al., Nanoscale, 2015, 7, 7318–7322 RSC.
- Y. Zhu, K. Shi and I. Zhitomirsky, J. Power Sources, 2014, 268, 233–239 CrossRef CAS.
- Q. H. Meng, K. Wang, W. Guo and J. Fang, et al., Small, 2014, 10, 3187–3193 CrossRef CAS PubMed.
- G. X. Qu, J. L. Cheng, X. D. Li and D. M. Yuan, et al., Adv. Mater., 2016, 28, 3646–3652 CrossRef CAS PubMed.
- L. M. Liu, W. Weng, X. Y. Dai and N. Liu, et al., RSC Adv., 2016, 6, 108362–108368 RSC.
- L. B. Liu, Y. Yu, C. Yan and K. Li, et al., Nat. Commun., 2015, 6, 9 Search PubMed.
- J. Xu, D. X. Wang, Y. Yuan, W. Wei and L. L. Duan, et al., Org. Electron., 2015, 24, 153–159 CrossRef CAS.
- E. Mitchell, J. Candler, F. De Souza, R. K. Gupta, B. K. Gupta and L. F. Dong, Synth. Met., 2015, 199, 214–218 CrossRef CAS.
- S. Y. Lyu, H. J. Chang, F. Fu, L. Hu, J. D. Huang and S. Q. Wang, J. Power Sources, 2016, 327, 438–446 CrossRef CAS.
- Z. Zhang, J. Deng, X. Li, Z. Yang and S. He, et al., Adv. Mater., 2015, 27, 356–362 CrossRef CAS PubMed.
- X. F. Gong, S. H. Li and P. S. Lee, Nanoscale, 2017, 9, 10794–10801 RSC.
- R. B. Bjorklund, J. Chem. Soc., Faraday Trans., 1987, 83, 1507–1514 RSC.
- Y. Huang, H. F. Li, Z. F. Wang, M. S. Zhu and Z. X. Pei, et al., Nano Energy, 2016, 22, 422–438 CrossRef CAS.
- D. C. Marcano, D. V. Kosynkin, J. M. Berlin, A. Sinitskii and Z. Sun, et al., ACS Nano, 2010, 4, 4806 CrossRef CAS PubMed.
- S. H. Kim, S. H. Jang, S. H. Yun and J. Y. Lee, et al., J. Appl. Polym. Sci., 2013, 12, 1969–1974 Search PubMed.
- L. B. Liu, Y. Yu, C. Yan, K. Li and Z. J. Zheng, Nat. Commun., 2015, 6, 9 Search PubMed.
- S. Jiang, T. Shi, X. Zhan, H. Long and S. Xi, et al., J. Power Sources, 2014, 272, 16–23 CrossRef CAS.
- Z. J. Fan, W. Kai, J. Yan, T. Wei and L. J. Zhi, et al., ACS Nano, 2011, 5, 191–198 CrossRef CAS PubMed.
- D. Zhan, L. Sun, Z. H. Ni, L. Liu and X. F. Fan, et al., Adv. Funct. Mater., 2010, 20, 3504–3509 CrossRef CAS.
- P. Y. Tang, L. J. Han and L. Zhang, ACS Appl. Mater. Interfaces, 2014, 6, 10506–10515 CrossRef CAS PubMed.
- K. B. Yin, H. T. Li, Y. D. Xia, H. C. Bi and J. Sun, et al., Nano-Micro Lett., 2011, 3, 51–55 CrossRef CAS.
- C. Bao, L. Song, W. Xing, B. Yuan and C. A. Wilkie, et al., J. Mater. Chem., 2012, 22, 6088–6096 RSC.
- T. A. Pham, B. C. Choi and Y. T. Jeong, Nanotechnology, 2010, 21, 10 CrossRef PubMed.
- Z. M. Gu, C. Z. Li, G. C. Wang, L. Zhang and X. H. Li, J. Polym. Sci., Part B: Polym. Phys., 2010, 48, 1329–1335 CrossRef CAS.
- S. Y. Lyu, H. J. Chang, F. Fu, L. Hu, J. D. Huang and S. Q. Wang, J. Power Sources, 2016, 327, 438–446 CrossRef CAS.
- H. Sun, X. Fu, S. Xie, Y. Jiang and H. Peng, Adv. Mater., 2016, 28, 2070–2076 CrossRef CAS PubMed.
- C. Q. Lin, B. N. Popov and H. J. Ploehn, J. Electrochem. Soc., 2002, 149, 167–175 CrossRef.
- J. Hu, M. Li, F. Lv, M. Yang, P. Tao, Y. Tang, H. Liu and Z. Lu, J. Power Sources, 2015, 294, 120–127 CrossRef CAS.
- G. K. Prajapati, R. Roshan and P. N. Gupta, J. Phys. Chem. Solids, 2010, 71, 1717–1723 CrossRef CAS.
Footnote |
| † Electronic supplementary information (ESI) available. See DOI: 10.1039/c9ra02171j |
| This journal is © The Royal Society of Chemistry 2019 |

