DOI:
10.1039/C9RA02166C
(Paper)
RSC Adv., 2019,
9, 17490-17500
Using high-throughput metabolomics to discover perturbed metabolic pathways and biomarkers of allergic rhinitis as potential targets to reveal the effects and mechanism of geniposide†
Received
20th March 2019
, Accepted 18th May 2019
First published on 4th June 2019
Abstract
In this study, we probed the molecular mechanisms of metabolic biomarkers and pathways affected by the bioactive ingredient geniposide (GP), which was shown to protect against experimental allergic rhinitis in mice. The methods used here involved a metabolomics strategy based on ultra-performance liquid chromatography coupled with quadrupole time-of-flight mass spectrometry (UPLC-TOF/MS). Using the metabolomics strategy, serum samples of mice in control, model and GP groups were used to explore the differential production of metabolites and pathways related to defense activity of GP towards allergic rhinitis. Allergic symptom, inflammatory factors, and cell populations in the mice spleens were reversed by GP treatment. Seventeen potential biomarkers were discovered in experimental allergic rhinitis mice. GP was shown to have a regulatory effect on 12 of them, which were associated with 8 key metabolic pathways. The ingenuity pathway analysis platform was used to further understand the relationship between metabolic changes and pharmacological activity of GP. The pathways which affected by GP involved cellular growth and proliferation, organismal development, and free radical scavenging. This metabolomics study produced valuable information about potential biomarkers and pathways affected by GP during its effective prevention and therapeutic targeting of allergic rhinitis.
1. Introduction
Allergic rhinitis (AR) is a chronic inflammatory illness of the upper respiratory system occurring throughout the world with a morbidity of about 10% to 40%,1,2 and is characterized by allergic symptoms such as sneezing, nasal itching, and rhinorrhea as well as elevated immunoglobulin E content in the serum.3,4 Recently, epidemiological research has shown that the increasing incidence of AR can be attributed to polluted living environments, dietary changes, abuse of antibiotics and other factors.5 AR significantly affects the quality of life of the afflicted individual, in that the more severe the disease, the greater the risk of developing paranasal sinuses, otitis media and asthma in various age groups.6,7 Early diagnosis and treatment offer a chance to increase the success of therapies and enhance the quality of life of those afflicted with AR. Moreover, it is essential to explore an increasingly greater number of specific markers in the early diagnosis stage, perform proper screening protocols, and find novel biological targets for treatment of AR at healthcare facilities.8 The cornerstones of AR treatment consist of education of the patient, allergen avoidance, proper symptomatic pharmacotherapy and specific allergen immunotherapy.9 Although many patients have had specific allergen immunotherapy recommended as an effective therapeutic practice in an allergy management strategy, persistence or only partial remission of symptoms is still observed. Traditional medicines have emerged on the worldwide stage in medicine and pharmaceutical studies, and natural products have grown in popularity and have been extensively recognized as an orthodox clinical therapy on par with modern rational therapies.10 Geniposide (GP), a bioactive iridoid glucoside derived from Gardenia jasminoides, has been reported to display strong anti-inflammatory effects and has been used to treat osteoarthritis, colitis and adjuvant arthritis.11 It inhibits the hypertonicity of fibroblast-like synoviocytes via the RhoA/p38MAPK/NF-κB/F-actin signal pathway.12 However, no clear research has yet been performed on the effect of geniposide on allergic rhinitis nor on any possible mechanism involved.
Modern methodology based on ‘omics’ platforms such as genomics, proteomics, and transcriptomics have been widely applied to comprehend disease pathogenesis, specifically by using disease-specific molecular markers. Recently, metabolomics, an emerging ‘omics’ area, has been applied to explaining the mechanism of action of drugs.13,14 Metabolomics aims to identify and quantify small molecules with molecular weights of less than 1500 Daltons in milieu ranging from cells to human biological fluids such as urine, saliva, and blood. The results from such study provide a useful bridge between genotype and phenotype since small effects caused by external fluctuations and internal metabolic responses in the body can give rise to large changes in metabolite levels.15 The metabolome, due to it being the eventual product of biological actions, involves the total set of metabolites in a living system, in contrast to say the genome, which involves the many genes or mRNA molecules. Study of the metabolome should greatly help in the finding of biomarkers and in identifying pathways perturbed by geniposide during its protection against experimental allergic rhinitis by identifying metabolomic disturbances.16 Two major analytical techniques, namely nuclear magnetic resonance (NMR) and mass spectrometry (MS), have become used at a rapidly increasing rate in this field.17 In the current research, a serum metabolomics strategy based on UPLC-MS combined with multivariate data analysis and pathway analysis was applied to investigate the beneficial activity of GP on experimental AR mice, and has offered a novel way to probe the potential mechanisms in this activity, ways to control the disease, and the development of new relevant drugs.
2. Materials and methods
2.1 Reagents
Ovalbumin (OVA) (grade V) was purchased from Miltenyi Biotech (Bergisch Gladbach, Germany). A CD4 cell isolation kit was purchased from Sigma-Aldrich (St. Louis, MO). Fluorescein isothiocyanate (FITC)-anti-CD4 (GK1.5) and phycoerythrin (PE)-anti-Foxp3 (FJK-16s) monoclonal antibodies (mAbs) were obtained from eBioscience (San Diego, CA). IL-2, IL-4, and IL-5 kits were obtained from Miltenyi Biotech (Bergisch Gladbach, Germany). IL-17, IFN-γ, and sIgE kits were obtained from R&D Systems (Minneapolis, MN). Methanol and formic acid (HPLC grade) were purchased from Fisher Scientific Corporation (Loughborough, UK). Acetonitrile (HPLC grade) was obtained from Miltenyi Biotech (Bergisch Gladbach, Germany). Ultra-high-purity water was obtained from Watson's Food and Beverage Co., Ltd., (Guangzhou, China). Leucine enkephalin of more than 99% purity and geniposide were purchased from Shanghai Chemical Agent Company of China Medicine Clique (Shanghai, China). Pentobarbital sodium and physiologic saline solution were purchased from Beijing Reagent Company (Beijing, China).
2.2 Animals
Adult 8 week-old female BALB/c mice weighing about 20 ± 2 g were obtained from Tianjin SLAC Laboratory Animals (Tianjin, China), and then bred for one week in a pathogen-free environment maintained at a relative humidity of 50–65% and room temperature of 24 ± 2 °C and with cycles of alternating 12 h of light and 12 h of dark. They were fed a standard diet and water. All animal procedures were performed in accordance with the Guidelines for Care and Use of Laboratory Animals of Heilongjiang University of Chinese Medicine and approved by the Animal Ethics Committee of Heilongjiang University of Chinese Medicine.
2.3 Experimental AR establishment and model evaluation
After one week of acclimatization, 24 mice were randomly divided into 3 groups, namely control, model, and GP groups. The AR model was established as follows: on days 0, 2, 4, 6, 8, 10, and 12, mice were sensitized by being subjected to an intraperitoneal injection of 20 μg OVA along with 2 mg aluminum hydroxide, dissolved in 500 μL of phosphate buffered saline (PBS). From day 14 to day 21, these mice were intranasally challenged with 10 μL 10% OVA once a day. Mice in the control group were sensitized with alum and challenged with PBS. OVA-sensitized mice in the GP group were intraperitoneally injected with GP (7 mg per kg per day) 1 hour before the OVA stimulation for 21 days. The control and model groups were administrated distilled water in the same dosage and same way. After these 21 days, AR severity was evaluated by calculating the frequencies of sneezing and nose scratching in the 10 minutes after the last time the nasal cavity was subjected to OVA stimulation.
2.4 Sample collection
In the 21st day of the model establishment, the mice in the three groups were anesthetized using 3% pentobarbital sodium (0.3 mL/100 g body weight) to collect blood from the ophthalmic vein. Then, spleens were separated right away. Serum samples were separated using centrifugation at 4000 rpm for 10 min at 4 °C, and the supernatant of each centrifuged sample was collected and stored immediately at −80 °C for biochemical kit detection and metabolomics analysis.
2.5 Serum cytokine and sIgE analysis
By following the instructions of the manufacturers of the kits and using a Luminex100 instrument, interleukin (IL)-2, IL-4, IL-5, IL-17 and interferon (IFN) contents in the serum samples were measured. Samples were diluted 1![[thin space (1/6-em)]](https://www.rsc.org/images/entities/char_2009.gif) :2 in deionized water.
:2 in deionized water.
The sIgE levels in the serum samples were measured using enzyme-linked immunosorbent assay (ELISA) according to the instructions of R&D Systems (Minneapolis, MN). For the measurement of sIgE, serum samples were diluted 1:1–1:7 in deionized water. Absorbance values were determined at a wavelength of 450 nm on a Bio-Rad 680 microplate reader.
2.6 Cell isolation and measurement
To obtain single cell suspensions, the spleens were removed in an aseptic way and gently disrupted by using a cell strainer (pore size 110 μm). After eliminating erythrocytes by using a red blood cell lysing buffer, CD4+ T cells were enriched from the murine splenocytes using the CD4 cell isolation kit. CD4 expression on Treg cells was measured by using an FITC-anti-CD4 mAb. The permeabilization of intracellular Foxp3 was performed in accordance with the manufacturer's instructions and stained with a PE-anti-Foxp3 mAb. Data were detected using FlowJo software (version 7.5.1; FlowJo, LLC, Ashland, OR).
2.7 Untargeted UPLC-MS metabolomic profiling
For ultra-performance liquid chromatography – mass spectrometry (UPLC-MS) analysis, deproteinized serum samples were centrifuged at 13000 rpm, 4 °C for 20 min. The supernatants of the serum samples were evaporated to dryness under a nitrogen gas stream at 40 °C, and then reconstituted in a mixed solution of acetonitrile, methanol, and water at a ratio of 5:8:7. A volume of 4 μL of supernatant was transferred to a glass vial and injected into a Waters ACQUITY TM Ultra Performance LC system (Waters, Milford, USA). A 0.17 μm ACQUITY BEH C 18 chromatography column was applied for chromatographic separation of metabolites. The mobile phase was acetonitrile with 0.1% formic acid (phase A) and water with 0.1% formic acid (phase B), and the optimized elution gradient program performed for the chromatography was as follows: 0–1 min, isocratic 3% A; 1–5 min, linear gradient from 3% to 55% A; 5–7 min, 55% to 85% A; 7–9 min, 85% to 90% A; 9–10 min, 90% to 100% A; and isocratic 100% A for 2 min. The column effluent was introduced before being split into a Q-TOF-MS system (Waters Corporation, UK) equipped with an electrospray ionization source operating in both positive ionization mode (ESI+) and negative ionization mode (ESI−). A concentration of 0.1 ng mL−1 of leucine enkephalin, infused at a flow rate of 130 μL min−1, was used as an external reference for the positive ion mode ([M + H]+ = 556.2771) and negative ion mode ([M − H]− = 554.2615) to ensure the efficiency of metabolite extraction.
2.8 Multivariate statistical analysis
UPLC-MS metabolomics data were processed using Metaboanalyst 4.0. The peak area data matrix was pre-processed using sample median normalization, cube root transformation, and range scaling methods. When the data matrix was sum normalized, the cube root was transformed and auto-scaled. EZinfo 2.0 software (Waters Corporation, Manchester, UK) was applied to multivariate analysis such as unsupervised principal component analysis (PCA), partial least squares-discriminant analysis (PLS-DA) and orthogonal projection to latent structure-discriminant analysis (OPLS-DA) to better understand the subtle common points of and discrepancies between these pre-processed data files. R2 and Q2 values were used to evaluate the goodness of fit and predictive ability of the OLPS-DA models. Significant variables for group separation in the OPLS-DA model were identified using the variable importance in the projection (VIP) score. The ions with a VIP score value above 1 and p value less than 0.05 were considered important for discrimination. Structural information of significant metabolites were characterized and explored using the Mass Fragment software with MS/MS data and exact molecular mass. The selected potential metabolites were identified by referencing databases such as MetaboAnalyst (http://www.metaboanalyst.ca/), LIPID MAPS (http://www.Lipidmaps.org/tools/index.html), HMDB (http://www.hmdb.ca/), MassBank (http://www.massbank.jp), the ChemSpider database (http://www.chemspider.com) and METLIN (http://www.metlin.scripps.edu). The different metabolites from the comparative analysis of GP against AR were applied to a pathway analysis using the pathway analysis tool (MetPA) in Metaboanalyst 4.0. Furthermore, the ingenuity pathway analysis (IPA) platform was used to carry out a multiple-pathways analysis in order to predict the therapeutic effects of and metabolic changes resulting from GP.
2.9 Statistical analysis
All data were expressed as the mean ± standard error of the mean (SEM). Statistical analysis was performed by using SPSS version 19.0 software for Windows (IBM, Armonk, NY). One-way analysis of variance (ANOVA) was utilized to determine the statistical significance of the values obtained. A p value less than 0.05 was regarded as statistically significant and a p value less than 0.01 was seen as extremely statistically significant.
3. Results
3.1 Effect of GP on nasal allergic symptoms
Fig. 1a summarizes the nasal allergic symptoms such as scratching and sneezing that appeared in the three groups shortly after the last OVA challenge. It was shown that allergic symptoms were significantly elevated in the model group. In 10 minutes, the frequencies of scratching and sneezing in the control group were 9.80 ± 0.42 and 17.20 ± 3.09. In the model group, the frequencies of scratching and sneezing were 24.2 ± 2.12 and 38.53 ± 2.09 (p < 0.01). After oral administration of GP, the accessorial frequencies were notably suppressed to 17.6 ± 2.31 and 27.40 ± 3.78 (p < 0.05), suggesting that GP alleviated to a good extent the nasal allergy symptoms of AR in mice.
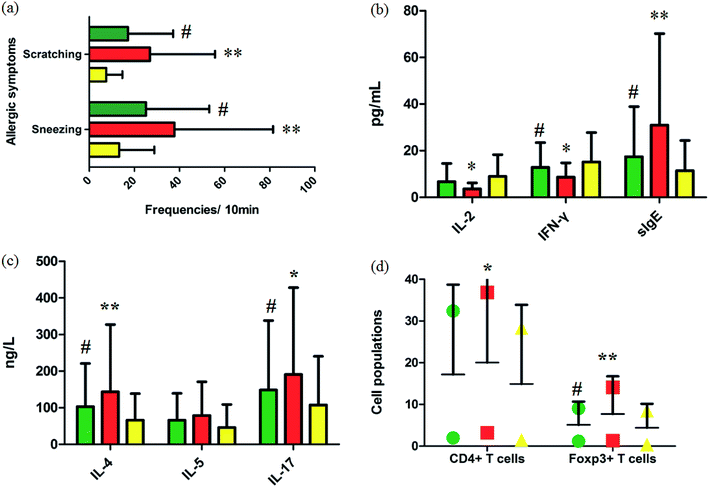 |
| | Fig. 1 Experimental AR model and GP therapeutic effect evaluation. (a) Frequencies of sneezing and scratching for 10 minutes after the last OVA challenge in mice. (b) and (c) Serum cytokine and sIgE analysis. (d) Cell populations in the spleens of mice with/without GP treatment in vivo. *p < 0.05 and **p < 0.01 vs. control group, #p < 0.05 vs. model group. Green, red, and yellow marks represent GP, model, and control groups, respectively. | |
3.2 Effect of GP on cytokines in serum
Serum cytokines and serum sIgE were closely associated to inflammatory responses in AR. By restraining production of these cytokines, rhinitis symptoms can be alleviated. The level of serum IL-4 (p < 0.01), IL-5, IL-17 (p < 0.05) and sIgE (p < 0.01) were notably higher in the OVA-exposed mice than in the control group (Fig. 1b and c). The levels of serum IL-2 (p < 0.05), INF-γ (p < 0.05), and sIgE (p < 0.01) were significantly lower in the model mice than in the control group (Fig. 1b). After giving GP orally in the model group, the concentrations of serum OVA-specific sIgE (p < 0.05) and serum cytokines such as IL-4 (p < 0.05), IL-5 and IL-17 (p < 0.05) notably decreased. Meanwhile, the expressions of IL-2 and INF-γ (p < 0.05) were up-regulated under the therapy of GP, when compared to the OVA group. These changes indicated that GP reduced the OVA-induced response by Th2 cytokines and sIgE.
3.3 Effect of GP on spleen Treg expression
Tregs might lead to asthma and allergy during the development of experimental allergic rhinitis. Compared with the control mice, the proportion of CD4+ T cells in spleens was higher in the model group after the last challenge (p < 0.05), and the quantity of these cells was slightly reduced in the GP group, but with no statistically significant difference. The same measurement was performed for Foxp3+ T cells. The increased percentage of Foxp3+ T cells (p < 0.01) was decreased after GP treatment, with a statistically significant difference (p < 0.05).
3.4 Serum metabolomic profiling
Using the optimal UPLC-MS conditions, 8042 positive ion (ESI+) peaks and 7242 negative ion (ESI−) peaks were identified using Progenesis QI after peak alignment from serum samples of the three groups. These processed data were exported to EZInfo TM software (Waters Corporation) for further multivariate statistical analyses. In PCA scores, every symbol stands for an individual serum sample, and the clustering of data indicate similar metabolomic compositions for these samples whereas well-separated data points indicate different metabolomic compositions. Metabolite profiles from an unsupervised PCA model were acquired (Fig. 2) to assess the protective activity of GP against experimental allergic rhinitis in mice. The metabolic profile data points of the model mice in positive and negative modes were separated in specific directions from those of the control group. GP groups were situated between the control group and the model group, which indicated that GP treatment promoted the redistribution of disordered metabolites in the serum of experimental allergic rhinitis mice, specifically from an unbalanced to normal distribution.
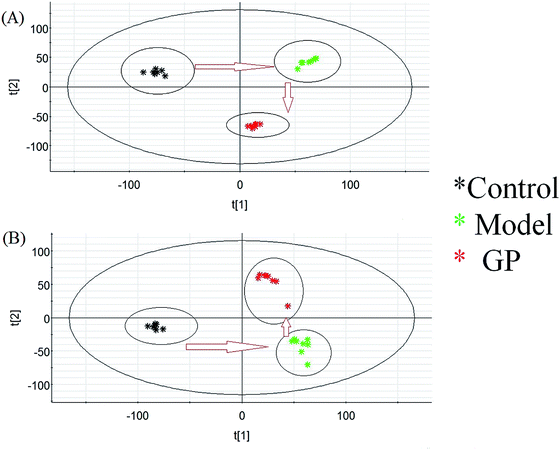 |
| | Fig. 2 Change in metabolic profile associated with GP treatment. (A) PCA score plot of serum metabolites for clustering the control, model and GP groups in positive ion mode. (B) PCA score plot of serum metabolites for the clustering of control, model and GP groups in negative ion mode. | |
3.5 Discovery and identification of metabolites
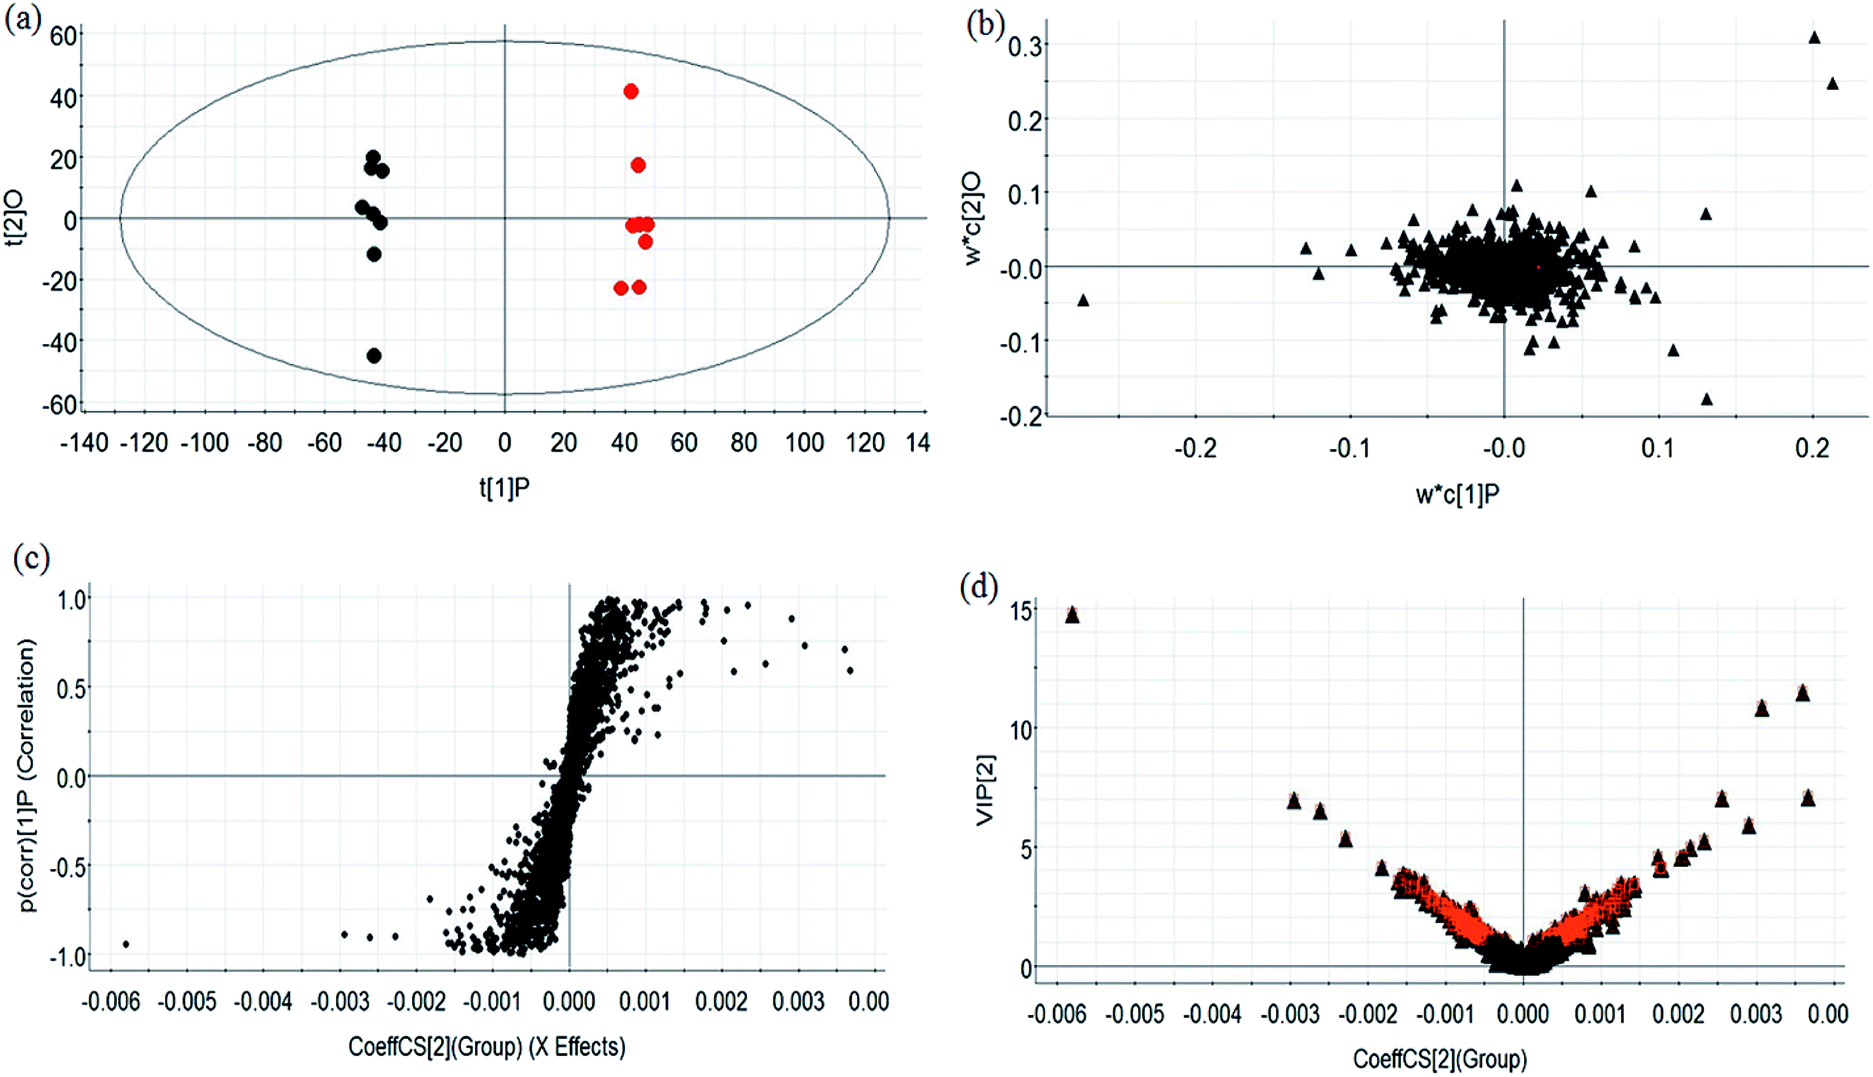
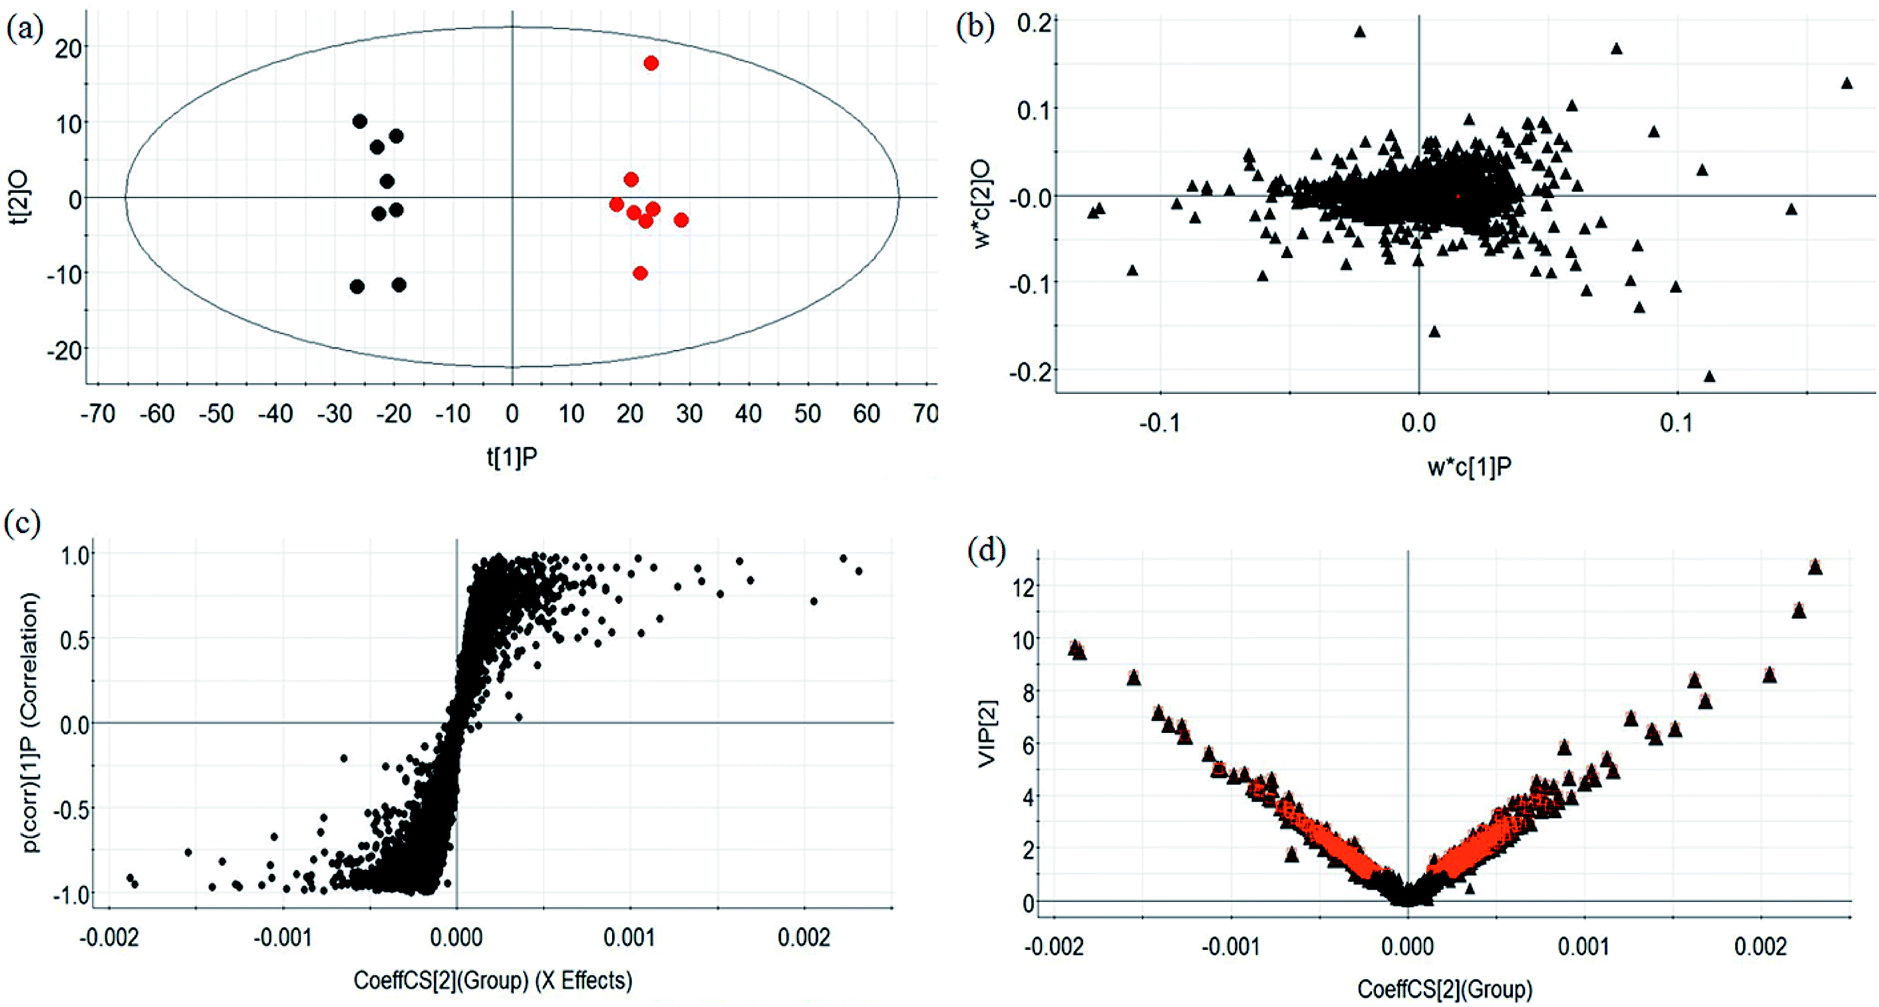
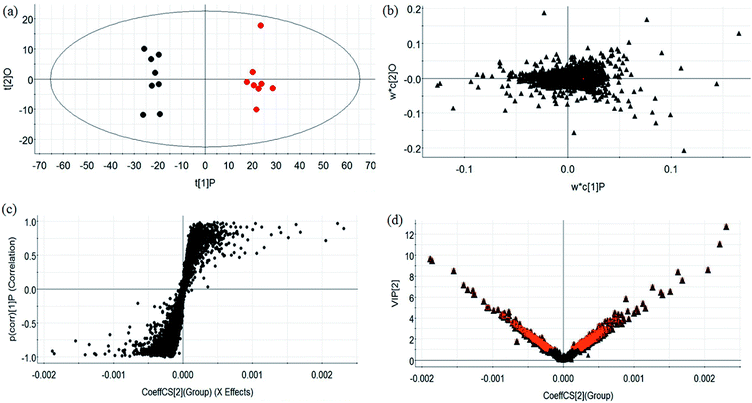
During UPLC-MS analysis, 171 metabolites were selected, out of which 94 had an occurrence frequency of at least 80% in the samples and were used for subsequent data analysis. For supervised OPLS-DA, the permutation plot was used to measure the validity and degree of overfit of the model, which was randomly permuted between 20 and 1000 times. The OPLS-DA plot showed a clear separation between the control group and model group (Fig. 3a in positive mode and Fig. 4a in negative mode), and we explored whether the differentially expressed metabolites accounted for the separation. From the corresponding loading plots, the ions furthest away from the origin may be deemed to be the differentiated metabolites (Fig. 3b in positive mode and Fig. 4b in negative mode). The subsequent S-plots in positive mode and negative mode (Fig. 3c and 4c) were used to assess the causative factors leading to diverse clustering on the score plots. To select potential markers, metabolites were used that, according to univariate and multivariate statistical analysis, differed significantly between the control and model groups. First, metabolites with a VIP score ≥ 1.0 from the OPLS-DA model were regarded as variables that significantly contributed to the clustering and discrimination (Fig. 3d in positive mode and Fig. 4d in negative mode). Then, metabolites with p < 0.05 were selected using the Student's t-test analysis. The potential biomarkers were selected by the combined results from VIP and t-test, and possible chemical compositions and molecular formulas were confirmed from a combination of MS/MS data and available biochemical databases. A total of 17 metabolites were identified as potential biomarkers related to the morbidity of allergic rhinitis between the control and model groups (Table S1†). From the heat map of these 17 differentially altered metabolites, 10 were up-regulated and 7 were down-regulated. Twelve metabolites were markedly regulated by GP treatment, including corticosterone, LysoPE (0:0/20:0), uridine, L-phenylalanine, D-tryptophan, LysoPC (15:0), uric acid, palmitic amide, D-glutamine, L-arginine, arachidonic acid, and D-asparagine (Fig. 5).
 |
| | Fig. 3 Multivariate analyses of metabolites in OVA-induced allergic rhinitis in positive ion mode. (a) OPLS-DA score plot of serum UPLC-MS spectra data for the control group (black marks) and model group (red marks). (b) Loading plot of OPLS-DA model of UPLC-MS spectra data for the control and model groups. (c) S-plot of OPLS-DA model of UPLC-MS spectra data for the control and model groups. (d) VIP plot of the OPLS-DA model of UPLC-MS spectra data for control and model groups. | |
 |
| | Fig. 4 Multivariate analyses from metabolites in OVA-induced allergic rhinitis ion in negative ion mode. (a) OPLS-DA score plot of serum UPLC-MS spectra data for the control and model groups. (b) Loading plot of the OPLS-DA model of the UPLC-MS spectra data for the control and model groups. (c) S-plot of OPLS-DA model of the UPLC-MS spectra data for the control and model groups. (d) VIP plot of OPLS-DA model of the UPLC-MS spectra data for the control and model groups. | |
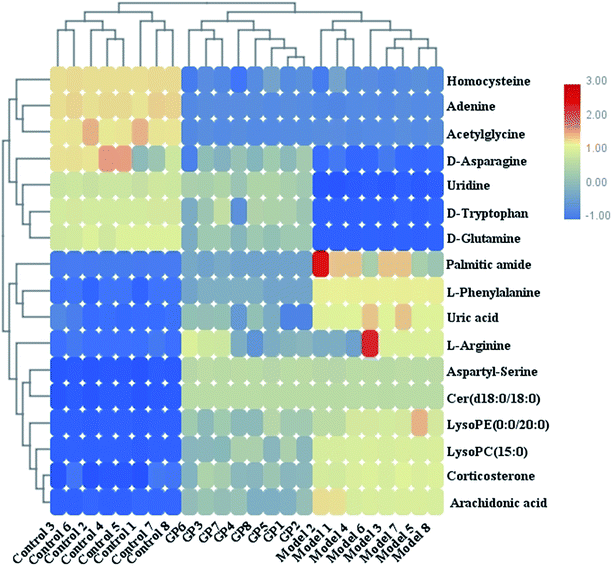 |
| | Fig. 5 Heat map of 17 differentially altered metabolites in serum samples in control, model and GP treatment groups. | |
3.6 Pathway analysis
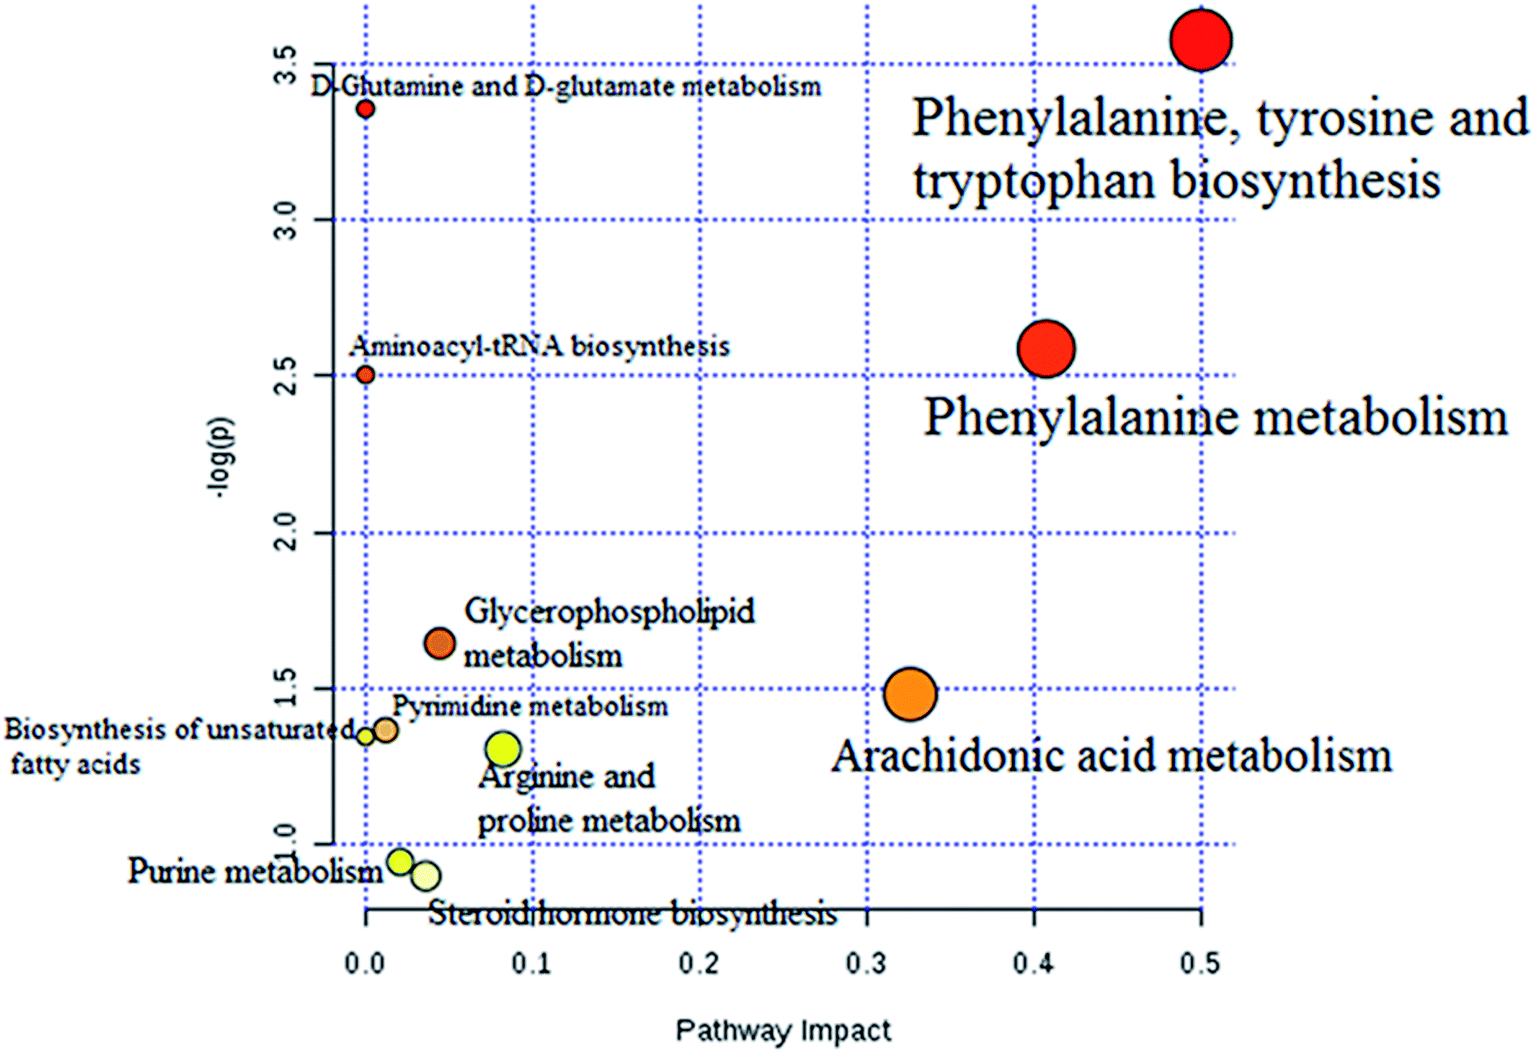
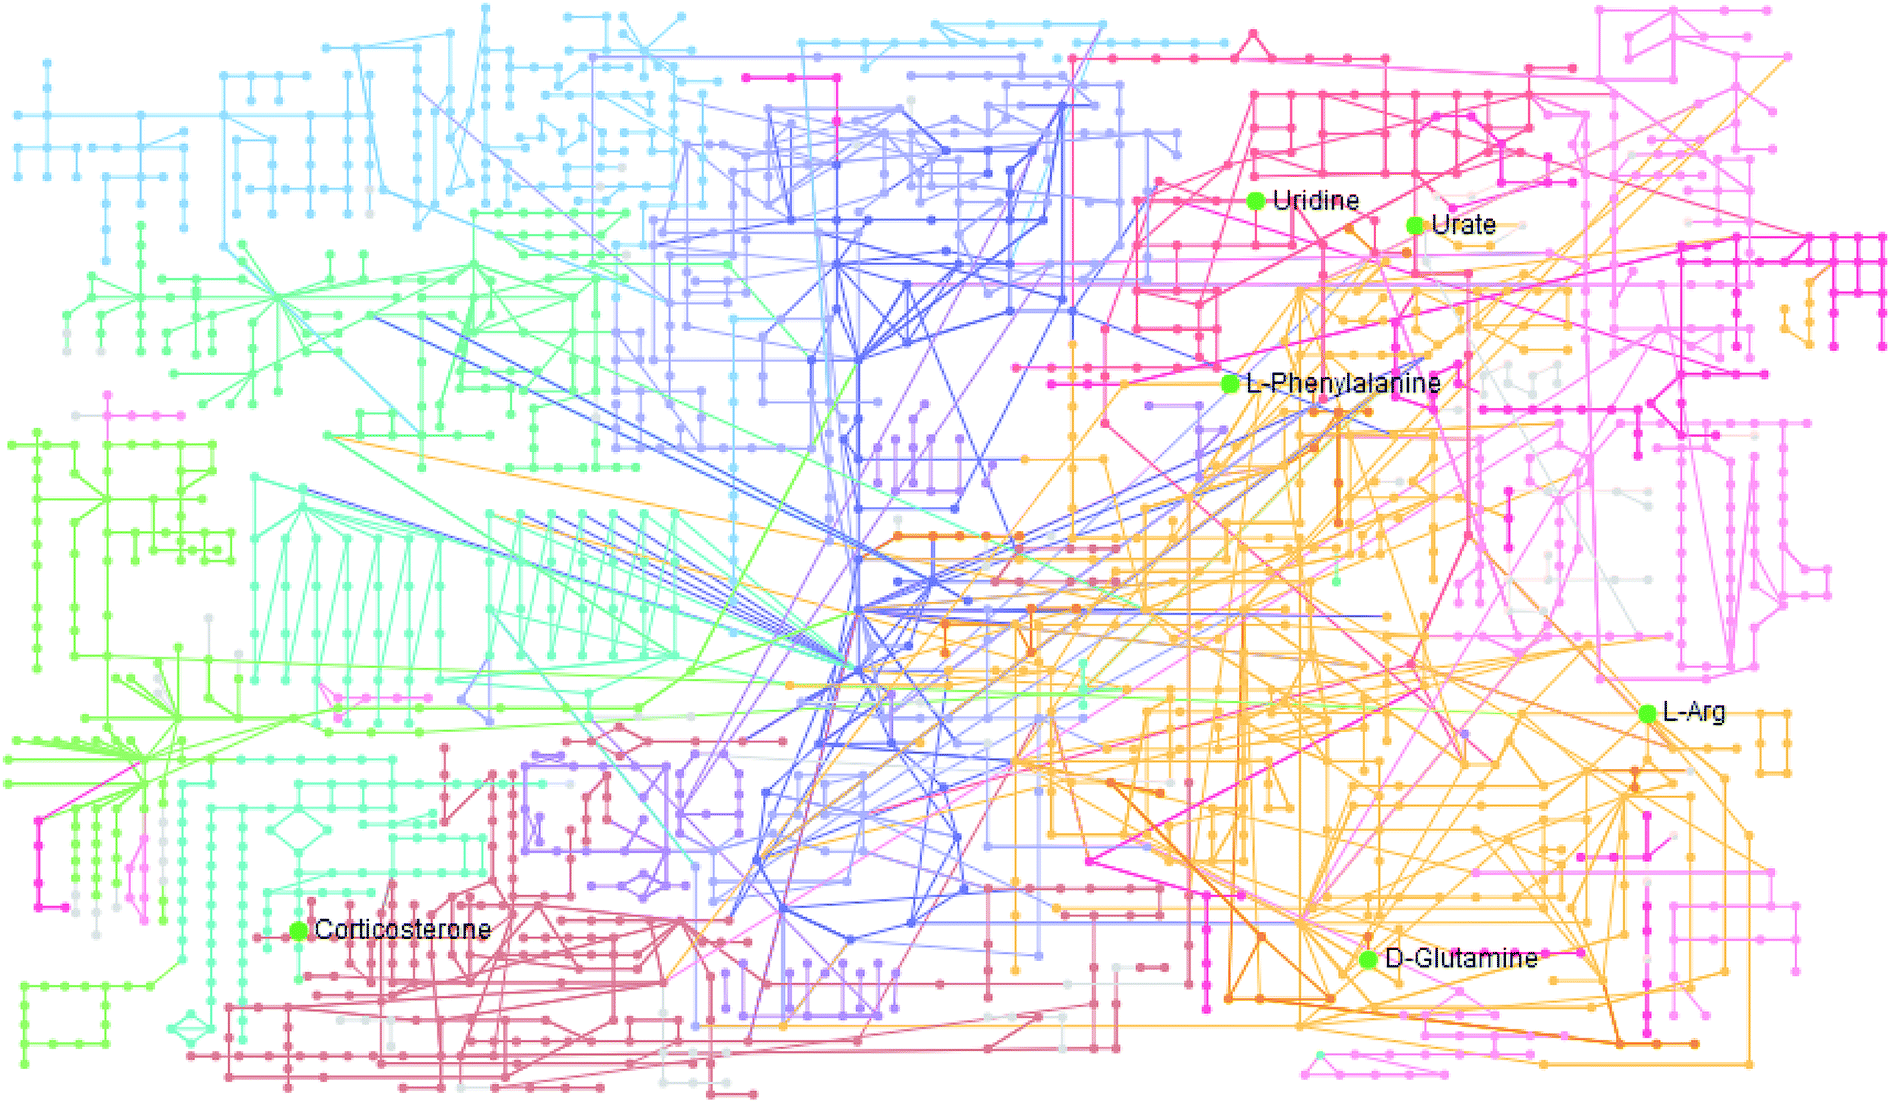
The statistically significant metabolites from the comparative analysis of GP treatment against model samples were imported to MetaboAnalyst 4.0 for pathway analysis, which clarified the metabolic pathways associated with GP treatment. As shown in Fig. 6, a total of 11 metabolic pathways were involved in the protective effect of GP against allergic rhinitis. Phenylalanine, tyrosine and tryptophan biosynthesis, phenylalanine metabolism, and arachidonic acid metabolism were the three main pathways in the serum samples according to the analysis, with impact values of 0.50, 0.41, 0.33. The metabolite network mainly involved pyrimidine metabolism, arginine and proline metabolism, aminoacyl-tRNA biosynthesis, purine metabolism, and alanine, aspartate and glutamate metabolism. A KEGG global metabolic network analysis (Fig. 7) yielded similar metabolic pathway results. The results obtained from the IPA analysis probing into detailed changes from complicated data in OVA-induced allergic rhinitis after GP treatment revealed that therapeutic activity of GP was related to cellular growth and proliferation, organismal development, and free radical scavenging of endogenous substances such as D-glutamine, L-arginine, L-phenylalanine, uridine and uric acid, cytokines, G-protein coupled receptor, transporters, and enzymes such as kinases (Fig. 8).
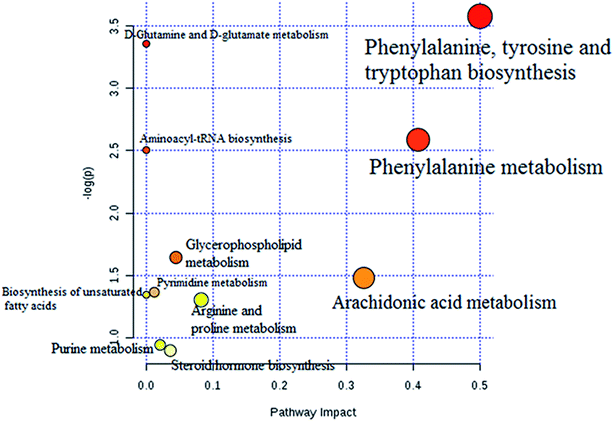 |
| | Fig. 6 Altered metabolomic pathways observed in serum sample after GP treatment. | |
 |
| | Fig. 7 KEGG global metabolic network associated with GP protective activity. | |
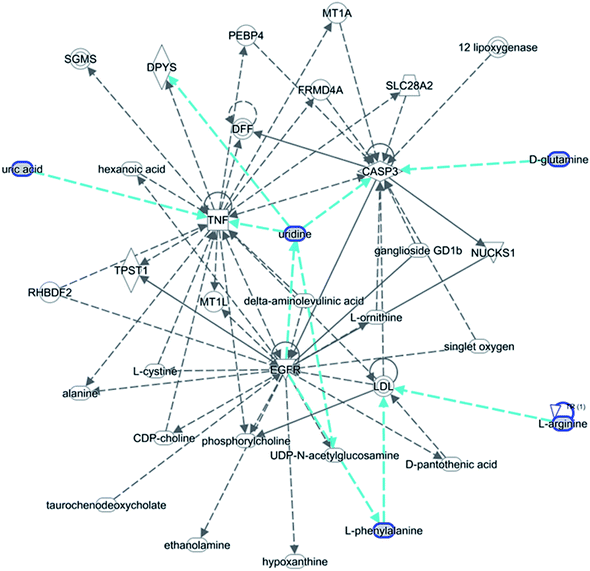 |
| | Fig. 8 IPA prediction networks related to OVA-induced allergic rhinitis mice treated with GP in this study. | |
4. Discussion
The main animal models used for AR studies are rodents, especially guinea pigs, rats and mice. BALB/c mice are commonly used for monoclonal antibodies and immunological studies due to their good production performance, long breeding period, general lack of invasive habits and relative ease of breeding.18,19 Currently, the two most common allergens used are OVA and TDI.20 TDI has a strong non-specific stimulatory effect and, as a toxic low-molecular chemical agent, poses certain hazards to personnel while being handled, while OVA does not display these drawbacks and has been successfully used in many studies.21 Because intraperitoneal and subcutaneous injections of allergens are not consistent with the natural law of morbidity, the method of sensitization should be limited to local administration. Basic sensitization by intraperitoneal injection has been more extensively developed and used in many studies, and the injection dose is easier to control in this manner than when applying nasal drops. Therefore, we finally chose to introduce the allergen by performing intraperitoneal injection, and performed local stimulation by applying nasal drops.
Cellular immunity has a certain reference value in the diagnosis and treatment of AR patients, in which levels of IL-4, IL-5, IL-17, and INF-γ are increased and those of IL-2 decreased.22 IL-2, as a type of cell growth factor in the immune system, regulates the cellular activity of leukocytes in the immune system.23 T lymphocytes and cytokines are closely linked to the pathogenesis of AR. IL-2 has ability to promote the proliferation of T lymphocytes, natural killer (NK) cells, B cell differentiation and antibody production, but abnormalities of IL-2 lead to clinical allergic diseases.24 TNF-β can interact with IL-2 in B cells to inhibit IgE production. IFN-γ is produced by T cells and NK cells, which have antiviral and immunomodulatory effects. In the current work, after GP treatment, the levels of IL-4, IL-5, IL-17, and sIgE were less than those in the model control group, and the levels of IL-2 and IFN-γ were higher than those in the model control group. The honeysuckle extract was suggested to be involved in the sensitization of OVA. The regulation of cytokines in mice with AR has played a major role in immune regulation resulting from the treatment of AR.
As attractive targets for the treatment of immunological disorders, Tregs and Foxp3+ T cells, which have a phenotypic peculiarity similar to that of Tregs, are present in circulating blood and in vitro. Removal of Foxp3+ T cells brings out the suppressive ability of Treg abrogation. In our study, treatment with GP was demonstrated to decrease the expression of CD4+ and Foxp3+ T cells in mice and reduce the quantity and hence function of Tregs. Therefore, we postulated that GP therapy in mice induces massive apoptosis of the CD4+ T cells and Foxp3+ Tregs.25,26 The levels of phenylalanine and arachidonic acid in the model group animal samples were increased and the level of tryptophan was decreased compared to the control group. After GP treatment, the abnormal state of metabolites was reversed, making them tend to normal levels. The aromatic amino acid phenylalanine is one of the essential amino acids in the human body. Most phenylalanine molecules are oxidized to tyrosine using the enzyme phenylalanine hydroxylase and used in the synthesis of important neurotransmitters and hormones together with tyrosine, which participate in glucose metabolism and fat metabolism in the body. Tryptophan is an essential amino acid that plays a key role in physiology and biochemistry, and reduces stress and inflammatory reactions. Arachidonic acid (AA) is an unsaturated fatty acid that is activated by phospholipase under the action of inflammatory stimuli and inflammatory mediators. The lysosomes of neutrophils constitute an important source of phospholipase. AA is metabolized by cyclooxygenase and lipoxygenase pathways to produce and release various products such as prostaglandins (PGs) and leukotriene (LT) leading to inflammatory reactions such as fever, pain, vasodilation, increased permeability, and exudation of leukocytes.27,28 Our study found that GP has a greater effect on the above metabolic pathway than on other metabolic pathways, and that GP can effectively recover the initial concentrations of metabolites in the model group. This pathway may thus be used as a new target for future clinical treatment of AR.
The pharmacological effects and applications of GP are extensive due to its various biological activities, which are important and whose development and utilization have high value. Therefore, it is necessary to use modern scientific research methods to make the most of this development and utilization. At present, the molecular targets and the mechanism of action of GP are still unclear. In addition, the lack of research on the optimization of the lead material, lack of research of the SAR system, and the inadequacy of ADME research has also led to difficulties in drug research.29 Metabolomics, as one of the latest strategies in system biology research,30–41 has been widely studied and used in various fields of pharmaceutical research.42–48 Compared with genomics and proteomics, metabolomics has certain advantages in terms of technology and research ideas. Metabolomics is more easily applied to the clinic and patients.49 Future research should pay attention to the scientific development of markers, technological developments, and multidisciplinary development to aim to guarantee the accuracy, repeatability, and safety of drug development and disease prevention.50–53
5. Conclusion
This study used a serum non-targeted metabolomics strategy to show the metabolic biomarkers and pathway alterations resulting from the use of GP to protect against experimental allergic rhinitis in mice. Identification of 12 proposed metabolites and 8 pathways contributed to a better understanding of the effects of GP on metabolism levels in mice afflicted with AR. An IPA analysis showed that anti-inflammatory activity of GP was closely associated with inhibiting cell growth and proliferation, sweeping free radical scavenging and controlling organismal development. The oral administration of GP was shown to rapidly and significantly alleviate the nasal symptoms of mice with AR. In addition, GP regulated the contents of cytokines in the serum and reduced the number of CD4+ and Foxp3+ Treg cells, which might suppress allergen-specific IgE production and local mucosal infiltration of eosinophils.
Conflicts of interest
There are no conflicts to declare.
Acknowledgements
This work was supported by grants from the Natural Science Foundation of Heilongjiang Province of China (H201330), Research Project of Heilongjiang Province Health and Family Planning Commission (2018583), and Outstanding Innovative Talent Support Program of Heilongjiang University of Chinese Medicine (051243).
References
- J. Bousquet, S. Arnavielhe and A. Bedbrook, et al., The Allergic Rhinitis and its Impact on Asthma (ARIA) score of allergic rhinitis using mobile technology correlates with quality of life: the MASK study, Allergy, 2018, 73(2), 505–510 CrossRef CAS PubMed.
- Ö. Özdemir and B. Elmas, Variable prevalence of allergic rhinitis and risk factors affecting the prevalence, Kulak Burun Bogaz Ihtis Derg, 2016, 26(6), 371–382 CrossRef PubMed.
- D. J. Lee, Y. J. Chung and Y. J. Yang, et al., The Impact of Allergic Rhinitis on Symptom Improvement in Pediatric Patients After Adenotonsillectomy, Clin. Exp. Otorhinolaryngol., 2018, 11(1), 52–57 CrossRef PubMed.
- D. W. Hyun, H. J. Min and M. S. Kim, et al., Dysbiosis of Inferior Turbinate Microbiota is Associated with High Total IgE Levels in Patients with Allergic Rhinitis, Infect. Immun., 2018, 86(4), e00934-17 CrossRef PubMed.
- L. Cazzoletti, M. Ferrari and M. Olivieri, et al., The gender, age and risk factor distribution differs in self-reported allergic and non-allergic rhinitis: a cross-sectional population-based study, Allergy, Asthma, Clin. Immunol., 2015, 1136 Search PubMed.
- H. B. Yilmaz, Allergic rhinitis in children with adenoidal hypertrophy and otitis media with effusion, Am. J. Otolaryngol., 2015, 36(4), 617–618 CrossRef PubMed.
- S. Hallit, C. Raherison and D. Malaeb, et al., The AAA Risk Factors Scale: A New Model to Screen for the Risk of Asthma, Allergic Rhinitis and Atopic Dermatitis in Children, Med. Princ. Pract., 2018 Search PubMed.
- H. Wang and Z. Luan, Problems and strategies on diagnosis and exclusion of non-allergic rhinitis, J. Clin. Otorhinolaryngol. Head Neck Surg., 2016, 30(3), 187–189 Search PubMed.
- C. Rondón, N. Blanca-López and P. Campo, et al., Specific immunotherapy in local allergic rhinitis: a randomized, double-blind placebo-controlled trial with Phleum pratense subcutaneous allergenimmunotherapy, Allergy, 2018, 73(4), 905–915 CrossRef PubMed.
- B. H. May, M. Feng and A. J. Hyde, et al., Comparisons between traditional medicines and pharmacotherapies for Alzheimer disease: a systematic review and meta-analysis of cognitive outcomes, Int. J. Geriatr. Psychiatry, 2018, 33(3), 449–458 CrossRef PubMed.
- D. Shin, S. Lee and Y. H. Huang, et al., Protective properties of geniposide against UV-B-induced photooxidative stress in human dermal fibroblasts, Pharm. Biol., 2018, 56(1), 176–182 CrossRef CAS PubMed.
- R. Deng, F. Li and H. Wu, et al., Anti-inflammatory Mechanism of Geniposide: Inhibiting the Hyperpermeability of Fibroblast-Like Synoviocytes via the RhoA/p38MAPK/NF-κB/F-Actin Signal Pathway, Front. Pharmacol., 2018, 9105 Search PubMed.
- X. Wang, Y. Han, and A. Zhang, et al., Metabolic profiling provides a system for the understanding of Alzheimer's disease in rats post-treatment with Kaixin San[M], Chinmedomics, Academic Press, 2015, pp. 347–362 Search PubMed.
- A. Zhang, H. Sun and G. Yan, et al., Metabolomics study of type 2 diabetes using ultra-performance LC-ESI/quadrupole-TOF high-definition MS coupled with pattern recognition methods, J. Physiol. Biochem., 2014, 70(1), 117–128 CrossRef CAS PubMed.
- A. Zhang, H. Wang and H. Sun, et al., Metabolomics strategy reveals therapeutical assessment of limonin on nonbacterial prostatitis, Food Funct., 2015, 6(11), 3540–3549 RSC.
- Q. Song, A. Zhang and G. Yan, et al., Technological advances in current metabolomics and its application in tradition Chinese medicine, RSC Adv., 2017, 7(84), 53516–53524 RSC.
- P. Zhang, W. Zhu and D. Wang, et al., A combined NMR- and HPLC-MS/MS-based metabolomics to evaluate the metabolic perturbations and subacute toxic effects of endosulfan on mice, Environ. Sci. Pollut. Res. Int., 2017, 24(23), 18870–18880 CrossRef CAS PubMed.
- X. Wang, Y. Zhu and D. Ni, et al., Intranasal application of glucocorticoid alleviates olfactory dysfunction in mice with allergic rhinitis, Exp. Ther. Med., 2017, 14(5), 3971–3978 CAS.
- T. T. Bui, D. A. Kwon and D. W. Choi, et al., Rosae multiflorae fructus extract and its four active components alleviate ovalbumin-induced allergic inflammatory responses via regulation of Th1/Th2 imbalance in BALB/c rhinitis mice, Phytomedicine, 2019, 55, 238–248 CrossRef CAS PubMed.
- V. R. Thakur, J. V. Beladiya and K. K. Chaudagar, et al., An anti-asthmatic activity of Natural Toll like receptor-4 antagonist in OVA-LPS induced asthmatic rats, Clin. Exp. Pharmacol. Physiol., 2018, 45(11), 1187–1197 CrossRef CAS PubMed.
- J. Xiong, W. Zhao and Y. Lin, et al., Phosphorylation of low density lipoprotein receptor-related protein 6 is involved in receptor for advanced glycation end product-mediated β-catenin stabilization in a toluene diisocyanate-induced asthma model, Int. Immunopharmacol., 2018, 59187–59196 Search PubMed.
- Q. Li, Y. L. Chen and Y. Y. Ma, et al., Effects of inhibiting the phosphorylation of JNK by absorbed INF-γ on the remodeling of nasal mucosa in allergic rhinitis rats, J. Clin. Otorhinolaryngol. Head Neck Surg., 2016, 30(13), 1034–1037 CAS.
- R. X. Ma, L. Hou and J. R. Hu, To observe the effect of “Fangfenggubenkeli” on IL-4, IL-5, IL-10 and IFN-γ cytokines in PBMC supernatant of allergic rhinitis patients with lung depression and spleen efficiency, J. Clin. Otorhinolaryngol. Head Neck Surg., 2017, 31(21), 1662–1665 CAS.
- V. Ablamunits, O. Henegariu and P. Preston-Hurlburt, et al., NKG2A is a marker for acquisition of regulatory function by human CD8+ T cells activated with anti-CD3 antibody, Eur. J. Immunol., 2011, 41(7), 1832–1842 CrossRef CAS PubMed.
- C. H. Chien and B. L. Chiang, Regulatory T cells induced by B cells: a novel subpopulation of regulatory T cells, J. Biomed. Sci., 2017, 24(1), 86 CrossRef PubMed.
- S. Lee, K. Park and J. Kim, et al., Foxp3 expression in induced regulatory T cells is stabilized by C/EBP in inflammatory environments, EMBO Rep., 2018, 19(12), e45995 CrossRef PubMed.
- D. Mai, C. Yang and Y. Xue, et al., Investigation on silymarin impact on lipopolysaccharide induced inflammation model based on arachidonic acid metabolism pathway, Chin. J. Chromatogr., 2017, 35(6), 578–586 CrossRef CAS PubMed.
- Y. Kato, Y. Mukai and A. Rane, et al., The Inhibitory Effect of Telmisartan on the Metabolism of Arachidonic Acid by CYP2C9 and CYP2C8: An in Vitro Study, Biol. Pharm. Bull., 2017, 40(9), 1409–1415 CrossRef CAS PubMed.
- L. Bijlsma, R. Gil-Solsona and F. Hernández, et al., What about the herb? A new metabolomics approach for synthetic cannabinoid drug testing, Anal. Bioanal. Chem., 2018, 410(21), 5107–5112 CrossRef CAS PubMed.
- G. Palacios, J. J. Bowling and A. Abdolvahabi, et al., The growing landscape of metabolomics and lipidomics: applications to medicinal chemistry and drug discovery, Future Med. Chem., 2019, 11(6), 495–498 CrossRef CAS PubMed.
- W. Dong, P. Wang and X. Meng, et al., Ultra-performance Liquid Chromatography-High-definition Mass Spectrometry Analysis of Constituents in the Root of Radix Stemonae and those Absorbed in Blood after Oral Administration of the Extract of the Crude Drug, Phytochem. Anal., 2012, 23(6), 657–667 CrossRef CAS PubMed.
- A. Zhang, H. Sun, G. Yan, P. Wang and X. Wang, Mass spectrometry-based metabolomics: applications to biomarker and metabolic pathway research, Biomed. Chromatogr., 2016, 30(1), 7–12 CrossRef PubMed.
- F. Wu, H. Sun and W. Wei, et al., Rapid and global detection and characterization of the constituents in ShengMai San by ultra-performance liquid chromatography-high-definition mass spectrometry, J. Sep. Sci., 2011, 34(22), 3194–3199 CrossRef CAS PubMed.
- A. Zhang, H. Sun and X. Wang, Urinary metabolic profiling of rat models revealed protective function of scoparone against alcohol induced hepatotoxicity, Sci. Rep., 2014, 4, 6768 CrossRef PubMed.
- T. Zhang, A. Zhang, S. Qiu, H. Sun, Y. Han, Y. Guan and X. Wang, High-throughput metabolomics approach reveals new mechanistic insights for drug response of phenotypes of geniposide towards alcohol-induced liver injury by using liquid chromatography coupled to high resolution mass spectrometry, Mol. BioSyst., 2016, 13(1), 73–82 RSC.
- A. Zhang, H. Sun, and W. Sun, et al., Metabolomics and Proteomics Annotate Therapeutic Mechanisms of Geniposide, Chinmedomics, Academic Press, 2015, pp. 157–173 Search PubMed.
- T. Zhang, A. Zhang, S. Qiu, S. Yang and X. Wang, Current Trends and Innovations in Bioanalytical Techniques of Metabolomics, Crit. Rev. Anal. Chem., 2016, 46(4), 342–351 CrossRef CAS PubMed.
- A. H. Zhang, J. B. Yu and H. Sun, et al., Identifying quality-markers from Shengmai San protects against transgenic mouse model of Alzheimer's disease using chinmedomics approach, Phytomedicine, 2018,(18), 30104–301011 Search PubMed.
- A. Zhang, H. Sun and G. Yan, et al., Chinmedomics: A Powerful Approach Integrating Metabolomics with Serum Pharmacochemistry to Evaluate the Efficacy of Traditional Chinese Medicine, Engineering, 2019, 5, 60–68 CrossRef.
- J. L. Ren, A. H. Zhang and L. Kong, et al., Advances in mass spectrometry-based metabolomics for investigation of metabolites, RSC Adv., 2018, 8(40), 22335–22350 RSC.
- X. Wang, H. Lv and A. Zhang, et al., Metabolite profiling and pathway analysis of acute hepatitis rats by UPLC-ESI MS combined with pattern recognition methods, Liver Int., 2014, 34(5), 759–770 CrossRef CAS PubMed.
- A. Zhang, H. Sun and H. Xu, et al., Cell metabolomics, OMICS, 2013, 17(10), 495–501 CrossRef CAS PubMed.
- A. Zhang, H. Sun and S. Qiu, et al., Advancing drug discovery and development from active constituents of yinchenhao tang, a famous traditional chinese medicine formula, Evid. Based Complement. Alternat. Med., 2013, 2013 Search PubMed.
- H. Sun, A. H. Zhang and S. B. Liu, et al., Cell metabolomics identify regulatory pathways and targets of magnoline against prostate cancer, J. Chromatogr. B: Anal. Technol. Biomed. Life Sci., 2018, 1102–1103, 143–151 CrossRef CAS PubMed.
- H. Sun, A. Zhang and Q. Song, et al., Functional metabolomics discover pentose and glucuronate interconversion pathways as promising targets for Yang Huang syndrome treatment with Yinchenhao Tang, RSC Adv., 2018, 8(64), 36831–36839 RSC.
- X. Wang, A. Zhang and H. Sun, et al., Discovery and development of innovative drug from traditional medicine by integrated chinmedomics strategies in the post-genomic era, TrAC, 2016, 76, 86–94 CAS.
- A. Zhang, H. Sun and G. Yan, et al., Metabolomics Analysis of Marker Metabolites for Patients with Pancreatic Cancer, Med. Chem., 2014, 4, 506–510 Search PubMed.
- A. Zhang, H. Sun and X. Wang, Mass spectrometry-driven drug discovery for development of herbal medicine, Mass Spectrom. Rev., 2018, 37(3), 307–320 CrossRef CAS PubMed.
- H. Sun, M. Wang and A. Zhang, et al., UPLC–Q-TOF–HDMS Analysis of Constituents in the Root of Two Kinds of Aconitum Using a Metabolomics Approach, Phytochem. Anal., 2013, 24(3), 263–276 CrossRef CAS PubMed.
- X. Liu, A. Zhang and H. Fang, et al., Serum metabolomics strategy for understanding the therapeutic effects of Yin-Chen-Hao-Tang against Yanghuang syndrome, RSC Adv., 2018, 8(14), 7403–7413 RSC.
- Q. Zhao, A. Zhang and W. Zong, et al., Chemometrics strategy coupled with high resolution mass spectrometry for analyzing and interpreting comprehensive metabolomic characterization of hyperlipemia, RSC Adv., 2016, 6(113), 112534–112543 RSC.
- X. Wang, Q. Wang and A. Zhang, et al., Metabolomics study of intervention effects of Wen-Xin-Formula using ultra high-performance liquid chromatography/mass spectrometry coupled with pattern recognition approach, J. Pharm. Biomed. Anal., 2013, 74, 22–30 CrossRef CAS PubMed.
- A. H. Zhang, H. Sun, S. Qiu and X. J. Wang, Recent highlights of metabolomics in chinese medicine syndrome research, Evid. Based Complement. Alternat. Med., 2013, 2013, 402159 Search PubMed.
Footnotes |
| † Electronic supplementary information (ESI) available. See DOI: 10.1039/c9ra02166c |
| ‡ These authors contributed equally to this work. |
|
| This journal is © The Royal Society of Chemistry 2019 |
Click here to see how this site uses Cookies. View our privacy policy here. 
 Open Access Article
 This Open Access Article is licensed under a Creative Commons Attribution-Non Commercial 3.0 Unported Licence
 *a,
Peng-Cheng Yu‡b and
Peng Liu‡a
*a,
Peng-Cheng Yu‡b and
Peng Liu‡a