
 Open Access Article
 This Open Access Article is licensed under a Creative Commons Attribution-Non Commercial 3.0 Unported Licence
Aggregation-induced emission enhancement (AIEE)-active tetraphenylethene (TPE)-based chemosensor for Hg2+ with solvatochromism and cell imaging characteristics†
Aling
Tang
,
Zhao
Chen
 *,
Diandian
Deng
,
Gang
Liu
,
Yayi
Tu
and
Shouzhi
Pu
*
*,
Diandian
Deng
,
Gang
Liu
,
Yayi
Tu
and
Shouzhi
Pu
*
Jiangxi Key Laboratory of Organic Chemistry, Jiangxi Science and Technology Normal University, Nanchang 330013, PR China. E-mail: chenzhao666@126.com; pushouzhi@tsinghua.org.cn
First published on 16th April 2019
Abstract
An aggregation-induced emission enhancement (AIEE)-active fluorescent sensor based on a tetraphenylethene (TPE) unit has been successfully designed and synthesized. Interestingly, the luminogen could detect Hg2+ with high selectivity in an acetonitrile solution without interference from other competitive metal ions, and the detection limit was 7.46 × 10⁻⁶ mol L−1. Furthermore, the luminogen also showed interesting solvatochromic behavior and superior cell imaging performance.
The design and synthesis of molecular sensors for the detection of metal ions, especially transition-metal ions, has attracted much attention.1–3 Among all transition-metal ions, mercury (Hg2+) is identified as one of the most dangerous and ubiquitous heavy metals. Indeed, it is not biodegradable, and can cause extreme injury to the environment as well as human health.4–8 Additionally, it can be accumulated through the food chain in the human body, consequently giving rise to several deleterious effects such as central nervous system defects, kidney damage, endocrine system disease and so on.9–12 Although many governments around the world have adopted strict regulations to limit Hg2+ emission, the global Hg2+ pollution caused by human activities is still serious.13,14 Therefore, it is highly desirable to develop a new method for the detection of Hg2+ with high selectivity and sensitivity.15–17
Most traditional fluorescent sensors suffer from a detrimental phenomenon called aggregation-caused quenching (ACQ), which usually results in a poor solid-state emission efficiency. Fortunately, in 2001, Tang et al. reported a fluorescent molecule named 1-methyl-1,2,3,4,5-pentaphenylsilole. Interestingly, the fluorescence emission of this luminogen was induced by aggregation, a phenomenon referred to as aggregation-induced emission (AIE).18 Subsequently, in 2002, Park et al. reported an interesting phenomenon named aggregation-induced emission enhancement (AIEE).19 In fact, both AIE and AIEE can achieve highly efficient emission in the solid state or aggregated state.20–27 In the past years, AIE (or AIEE) phenomenon has attracted considerable research interest owing to the potential applications in a lot of fields, including bioimaging, fluorescence sensors, organic lighting emitting diode (OLED) devices and organic lasers.28–33 Meanwhile, many stimuli-responsive materials have been reported, including photochromism, mechanochromism, and solvatochromism.34–46 At present, the solvatochromism materials have been generally used in chemical and biological systems.47 To date, many fluorescent chemosensors for Hg2+ have been reported. In contrast, the corresponding chemosensors with AIE or AIEE effect are rare, not to mention solvatochromic AIE or AIEE-active fluorescent sensors for Hg2+ with good cell imaging behavior. Indeed, preparing such multifunctional sensors is challenging and significative. In this paper, we reported an AIEE-active tetraphenylethene (TPE)-based fluorescent sensor (Scheme 1) for the detection of Hg2+. Furthermore, the luminogen also showed remarkable solvatochromism and good cell imaging characteristics.
 | ||
| Scheme 1 The synthetic route of luminogen 1. | ||
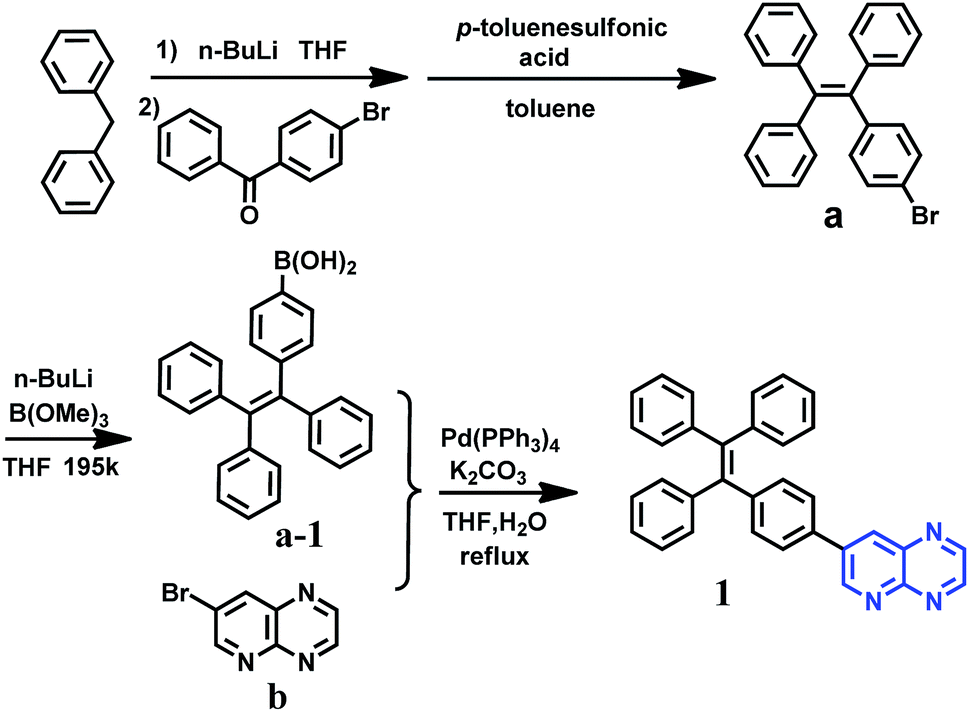
To investigate the AIEE phenomenon of luminogen 1, we initially studied the UV-visible absorption spectra and photoluminescence (PL) spectra in acetonitrile–water mixtures with different water fractions (fw). The results indicated that the absorption spectra exhibited level-off tails in the long wavelength region as the water content increased (Fig. S1†). It is well-known that such tails are usually associated with the Mie scattering effect, which is the key signal of nano-aggregate formation.48,49 As presented in Fig. 1, luminogen 1 showed weak fluorescence and the luminescence quantum yield (Φ) was as low as 1.35%. Interestingly, when the fw in the acetonitrile solution was increased to 80%, an obvious emission band was formed, and a yellow-green fluorescence was observed. As the water content was increased to 90%, the emission intensity was further increased, and a bright yellow-green luminescence (Φ = 27.81%) with a λmax at 545 nm could be observed.
 | ||
| Fig. 1 (a) Fluorescence spectra of the dilute solutions of 1 (2.0 × 10⁻⁵ mol L−1) in acetonitrile–water mixtures with different water content (0–90%). Excitation wavelength = 380 nm. (b) Changes the emission intensity of 1 at 545 nm in acetonitrile–water mixtures with different volume fractions of water (0–90%). (c) PL images of 1 (2.0 × 10⁻⁵ mol L−1) in acetonitrile–water mixtures with different fw values under 365 nm UV illumination. | ||
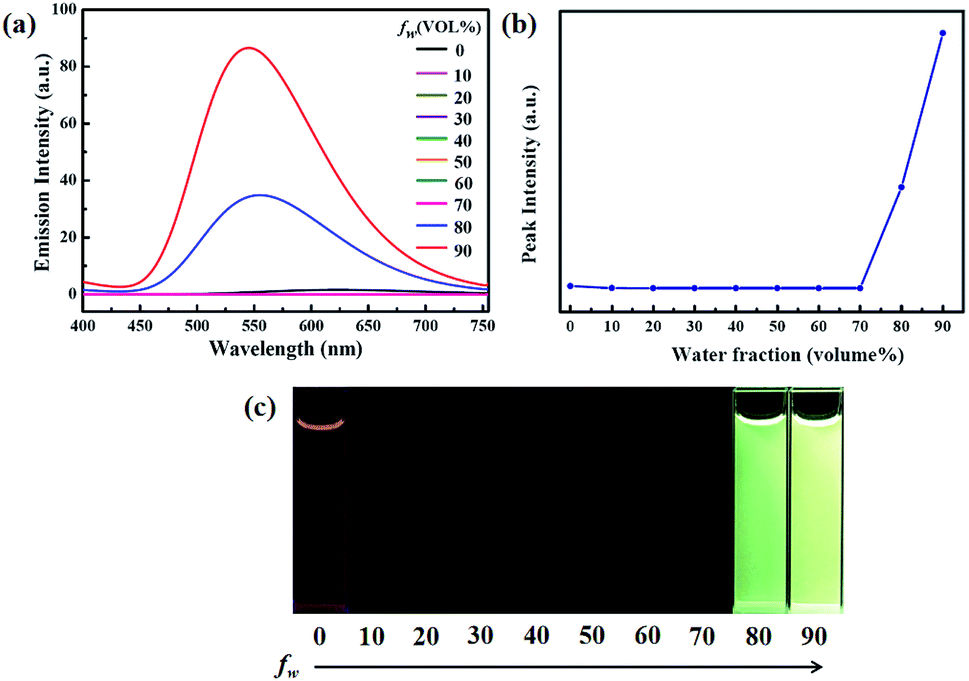
Clearly, water is a poor solvent of luminogen 1. As a result, the generation of the yellow-green emission can be attributed to the aggregate formation.50–52 Moreover, as shown in Fig. 2, the nano-aggregates obtained were verified by dynamic light scatterings (DLS). Therefore, 1 is a typical AIEE-active fluorescent molecule, and its AIEE behavior is caused by the restricted intramolecular rotation. As shown in Fig. S2,† solid-state compound 1 showed a strong green emission (Φ = 14.50%) with a λmax at 497 nm, and the corresponding fluorescence lifetime is 2.66 ns (Fig. S3†).
 | ||
| Fig. 2 Size distribution curve of luminogen 1 (2.0 × 10⁻⁵ mol L−1) in acetonitrile–water mixtures with fw = 90%. | ||
On the other hand, the luminogen 1 also displayed interesting solvatochromism effect. As presented in Fig. 3, the absorption spectra and fluorescence spectra of luminogen 1 in different solvents were investigated, respectively. Obviously, the absorption spectra was barely affected by the polarity of solvents. However, the photoluminescence peaks were gradually red-shifted from 515 nm to 625 nm, and thus 1 exhibited remarkable solvatochromism behavior. Obviously, the molecular structure of luminogen 1 is distorted due to the presence of TPE unit, and the conjugation degree of molecule 1 is different in various solvents, and the intramolecular charge transfer (ICT) effect is possibly responsible for the solvatochromism behavior of 1.
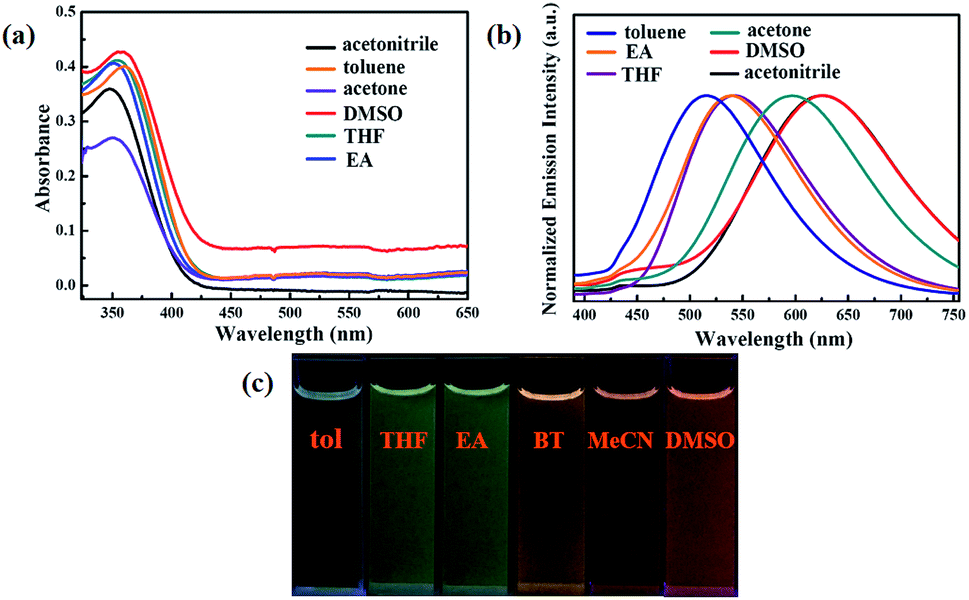 | ||
| Fig. 3 (a) UV-Vis absorption spectra and (b) normalized fluorescence spectra (Excitation wavelength = 380 nm) of luminogen 1 in different solvents (2.0 × 10⁻⁵ mol L−1). (c) Photographs of 1 under 365 nm UV illumination in different solvents: tol (toluene); THF (tetrahydrofuran); EA (ethyl acetate); BT (acetone); MeCN (acetonitrile); DMSO (dimethyl sulfoxide). | ||
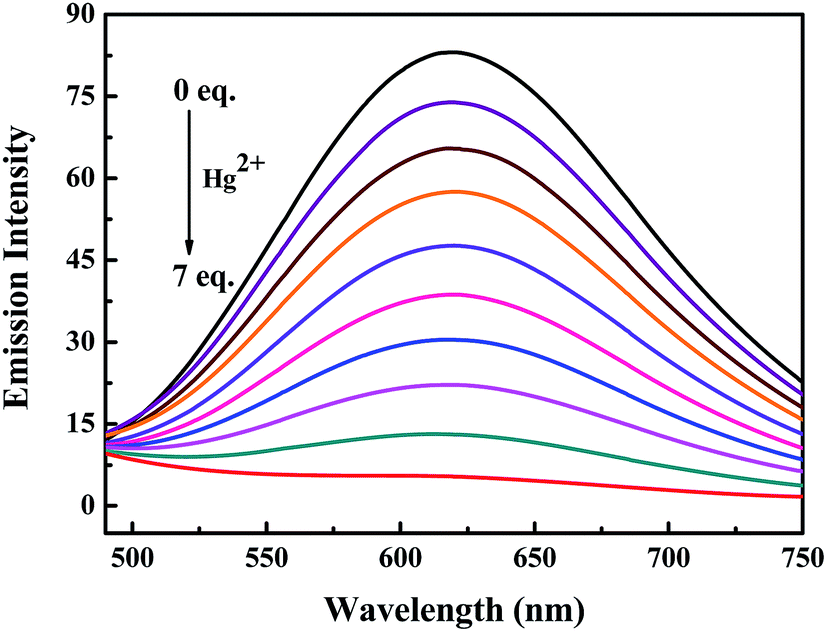
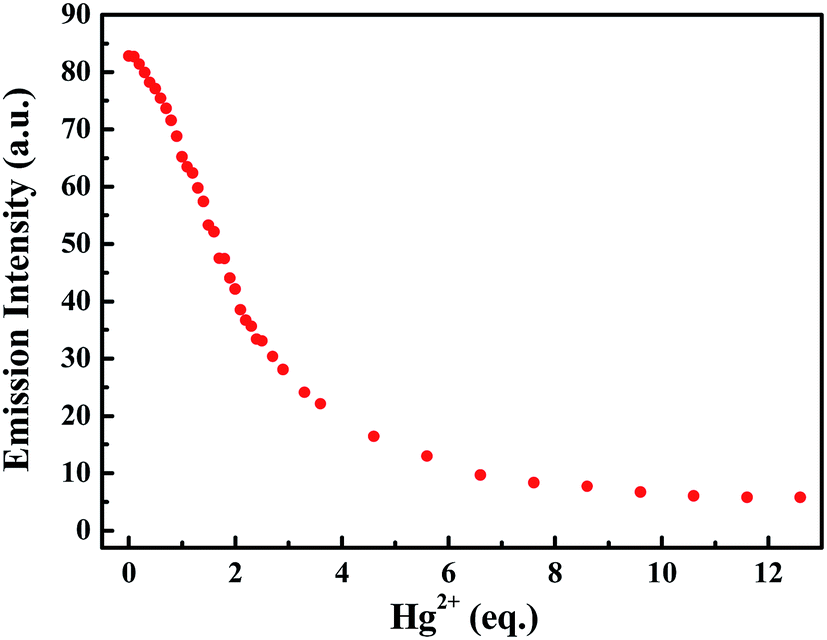
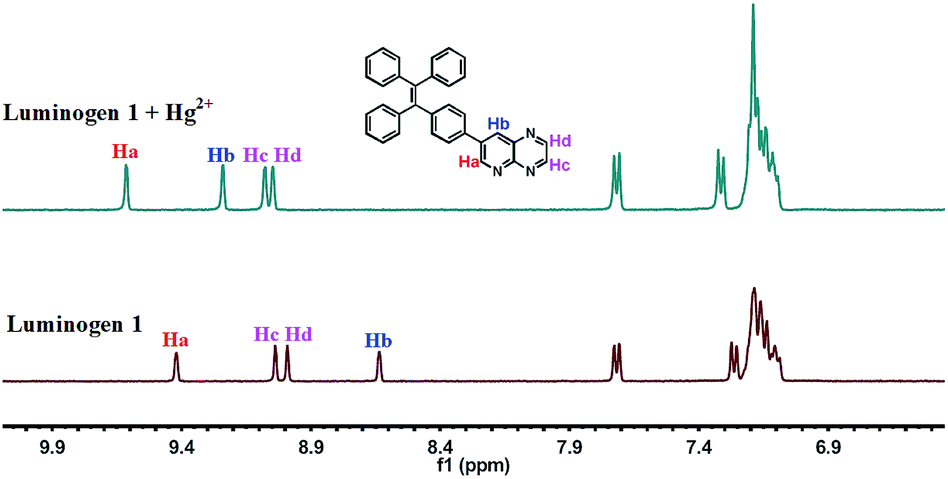
Subsequently, the changes in the fluorescence of luminogen 1 induced by Hg2+ were investigated in acetonitrile (2.0 × 10⁻⁵ mol L−1) at room temperature. In the fluorometric titration experiments, as shown in Fig. 4, the emission intensity significantly decreased when the Hg2+ concentration increased from 0 to 7.0 equivalents in acetonitrile. Meanwhile, the fluorescent color changed from orange-red to colorless, and followed by a plateau upon further titration (Fig. 5). Remarkably, the emission intensity of luminogen 1 was almost quenched completely. Furthermore, based on the titration experiments, the detection limit of luminogen 1 for Hg2+ on the basis of LOD = 3 × σ/B (where σ is the standard deviation of blank sample and B is the slope between the fluorescence intensity versus Hg2+ concentration) was 7.46 × 10⁻⁶ M (Fig. S4†). Moreover, a good linear relationship could be obtained (R = −0.9933) and the quenching constant of luminogen 1 with Hg2+ was 1.9 × 10⁴ M−1 (Fig. S5†). On the other hand, the binding ratio of luminogen 1 for Hg2+ was established through Job's plot and the results showed 1![[thin space (1/6-em)]](https://www.rsc.org/images/entities/char_2009.gif) :1 stoichiometric complexation (Fig. S6†). Next, the binding interactions between 1 and Hg2+ were further investigated by NMR in acetonitrile-d3. As presented in Fig. 6, the signal of Ha from 9.42 ppm shifted to 9.62 ppm and the Hb changed from 8.43 ppm to 9.24 ppm. Besides, the Hc or Hd was slightly shifted for 0.04 ppm or 0.06 ppm, respectively. These consequences revealed that the N on the pyridine and the N on the pyrazine (near the N on the pyridine) are the most probable binding with Hg2+. Mass spectra were utilized to further demonstrate the binding mode of luminogen 1 toward Hg2+. The peak located at m/z = 820.0 was coincided well with the ensemble [1 + Hg2+ +2NO3− + Cl−]−, confirming the binding ratio of luminogen 1 for Hg2+ with 1:1 stoichiometry (Fig. S7†).
:1 stoichiometric complexation (Fig. S6†). Next, the binding interactions between 1 and Hg2+ were further investigated by NMR in acetonitrile-d3. As presented in Fig. 6, the signal of Ha from 9.42 ppm shifted to 9.62 ppm and the Hb changed from 8.43 ppm to 9.24 ppm. Besides, the Hc or Hd was slightly shifted for 0.04 ppm or 0.06 ppm, respectively. These consequences revealed that the N on the pyridine and the N on the pyrazine (near the N on the pyridine) are the most probable binding with Hg2+. Mass spectra were utilized to further demonstrate the binding mode of luminogen 1 toward Hg2+. The peak located at m/z = 820.0 was coincided well with the ensemble [1 + Hg2+ +2NO3− + Cl−]−, confirming the binding ratio of luminogen 1 for Hg2+ with 1:1 stoichiometry (Fig. S7†).
 | ||
| Fig. 4 Fluorescence titration spectra of luminogen 1 (2.0 × 10⁻⁵ mol L−1) induced by Hg2+ (0–7.0 equiv.) in an acetonitrile solution. Excitation wavelength = 380 nm. | ||
 | ||
| Fig. 5 The emission intensity changes of luminogen 1 at 625 nm with different equivalents of Hg2+. | ||
 | ||
| Fig. 6 1H NMR (acetonitrile-d3, 400 MHz) spectra changes of luminogen 1 in the presence of Hg2+. | ||
Next, in order to study the selectivity behavior of luminogen 1 as a fluorescent sensor for Hg2+, other metal ions, such as Zn2+, Cd2+, Ba2+, Sr2+, Mn2+, Mg2+, Ca2+, Pb2+, Ni2+, Co2+, Cu2+, Al3+, Fe3+, Cr3+, Ag+ and K+ were also measured in acetonitrile under the same experimental conditions. The corresponding UV-Vis absorption spectra were shown in Fig. S8.† Furthermore, as showed in Fig. 7, when these cations were added separately into the solution containing luminogen 1, no obvious fluorescence changes were observed. Indeed, as noticed in Fig. S9,† no obvious interference was observed when Hg2+ (7.0 equiv.) was added with other ions (7.0 equiv.). These results indicated that luminogen 1 could be served as a highly selective fluorescent sensor for detection of Hg2+.
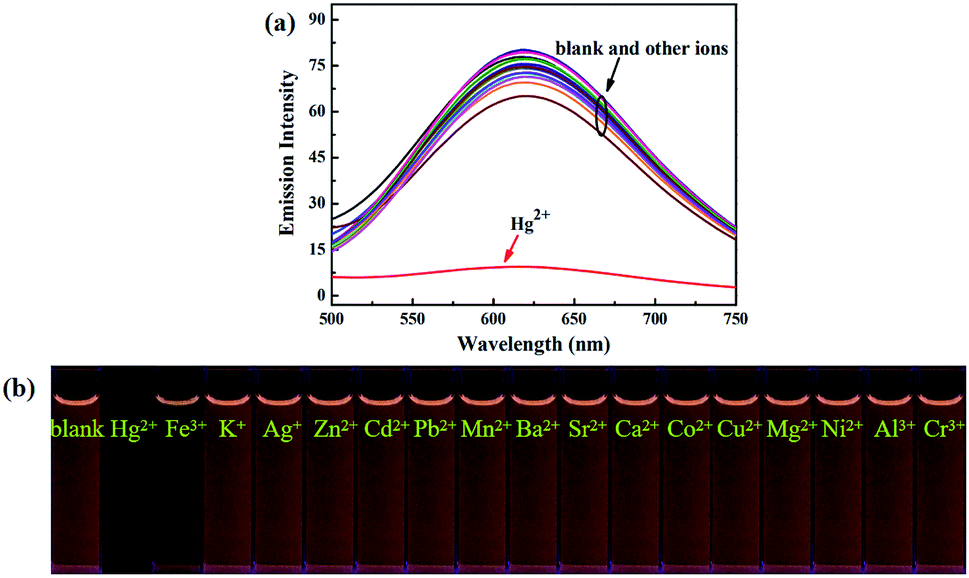 | ||
| Fig. 7 (a) Fluorescence spectra of luminogen 1 (2.0 × 10⁻⁵ mol L−1) towards various cations including Zn2+, Cd2+, Hg2+, Ba2+, Sr2+, Mn2+, Mg2+, Ca2+, Pb2+, Ni2+, Co2+, Cu2+, Al3+, Fe3+, Cr3+, Ag+ and K+. Excitation wavelength = 380 nm. (b) Fluorescence photographs of luminogen 1 after addition of various metal ions (7.0 equiv.) under 365 nm light. | ||
Fluorescent probe is a powerful tool for optical imaging, which allows direct visualization of biological analytes.53 Luminogen 1 was AIEE-active due to the restriction of intramolecular rotation in the aggregate state, which is beneficial for cell imaging. Indeed, the viability of HeLa cells incubated with luminogen 1 was evaluated by the standard MTT method (Fig. 8), and the result indicated that compound 1 exhibited low cytotoxicity. Next, cell imaging behavior of luminogen 1 was investigated using a confocal laser scanning microscopy (CLSM). HeLa cells were incubated with luminogen 1 (20 μM) for 30 min at 37 °C and the fluorescence images were obtained by CLSM.
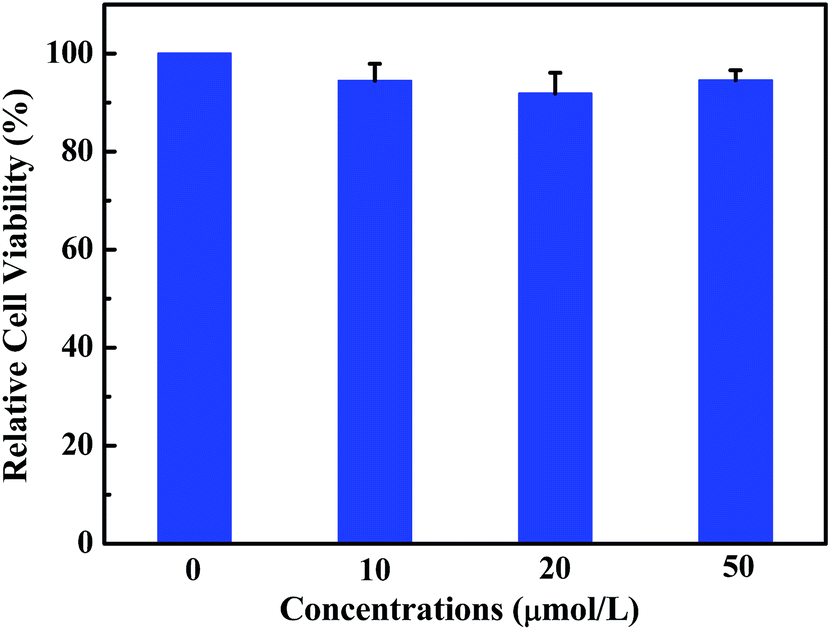 | ||
| Fig. 8 The MTT assay of compound 1 for measuring cell viability. | ||
As presented in Fig. 9, an intense yellow-green fluorescence, which was consistent with the fluorescence of luminogen 1 in acetonitrile–water mixture with high water content (80% or 90%), was displayed inside the cells. This result indicated that luminogen 1 tended to aggregate inside the cells, and thus the bright yellow-green luminescence was clearly observed. Furthermore, the merged picture c demonstrated that picture a and picture b overlapped very well. These results indicated that luminogen 1 showed superior cell imaging performance.
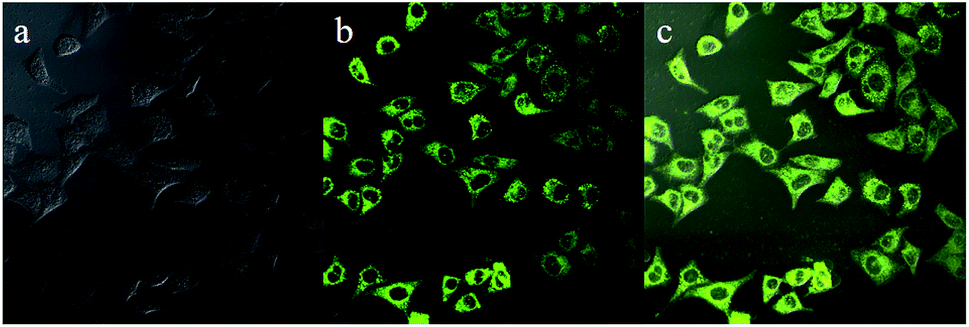 | ||
| Fig. 9 Fluorescence images of HeLa cells incubated with luminogen 1 (20 μM) for 30 min at 37 °C: (a) bright field image; (b) fluorescence image; (c) merge image (a and b). | ||
In summary, a TPE-based fluorescent molecule was designed and synthesized. The luminogen exhibited obvious AIEE phenomenon. Moreover, luminogen 1 could be used as a highly selective fluorescence turn-off chemosensor for Hg2+, and the detection limit was 7.46 × 10⁻⁶ mol L−1. Furthermore, 1 also displayed interesting solvatochromic behavior and superior cell imaging performance. Further studies on the design of new AIE or AIEE-active fluorescent chemosensors are in progress.
Conflicts of interest
There are no conflicts to declare.Acknowledgements
The authors are grateful for the financial support from the National Natural Science Foundation of China (21702079 and 41867053), the “5511” Science and Technology Innovation Talent Project of Jiangxi Province (20165BCB18015), the key project of Natural Science Foundation of Jiangxi Province (20171ACB20025), the youth project of Natural Science Foundation of Jiangxi Province (20171BAB213004), the Young Talents Project of Jiangxi Science and Technology Normal University (2017QNBJRC005), and the Project of the Science Fund of Jiangxi Education Office (GJJ180593).Notes and references
- C. Zhang, S. Pu, Z. Sun, C. Fan and G. Liu, J. Phys. Chem. B, 2015, 119, 4673–4682 CrossRef CAS.
- H. N. Kim, W. X. Ren, J. S. Kim and J. Yoon, Chem. Soc. Rev., 2012, 41, 3210–3244 RSC.
- S. Xia, G. Liu and S. Pu, J. Mater. Chem. C, 2015, 3, 4023–4029 RSC.
- J. D. Demers, J. D. Blum, S. C. Brooks, P. M. Donovan, A. L. Riscassi, C. L. Miller, W. Zheng and B. Gu, Environ. Sci.: Processes Impacts, 2018, 20, 686–707 RSC.
- M. F. Wolfe, S. Schwarzbach and R. A. Sulalman, Environ. Toxicol. Chem., 1998, 17, 146–160 CrossRef CAS.
- X. Liu, X. Liu, M. Tao and W. Zhang, J. Mater. Chem. A, 2015, 3, 13254–13262 RSC.
- W. Luo, H. Jiang, K. Zhang, W. Liu, X. Tang, W. Dou, Z. Ju, Z. Li and W. Liu, J. Mater. Chem. B, 2015, 3, 3459–3464 RSC.
- S. Gupta and M. D. Milton, New J. Chem., 2018, 42, 2838–2849 RSC.
- W. Fang, G. Zhang, J. Chen, L. Kong, L. Yang, H. Bi and J. Yang, Sens. Actuators, B, 2016, 229, 338–346 CrossRef CAS.
- C. Li and S. Liu, J. Mater. Chem., 2010, 20, 10716–10723 RSC.
- O. Abollino, A. Giacomino, M. Malandrino, G. Piscionieri and E. Mentasti, Electroanalysis, 2008, 20, 75–83 CrossRef CAS.
- L. Yang, Y. Su, Y. Geng, H. Xiong, J. Han, Q. Fang and X. Song, Org. Biomol. Chem., 2018, 16, 5036–5042 RSC.
- Z. Ruan, Y. Shan, Y. Gong, C. Wang, F. Ye, Y. Qiu, Z. Liang and Z. Li, J. Mater. Chem. C, 2018, 6, 773–780 RSC.
- K. Wang, J. Li, S. Ji, L. Li, Z. Qiu, C. Pan, J. Zhang and Y. Huo, New J. Chem., 2018, 42, 13836–13846 RSC.
- S.-L. Pan, K. Li, L.-L. Li, M.-Y. Li, L. Shi, Y.-H. Liu and X.-Q. Yu, Chem. Commun., 2018, 54, 4955–4958 RSC.
- S. Chen, W. Wang, M. Yan, Q. Tu, S.-W. Chen, T. Li, M.-S. Yuan and J. Wang, Sens. Actuators, B, 2018, 255, 2086–2094 CrossRef CAS.
- Y. Chen, W. Zhang, Y. Cai, R. T. K. Kwok, Y. Hu, J. W. Y. Lam, X. Gu, Z. He, Z. Zhao, X. Zheng, B. Chen, C. Gui and B. Z. Tang, Chem. Sci., 2017, 8, 2047–2055 RSC.
- J. Luo, Z. Xie, J. W. Y. Lam, L. Cheng, H. Chen, C. Qiu, H. S. Kwok, X. Zhan, Y. Liu, D. Zhu and B. Z. Tang, Chem. Commun., 2001, 1740–1741 RSC.
- B.-K. An, S.-K. Kwon, S.-D. Jung and S. Y. Park, J. Am. Chem. Soc., 2002, 124, 14410–14415 CrossRef CAS.
- Z. Chen, J. Zhang, M. Song, J. Yin, G.-A. Yu and S. H. Liu, Chem. Commun., 2015, 51, 326–329 RSC.
- Z. Chen, Z. Li, F. Hu, G.-A. Yu, J. Yin and S. H. Liu, Dyes Pigm., 2016, 125, 169–178 CrossRef CAS.
- F. Zhao, Z. Chen, G. Liu, C. Fan and S. Pu, Tetrahedron Lett., 2018, 59, 836–840 CrossRef CAS.
- Y. Yin, F. Zhao, Z. Chen, G. Liu and S. Pu, Tetrahedron Lett., 2018, 59, 4416–4419 CrossRef CAS.
- Z. Chen, G. Liu, S. Pu and S. H. Liu, Dyes Pigm., 2017, 143, 409–415 CrossRef CAS.
- L. Yu, Z. Wu, G. Xie, C. Zhong, Z. Zhu, D. Ma and C. Yang, Chem. Commun., 2018, 54, 1379–1382 RSC.
- X. Ma, L. Hu, X. Han and J. Yin, Chin. Chem. Lett., 2018, 29, 1489–1492 CrossRef CAS.
- X. Han, Y. Liu, G. Liu, J. Luo, S. H. Liu, W. Zhao and J. Yin, Chem.–Asian J., 2019, 14, 890–895 CrossRef CAS.
- F. Hua and B. Liu, Org. Biomol. Chem., 2016, 14, 9931–9944 RSC.
- Z. Chen, J. Liang, Y. Nie, X. Xu, G.-A. Yu, J. Yin and S. H. Liu, Dalton Trans., 2015, 44, 17473–17477 RSC.
- X. Sun, A. Zebibula, X. Dong, G. Zhang, D. Zhang, J. Qian and S. He, ACS Appl. Mater. Interfaces, 2018, 10, 25037–25046 CrossRef CAS.
- D. Wu, A. C. Sedgwick, T. Gunnlaugsson, E. U. Akkaya, J. Yoon and T. D. James, Chem. Soc. Rev., 2017, 46, 7105–7123 RSC.
- J. Huang, N. Sun, P. Chen, R. Tang, Q. Li, D. Ma and Z. Li, Chem. Commun., 2014, 50, 2136–2138 RSC.
- F. Liu, J. Tu, X. Wang, J. Wang, Y. Gong, M. Han, X. Dang, Q. Liao, Q. Peng, Q. Li and Z. Li, Chem. Commun., 2018, 54, 5598–5601 RSC.
- S. Guo, C. Fan, G. Liu and S. Pu, RSC Adv., 2018, 8, 39854–39864 RSC.
- B. Wang and C. Wei, RSC Adv., 2018, 8, 22806–22812 RSC.
- Z. Chi, X. Zhang, B. Xu, X. Zhou, C. Ma, Y. Zhang, S. Liu and J. Xu, Chem. Soc. Rev., 2012, 41, 3878–3896 RSC.
- F. Chen, W. Zhang, Z. Liu, L. Meng, B. Bai, H. Wang and M. Li, RSC Adv., 2019, 9, 1–10 RSC.
- J. Liang, Z. Chen, L. Xu, J. Wang, J. Yin, G.-A. Yu, Z.-N. Chen and S. H. Liu, J. Mater. Chem. C, 2014, 2, 2243–2250 RSC.
- Z. Chen, Z. Li, L. Yang, J. Liang, J. Yin, G.-A. Yu and S. H. Liu, Dyes Pigm., 2015, 121, 170–177 CrossRef CAS.
- J. Liang, Z. Chen, J. Yin, G.-A. Yu and S. H. Liu, Chem. Commun., 2013, 49, 3567–3569 RSC.
- C. Gstrein, B. Zhang, M. A. Abdel-Rahman, O. Bertran, C. Alemán, G. Wegner and A. D. Schlüter, Chem. Sci., 2016, 7, 4644–4652 RSC.
- R. Tan, S. Wang, H. Lan and S. Xiao, Curr. Org. Chem., 2017, 21, 236–248 CrossRef CAS.
- R. Wang, Y. Sun, F. Zhang, M. Song, D. Tian and H. Li, Angew. Chem., Int. Ed., 2017, 56, 5294–5298 CrossRef CAS.
- W. Chen, Y. Pan, J. Chen, F. Ye, S. H. Liu and J. Yin, Chin. Chem. Lett., 2018, 29, 1429–1435 CrossRef CAS.
- J. Chen, D. Li, W. Chi, G. Liu, S. H. Liu, X. Liu, C. Zhang and J. Yin, Chem.–Eur. J., 2018, 24, 3671–3676 CrossRef CAS.
- J. Chen, F. Ye, Y. Lin, Z. Chen, S. Liu and J. Yin, Sci. China: Chem., 2019, 62, 440–450 CrossRef CAS.
- C. Karthik, V. Manjuladevi, R. K. Gupta and S. Kumar, RSC Adv., 2015, 5, 84592–84600 RSC.
- C. W. T. Leung, Y. Hong, S. Chen, E. Zhao, J. W. Y. Lam and B. Z. Tang, J. Am. Chem. Soc., 2013, 135, 62–65 CrossRef CAS.
- Z. Chen, D. Wu, X. Han, J. Liang, J. Yin, G.-A. Yu and S. H. Liu, Chem. Commun., 2014, 50, 11033–11035 RSC.
- Z. Chen, X. Han, J. Zhang, D. Wu, G.-A. Yu, J. Yin and S. H. Liu, RSC Adv., 2015, 5, 15341–15349 RSC.
- Z. Chen, G. Liu, S. Pu and S. H. Liu, Dyes Pigm., 2018, 152, 54–59 CrossRef CAS.
- J. Mei, N. L. C. Leung, R. T. K. Kwok, J. W. Y. Lam and B. Z. Tang, Chem. Rev., 2015, 115, 11718–11940 CrossRef CAS PubMed.
- Z. Xu, X. Huang, X. Han, D. Wu, B. Zhang, Y. Tan, M. Cao, S. H. Liu, J. Yin and J. Yoon, Chem, 2018, 4, 1609–1628 CAS.
Footnote |
| † Electronic supplementary information (ESI) available: Experimental section, NMR spectra, mass spectrum, and characterization data mentioned in the paper. See DOI: 10.1039/c9ra02119a |
| This journal is © The Royal Society of Chemistry 2019 |