 Open Access Article
Effects of magnesium hydroxide on the properties of starch/plant fiber composites with foam structure
Jin-Feng Cuiab,
Fang-Yi Li *ab,
Jian-Yong Li*ab,
Jian-Feng Liab,
Chuan-Wei Zhangab,
Shuai Chenab and
Xu Sunab
aKey Laboratory of High Efficiency and Clean Mechanical Manufacture (Ministry of Education), School of Mechanical Engineering, Shandong University, Jinan 250061, China. E-mail: lifangyi@sdu.edu.cn; ljy@sdu.edu.cn
bNational Demonstration Center for Experimental Mechanical Engineering Education, Shandong University, Jinan 250061, China
First published on 3rd June 2019
Abstract
In this study, magnesium hydroxide (MH) flame-retarded starch/plant fiber composites containing various MH contents (0%, 5%, 15%, 15%) were prepared and named as TF-MH0, TF-MH5, TF-MH10, TF-MH15. Thermal degradation, flame retardancy, mechanical and microscopic characteristics were discussed. The reduction in the maximum thermal degradation rate revealed that the addition of MH provided improvement in the thermal stability of the composite. The horizontal burning test and the limiting oxygen index analysis suggested enhancement in flame retardancy with increasing MH content. Moreover, the density of composites initially decreased and then increased as the MH content increased. The tensile strength was positively correlated with the density, whereas the cushioning performance was negatively correlated with the density. Microscopic analysis showed that there was an interfacial interaction between MH and thermoplastic starch, which not only improves the thermal stability, but also promotes bubble nucleation as a nucleating agent. The cells of TF-MH10 were uniform and dense, thus TF-MH10 had the best buffering performance. Furthermore, the cell structure of TF-MH15 was short in diameter, small in number, and large in skeleton thickness; therefore, TF-MH15 had the highest tensile strength.
1. Introduction
With the rapid development of the logistics industry, the use of petroleum-based cushioning packaging materials has gradually increased. However, the use of conventional petroleum based matrix can lead to environmental pollution and resource consumption.1 Considering the requirements of green environmental protection and sustainable development, replacement of petroleum derived polymers with bio-based ones has been one of the most important trends in the polymer field.2,3 Many biodegradable polymers, such as polylactic acid, polycaprolactone and other synthetic polymers, are available in the market, but with low cost-effectiveness.4 Meanwhile, starch, plant fiber, and other renewable natural polymer materials are widely found in nature. For example, sisal fiber is a hard fiber with the largest amount and the widest range in the world. It has the characteristics of toughness, wear resistance, salt and alkali resistance and corrosion resistance that has been widely used in various industries such as automobiles. Previous studies have found that sisal fibers can improve better the mechanical properties of composite compared to pulp fibers, straw fibers and wood fibers.5 Because they have excellent mechanical properties, are inexpensive and environmentally friendly, starch/plant fiber composites with foam structures have been widely investigated.6,7 The current research focused on the modification of starch and plant fibers to improve the compatibility and mechanical properties of composites. For example, native starch (NS) was added with a small molecule plasticizer, such as a polyol (glycerin and ethylene glycol) or an amide (formamide and acetamide), to destroy the hydrogen bond between the starch molecules to achieve plasticization, thereby improving the processing performance. The compatibility of plant fiber with starch can be improved by alkali treatment and silane coupling agent treatment.8–12 Starch/plant fiber composites are flammable materials; thus, their applications are limited. However, the thermal stability and flame retardancy of starch/plant fiber composites have not received considerable attention from researchers.13In recent years, the flame retardancy of composites has become more increasingly important, and flame retardants have been developed. According to different components, a flame retardant is divided into inorganic salt flame retardants, organic flame retardants, and mixed flame retardants. Halogenated flame retardants in organic flame retardants were the most effective and widely used flame retardants. However, their combustion releases toxic gases; therefore, the use of halogen-based flame retardants has been restricted. Conversely, inorganic flame retardant, a halogen-free flame retardant, is safe, nontoxic, and low-cost. For example, magnesium hydroxide (MH) is an additive flame retardant in a halogen-free flame retardant. The decomposition of MH is an endothermic reaction to slow down the heating rate; the water vapor generated by the decomposition reduces the surface oxygen concentration and increases the difficulty of combustion; the magnesium oxide produced from the decomposition forms a carbonized layer on the surface of the material to prevent the material from burning.14–17 In previous studies, the thermal stability and flame retardancy of basalt fiber reinforced starch-based/polyvinyl alcohol composites were effectively improved with the addition of MH.18,19 Stark et al. studied the flame retardancy of wood 4/polyethylene composites with different non-halogen flame retardants and found that MH and ammonium polyphosphate improved the fire resistance of the composite.20 Sain and Suppakarn et al. applied MH and zinc borate to improve the natural fiber/PP composite, which resulted in improved flame retardancy of the composite without sacrificing its mechanical properties.21,22 Moreover, the addition of MH has a certain effect on the mechanical properties of the composite. The flame retardancy of PA6/PP composites increased as the MH content increased, and the stiffness was also improved.23 MH is currently widely used in polymers as a flame retardant.
Starch/plant fiber composites with foam structure are mainly used in packaging; thus, the research on thermal stability, flame retardancy, and mechanical properties has certain guiding significance for its popularization and application. In the present study, we investigated the effects of different MH contents on the thermal stability, flame retardancy, and mechanical properties of starch/plant fiber composites with foam structure and thermoplastic starch (TPS), alkalized fiber and MH were selected as the main raw materials, and talc was used as the filler. For the composite preparation, the molding foaming technology was used under the action of a certain temperature and pressure. Thermogravimetric analysis (TGA), horizontal burning and limited oxygen index (LOI) test were performed. And the influence of MH addition on the thermal stability and combustion performance of the composite was investigated. Moreover, the relationship among tensile strength, cushioning performance, and density of composites was determined by mechanical tests.
2. Materials and methods
2.1 Materials
Core starch, the matrix and binder of composite materials, was purchased from Hebei Xingtai Jinsha River Face Industry Co., Ltd. Sisal fiber was purchased from Guangxi Longzhou Power Industry Co., Ltd., and used as reinforcement in the composite material; its treated average diameter and length were approximately 60 μm and 5 mm, respectively. Talc powder (400 mesh) was purchased from Tianjin Fuyu Fine Chemical Co., Ltd., and used as a filler to improve the mechanical properties of the composite materials. The foaming agent azodicarbonamide (AC) was purchased from Jinan Xinweiye Co., Ltd. MH (2000 mesh) was purchased from Wuxi Yatai United Chemical Co., Ltd., and used as a flame retardant for composites. Other reagents used were NaOH, ethylene glycol, glycerin, and distilled water.2.2 Preparation of starch/plant fiber composites
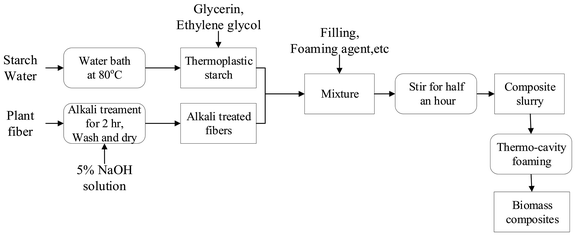
The original major distribution of starch/plant fiber composites is shown in Table 1. The preparation process could be divided into four stages: preparation of TPS, fiber alkalizing treatment, slurry preparation, and hot pressing and foaming. The specific process is shown in Fig. 1.| Materials | TPS | Sisal fiber | Talc powder | Foaming agent |
|---|---|---|---|---|
| Mass (g) | 100 | 30 | 10 | 1 |
(1) Preparation of TPS: NS and distilled water were mixed at a mass ratio of 1![[thin space (1/6-em)]](https://www.rsc.org/images/entities/char_2009.gif) :
:![[thin space (1/6-em)]](https://www.rsc.org/images/entities/char_2009.gif) 3, and heated in an 85 °C water bath. During churning, the mixture of the plasticizer glycerin and ethylene glycol was added to the gelatinized starch at a mass ratio of 10
3, and heated in an 85 °C water bath. During churning, the mixture of the plasticizer glycerin and ethylene glycol was added to the gelatinized starch at a mass ratio of 10![[thin space (1/6-em)]](https://www.rsc.org/images/entities/char_2009.gif) :
:![[thin space (1/6-em)]](https://www.rsc.org/images/entities/char_2009.gif) 2
2![[thin space (1/6-em)]](https://www.rsc.org/images/entities/char_2009.gif) :
:![[thin space (1/6-em)]](https://www.rsc.org/images/entities/char_2009.gif) 1 starch/glycerin/ethylene glycol.
1 starch/glycerin/ethylene glycol.
(2) Fiber alkalizing treatment: The sisal fiber was immersed in a 5% NaOH solution for 5 h; then repeatedly washed with distilled water to a pH of 7, and dried at 80 °C for 4 h.
(3) Slurry preparation: The prepared TPS and alkalized fiber were added into a blender, and different contents of flame-retardant MH (0%, 5%, 10%, and 15%) were added to obtain different mixtures of TPS and MH (TPS-MH0, TPS-MH5, TPS-MH10, and TPS-MH15, respectively). At the same time, the filler talc powder and the foaming agent AC were added, and the mixture was sufficiently stirred to uniformly distribute the slurry.
(4) Hot pressing and foaming: The temperature of the molding machine was set to 180–200 °C, and the pressure was 3 MPa. The four groups of slurry were weighed separately and placed into the mold. Then, the mold was closed for 10 min to obtain biomass composite materials, namely, TF-MH0, TF-MH5, TF-MH10, and TF-MH15.
2.3 Property tests of composites
 | (1) |
(2) LOI test: The LOI test was carried out to characterize the flame retardancy of the composite. The LOI value was measured at room temperature using an oxygen index instrument (M606B). The LOI value was defined as the minimum oxygen concentration in the oxygen/nitrogen mixture, which keeps the flame of the material burning for 3 minutes or consumes a sample length of 50 mm, with the sample placed in a vertical position.24 The LOI is expressed as:
 | (2) |
Apparent density calculation formula:
 | (3) |
(2) Tensile strength test: On the basis of the standard GB/T 9641-1988, the test specimen was placed on the universal testing machine (WDW-50E03050301) and stretched at a speed of 5 mm min−1 to obtain the maximum stress before fracture, that is, tensile strength.
(3) Experiments of cushioning property tests: The test specimen (100 mm × 100 mm × 25 mm, length × width × height) was placed on a universal testing machine (WDW-50E03050301) with reference to the standard GB/T 8168-2008. The pressure was compressed in the thickness direction of the sample at a speed of 12 mm min−1 until the sample was crushed, and the computer automatically recorded the displacement (X) and load (F) curves.
Compressive stress calculation formula:
 | (4) |
Compression strain formula:
 | (5) |
Energy absorption efficiency formula:
 | (6) |
(2) X-ray diffraction (XRD) analysis: To investigate the effect of plasticizer and MH on the crystallization type of starch, a mixture of TPS and different proportions of MH were uniformly mixed, dried and ground into a powder, and left for 30 days. Meanwhile, NS was selected as a comparative sample. The sample was screened with a 200 μm sieve, and 1 g of the sample was placed in a sample tank and compacted. Then, the surface of the sample was placed on the same level as the surface of the glass holder. The scanning rate of the X-ray diffractometer (Miniflex 600) was set to 5° min−1.
(3) Scanning electron microscopy (SEM) analysis: To investigate the effect of alkalization on the surface morphology of the fiber and the influence of different MH contents on the microstructure of the composite, the sample was observed by SEM (Phenom Pro). To improve conductivity, all samples were subjected to gold spray treatment.
3. Results and discussion
3.1 Thermal analysis
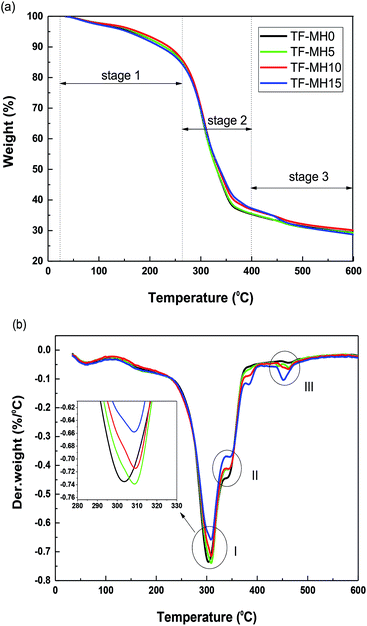
To investigate the temperature range of the safe use of starch/plant fiber composites and the effect of adding different MH contents on the thermal stability of the composite, TGA was performed in a nitrogen atmosphere. Fig. 2 shows the TG and DTG curves for the composites TF-MH0/5/10/15, and the related data are listed in Table 2.| Composites | T50% (°C) | W400°C (%) | W600°C (%) | Vmax (% °C−1) |
|---|---|---|---|---|
| TF-MH0 | 331.0 | 35.3 | 29.3 | 0.74 |
| TF-MH5 | 331.0 | 35.5 | 29.3 | 0.74 |
| TF-MH10 | 335.5 | 36.8 | 30.1 | 0.72 |
| TF-MH15 | 337.0 | 37.2 | 28.7 | 0.65 |
Fig. 2 shows that the thermal decomposition curves of composites with different MH contents were basically the same, and could be roughly divided into three stages. The mass loss in stage 1 (30–270 °C) was mainly the volatilization of water in the composite and the decomposition stage of the starch plasticizer.26 Stage 2 (270–400 °C) was the main stage of mass loss caused by the decomposition of starch and fiber, producing volatile substances, such as levoglucosan, furan, and furan derivatives.24 Finally, stage 3 (400–600 °C) was the carbonization stage. For TF-MH5/10/15 composites, stage 3 also included the MH decomposition stage. Therefore, the DTG curve of TF-MH5/10/15 had three distinct mass-change peaks, namely, starch decomposition peak (I), fiber decomposition peak (II), and MH decomposition peak (III). However, composite TF-MH0 contained only peaks I and II.
The temperature at which 50% mass loss occurred is called T50%. W400°C and W600°C indicate the thermal decomposition residual quality of the composite when the temperature was 400 °C and 600 °C, respectively, and Vmax is the maximum degradation rate of the composite. As the MH content in the composite increased, T50% and W400°C increased slightly, and Vmax and W600°C decreased gradually, indicating that MH affected the thermal stability of the composites.
The endothermic decomposition of MH decreased the temperature in the vicinity of the MH by releasing the structure water molecules and retarding the decomposition of the composites. Therefore, T50% and W400°C increased slightly, and Vmax gradually decreased.27 As the temperature increased, MH gradually decomposed. From decomposition peak III, the degradation rate of MH was proportional to its content; thus, W600°C was slightly reduced. Moreover, other mechanisms could also lead to a decrease in Vmax (e.g., the interfacial interaction between MH and starch inhibited the molecular motion of the composites), thereby improving the thermal stability of the composites.28
3.2 Flammability and fire properties
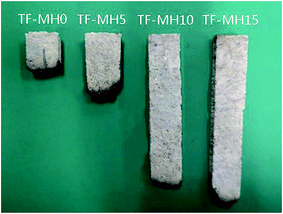
To evaluate the effect of different MH contents on the flame retardancy of composites, a horizontal burning test and LOI was carried out. The horizontal burning test is mainly used to evaluate the combustion range or the flame propagation rate. Table 3 shows the results of the burning time, rate, etc. of the samples, in which the calculation of the burning rate was not performed without passing the 100 mm mark, and on the contrary, the burning time and the burning length were not calculated. Fig. 3 shows the samples after the horizontal burning test.| Composites | Burning time (s) | Burning length (mm) | Burning rate (mm min−1) | Rating | LOI (%) |
|---|---|---|---|---|---|
| TF-MH0 | — | — | 29 | HB40 | 21.2 |
| TF-MH5 | — | — | 27 | HB40 | 21.2 |
| TF-MH10 | 68 | 16 | — | HB | 22.0 |
| TF-MH15 | 38 | 4 | — | HB | 23.8 |
According to the combustion results, the flame-retardant order of the composites was as follows: TF-MH15 > TF-MH10 > TF-MH5 > TF-MH0. All samples passed the 25 mm mark, but only the TF-MH0 and TF-MH5 composites passed the 100 mm mark. The burning rate, burning time, and burning length of the sample decreased as the MH content increased; hence, the flame retardancy of the composite was improved. The flame retardancy mechanism was mainly because the high-temperature endothermic reaction of MH released a large amount of water vapor, and diluted the combustible concentration in the gas-phase combustion zone and the generated high temperature resistant magnesium oxide covered the surface of the composite to form a protective film to prevent combustion.18
To further evaluate the flame retardancy of the composite, an LOI test was performed and the results were shown in Table 3. A high LOI value means that the material is not easily combusted, and a low oxygen index means that it is easy to burn. It is generally believed that an oxygen index of less than 22% belongs to an easily combustible material, 22% to 27% is a combustible material, and more than 27% is a non-combustible material. According to Table 3, as the MH content increased, the oxygen index of the composite material gradually increased, and changed from an easily flammable material to a combustible material. There was no doubt that the addition of MH increased the flame retardancy of the composite.
3.3 Mechanical property analysis of the composites
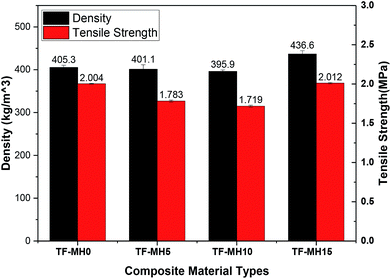
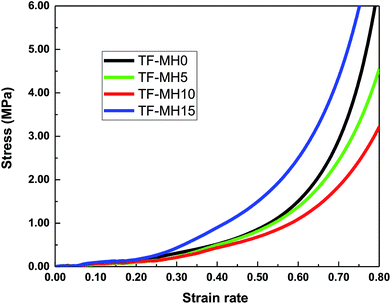
Fig. 4 shows the test results of the composite density and tensile strength. With the increase of MH addition, the apparent density of composites initially decreased and then increased, counting for 405.3 kg m−3, 401.1 kg m−3, 395.9 kg m−3 and 436.6 kg m−3. The lowest was added with 10% MH, and the highest was added with 15% MH. The tensile strength was positively correlated with density; the highest was 2.012 MPa, and the lowest was 1.719 MPa.29Cushioning performance is one of the primary considerations for packaging materials. It is generally expressed by the energy absorption efficiency of the material. The higher the energy absorption efficiency value, the better the material cushioning performance. Therefore, the effect of adding different MH contents on the buffering properties of starch/plant fiber composites should be investigated.30 According to the mechanical properties, cushioning materials can be divided into linear materials, piecewise linear materials, tangential elastic materials, and cubic functional elastic materials et al. Fig. 5 shows the stress–strain curve of different composite materials. The initial stage increased with strain, and the stress slightly changed. This stage was the yielding platform and the main stage of energy absorption. As the compression continued, the strain increased, and the stress rose rapidly. This stage was the compaction zone, so the starch/plant fiber composite was a tangential elastic material.
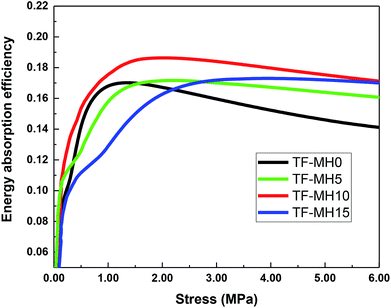
Fig. 5 and 6 present the stress–strain curve and stress-energy absorption efficiency curve obtained by static compression test. In the initial stage, as the stress increased, the energy absorption efficiency increased rapidly and then gradually stabilized. Under different stress conditions, the order of energy absorption efficiency changed slightly, but the energy absorption efficiency of TF-MH10 was constantly the highest and the maximum energy absorption efficiency was increased by 12%. Therefore, when 10% MH was added, the starch/plant fiber composite had the best cushioning property.
3.4 Mechanism analysis of property changes in composites
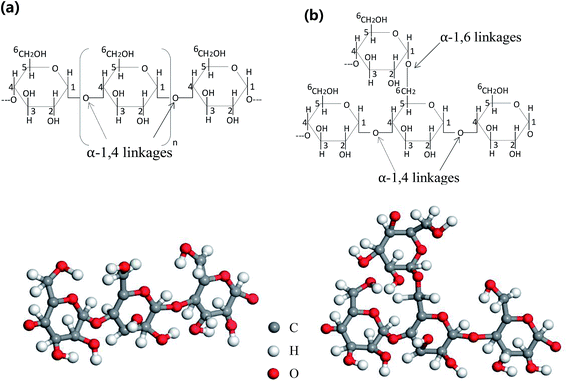
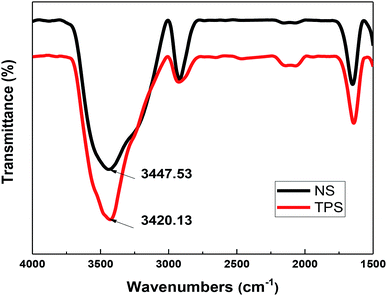
NS is a semi-crystalline material composed of amylose and amylopectin, and 70% of starch granules are in an amorphous state. Most of the amylose is a linear molecule linked by α-1,4-glycosidic bonds. The amylopectin has an α-1,4-glycosidic bond as the main chain linkage and an α-1,6-glycosidic bond as a linkage to link the branch and the backbone.31 Fig. 7 shows the chemical structure of amylose and amylopectin linkages. A large number of hydroxyl groups are present in the molecule, and the interaction between starch molecules is inhibited by hydrogen bond interaction, resulting in poor processability of NS.32Fig. 8 depicts the FT-IR spectra of NS and TPS, and the spectrum was basically consistent in the range of 1500–4000 cm−1. The absorption peak of the hydroxyl group (O–H) was mainly located near 3300–3500 cm−1. However, after plastic modification, the peak of the hydroxyl group (O–H) was reduced from 3447.53 cm−1 to 3420.13 cm−1, and the band was wider. According to Finch et al., the stronger and more stable the hydrogen bond, the more the hydroxyl (O–H) stretching vibration peak moves toward the low frequency; thus, the hydroxyl group (O–H) in the plasticizers, namely, glycerin and ethylene glycol, formed a more stable hydrogen bond with starch.33,34 FT-IR analysis revealed that plasticizing modification reduced the strong interaction between starch molecules, improved the plasticity of starch, and made TPS more tightly combined with MH and sisal fiber, thereby improving the mechanical performance and thermal stability of starch/plant fiber composites.35,36
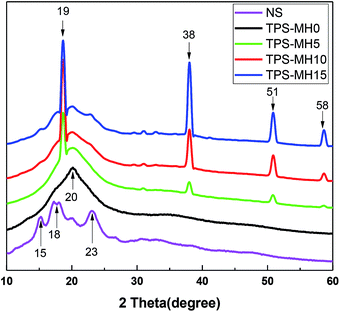
Fig. 9 illustrates the XRD pattern of NS, TPS, and TPS with different amounts of MH mixture, and Table 4 shows the results of analysis using MDI Jade software. During the modification of starch plasticization, the plasticizer entered the interior of the starch molecule, destroying the intramolecular and intermolecular hydrogen bonds and crystal structure of starch, and increasing the amount of free amylose. After a certain storage time, the water/polyol TPS recrystallized to form a single-helical v-type crystal.37–39 The recrystallization process of starch was also called retrogradation, which seriously affected the mechanical properties and service life of the final product.40
| NS | TPS-0 | TPS-5 | TPS-10 | TPS-15 | |
|---|---|---|---|---|---|
| Crystallinity (%) | 26.41 | 23.33 | 24.84 | 25.97 | 27.39 |
| Type 1 (%) | 26.41 | 23.33 | 19.80 | 11.19 | 4.69 |
| Type 2 (%) | 0 | 0 | 5.04 | 14.78 | 22.7 |
As show in Fig. 9, NS had a typical α-type crystal peak (2θ = 15°, 18°, 23°), and the α-type crystal was a double-helical structure with tight molecular.41 The XRD pattern of TPS-MH0 showed a distinct v-type crystallization peak (2θ = 20°), indicating that the addition of plasticizer destroyed the internal structure of the starch and verified the correctness of the infrared spectrum analysis.42 The dihydroxy inorganic compound MH was added, and a distinct MH diffraction peak appeared in the diffraction pattern (2θ = 19°, 38°, 51°, 58°). As the MH content increased, the diffraction peak shape did not change, but the crystallinity (Type 1) caused by starch diffraction decreased. The crystallinity (Type 2) caused by MH diffraction was positively correlated with the MH content. Hence, MH was uniformly dispersed in TPS and had good interfacial compatibility with TPS, thereby inhibiting molecular chain motion and improving the thermal stability of the composite. This finding was consistent with the TGA results.27,43
Fig. 10(a) and (b) illustrate the microstructure of untreated sisal fibers and alkalized fibers. The untreated plant fiber was covered with a layer of pectin and hemicellulose, the surface was smooth, and the fiber diameter was large. The main disadvantage of the composite reinforcement was that the fiber had poor compatibility with the matrix. Alkalinization removed surface impurities from plant fibers while increasing the amount of free hydroxyl groups (O–H) in the fiber and hydrogen bonding with the free hydroxyl group (O–H) in TPS.44 Eqn (6) and (7) show a reaction between the aqueous solution of NaOH and the fiber to promote the ionization of the cellulose hydroxyl group into an alkoxide, and the negatively charged Fiber –O− had a strong attraction to the free hydroxyl group in TPS starch, thereby forming strong hydrogen bond.45,46 As show in Fig. 10(b), the surface of the alkalized fiber was rough, and many small bundle branches were present. The fiber diameter was significantly reduced, and the aspect ratio was increased, thereby increasing the bonding area between the fiber and the matrix and finally improving the mechanical properties of the composite.47,48
| Fiber–OH + NaOH → fiber–O–Na + H2O | (7) |
 | (8) |
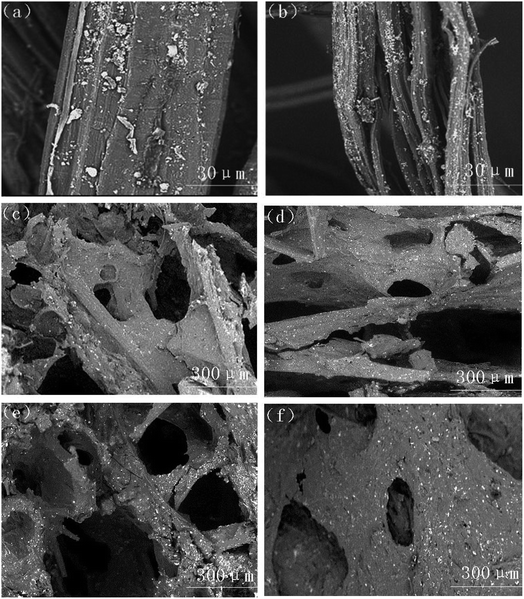 | ||
| Fig. 10 SEM images of (a) untreated fiber, (b) alkali-treated fiber, (c) TPS-MH0, (d) TPS-MH5, (e) TPS-MH10, and (f) TPS-MH15. | ||
Fig. 10(c)–(f) show the microscopic cell structure of the composites when different MH contents were added. Clearly, the addition of 5% MH had no significant effect on the structure of the microscopic cells of the composite. When 10% MH was added, the cell structure was more uniform and dense because MH acted as a nucleation point in the initial stage of foaming. However, when 15% MH was added, the cell structure was short in diameter, small in number, and large in skeleton thickness, mainly because the increase of MH content increased the viscosity of the composite slurry and forming a cell structure was difficult. Therefore, TH-MH15 had the highest tensile strength, and TF-MH10 had the best buffering performance, which was consistent with the mechanical property test results.
4. Conclusions
The starch/plant fiber composites with foam structure were prepared by using the molding foaming technology under the action of a certain temperature and pressure; TPS, alkalized fiber and MH were used as the main raw materials. The main conclusions of the study were as follows.(1) The thermal stability of the composites improved as the MH content increased. When 15% MH was added, the maximum thermal decomposition rate was reduced by 12%. On the one hand, the endothermic reaction of MH reduced the surrounding temperature and delayed the decomposition of the composite; on the other hand, the plasticization modification of starch destroyed the crystal structure of starch and improved the interfacial interaction with MH, thereby inhibiting the molecular motion of the composite to a certain extent and improving the thermal stability.
(2) The flame retardancy of the composites increased as the MH content increased. The high-temperature endothermic reaction of MH released a large amount of water vapor and diluted the combustible concentration in the gas-phase combustion zone. Moreover, the generated high-temperature-resistant magnesium oxide covered the surface of the composites to form a protective film, thereby preventing the transfer of heat and flame gas. Therefore, the addition of MH increased the horizontal burning rating and LOI value of the composite.
(3) The density of the composite initially decreased and then increased as the MH content increased. It followed the order: TF-MH15 > TF-MH0 > TF-MH5 > TF-MH10. The minimum density was 395.9 kg m−3, and the maximum density was 436.6 kg m−3. The free energy that foaming need to overcome was reduced by the anisotropy of MH and matrix, while MH acted as a nucleating agent to promote the formation of bubble nuclei; but when the content of MH passed 10%, the viscosity of the slurry increased, which hindered the growth of the cells and thus the density increased. The tensile strength was positively correlated with density, the highest was 2.012 MPa, and the lowest was 1.719 MPa. Meanwhile, the cushioning performance was negatively correlated with the density; when 10% MH was added, the maximum energy absorption efficiency was increased by 12%.
Conflicts of interest
There are no conflicts of interest to declare.Acknowledgements
This work was financially supported by the National Natural Science Foundation of China (No. 51775318) and the Interdisciplinary Cultivation Project of Shandong University (No. 2018JC043). We would like to thank our colleagues from Shandong University.References
- M. M. Reddy, S. Vivekanandhan and M. Misra, et al., Prog. Polym. Sci., 2013, 38, 1653–1689 CrossRef CAS.
- M. Mihai, M. A. Huneault and B. D. Favis, et al., Macromol. Biosci., 2010, 7, 907–920 CrossRef PubMed.
- A. Lopez-Gil, M. A. Rodriguez-Perez and J. A. De Saja, et al., Polim.: Cienc. Tecnol., 2014, 24, 36–42 CrossRef.
- B. Katalin, S. Beata and W.-P. Maria, et al., Polym. Bull., 2013, 58, 385–394 Search PubMed.
- C. Wang, F. Li and L. Wang, et al., RSC Adv., 2015, 5, 49824–49830 RSC.
- O. Faruk, A. K. Bledzki and H. P. Fink, et al., Prog. Polym. Sci., 2012, 37, 1552–1596 CrossRef CAS.
- B. Khan, B. K. N. Muhammad and G. Samin, et al., J. Food Process Eng., 2016, 40, e12447 CrossRef.
- D. Le Corre, J. Bras and A. Dufresne, Biomacromolecules, 2010, 11, 1139–1153 CrossRef CAS PubMed.
- H. Liu, F. Xie and L. Yu, et al., Prog. Polym. Sci., 2009, 34, 1348–1368 CrossRef CAS.
- P. Balakrishnan, M. S. Sreekala and M. Kunaver, et al., Carbohydr. Polym., 2017, 169, 176–188 CrossRef CAS PubMed.
- C. S. Wu, F. S. Yen and C. Y. Wang, Polym. Bull., 2011, 67, 1605 CrossRef CAS.
- T. A. Mobarak, M. F. Mina and M. A. Gafur, et al., Fibers Polym., 2018, 19, 31–40 CrossRef.
- N. Masina, Y. E. Choonaran and P. Kumar, et al., Carbohydr. Polym., 2017, 157, 1226–1236 CrossRef CAS PubMed.
- G. Koronis, A. Silva and M. Foutul, Composites, Part B, 2013, 44, 120–127 CrossRef CAS.
- P. R. Hornsby and C. L. Watson, Polym. Degrad. Stab., 1990, 30, 73–87 CrossRef CAS.
- R. N. Rothon and P. R. Hornsby, Polym. Degrad. Stab., 1996, 54, 383–385 CrossRef CAS.
- P. R. Hornsby, J. Wang and R. Rothon, et al., Polym. Degrad. Stab., 1996, 51, 235–249 CrossRef CAS.
- H. Balakrishnan, A. Hassan and N. A. Isitman, et al., Polym. Degrad. Stab., 2012, 97, 1447–1457 CrossRef CAS.
- T. WittekI and T. Tanimoto, eXPRESS Polym. Lett., 2008, 2, 810–822 CrossRef.
- N. M. Stark, R. H. White and S. A. Mueller, et al., Polym. Degrad. Stab., 2010, 95, 1903–1910 CrossRef CAS.
- M. Sain, S. H. Park and F. Suhara, et al., Polym. Degrad. Stab., 2004, 83, 363–367 CrossRef CAS.
- N. Suppakarn and K. Jarukumjorn, Composites, Part B, 2009, 40, 613–618 CrossRef.
- M. Wang, X. W. Han and L. Liu, et al., Ind. Eng. Chem. Res., 2015, 54, 12805–12812 CrossRef CAS.
- M. N. Prabhakar, A. U. Rehman Shah and J. I. Song, Carbohydr. Polym., 2017, 168, 201–211 CrossRef CAS PubMed.
- Y. Arao, S. Nakamura and T. Yuta, et al., Polym. Degrad. Stab., 2013, 100(1), 79–85 Search PubMed.
- G. Abbas, T. Taghi and A. Alireza, et al., Carbohydr. Polym., 2018, 197, 305–311 CrossRef PubMed.
- F. K. V. Moreira, D. C. A. Pedro and G. M. Glenn, et al., Carbohydr. Polym., 2013, 92, 1743–1751 CrossRef CAS PubMed.
- S. K. Swain, S. Barik and G. C. Pradhan, et al., Polym.-Plast. Technol. Eng., 2017, 1–7 CAS.
- A. Michrafy, M. Michrafy and M. S. Kadiri, et al., Int. J. Pharm., 2007, 333, 118–126 CrossRef CAS PubMed.
- Z. W. Wang and X. F. Li, Mater. Des., 2014, 57, 598–607 CrossRef.
- A. Mohammadi Nafchi, M. Moradpour and M. Saeidi, et al., Starch/Staerke, 2013, 65, 61–72 CrossRef CAS.
- C. W. Zhang, F. Y. Li and J. F. Li, et al., Mater. Des., 2017, 120, 222–229 CrossRef CAS.
- X. F. Ma, J. G. Yu and J. J. Wan, Carbohydr. Polym., 2006, 64, 267–273 CrossRef CAS.
- A. Finch, Chemical applications of far infrared spectroscopy, Academic Press, 1970 Search PubMed.
- C. W. Zhang, F. Y. Li and J. F. Li, et al., J. Cleaner Prod., 2018, 185, 357–365 CrossRef CAS.
- S. Chen, F. Y. Li and J. F. Li, et al., RSC Adv., 2018, 8, 12400–12408 RSC.
- J. J. G. V. Soest and J. F. G. Vliegenthart, Trends Biotechnol., 1997, 15, 208 CrossRef PubMed.
- D. Paiva, A. M. Pereira and A. L. Pires, et al., Polymers, 2018, 10, 1–14 CrossRef PubMed.
- H. Schmitt, A. Guidez and K. Prashantha, et al., Carbohydr. Polym., 2015, 115, 364–372 CrossRef CAS PubMed.
- J. Delville, C. Joly and P. Dole, et al., Carbohydr. Polym., 2003, 53, 373–381 CrossRef CAS.
- T. A. Waigh, A. M. Donald and F. Heidelbach, et al., Biopolymers, 1999, 49, 91–105 CrossRef CAS.
- S. H. Clasen, M. Carmen, O. Müller and A. L. Parize, et al., Carbohydr. Polym., 2018, 180, 348–353 CrossRef CAS PubMed.
- X. Z. Mo, Y. X. Zhong and X. Qi, et al., Adv. Mater. Res., 2011, 221, 278 CAS.
- A. K. Mohanty, M. Misra and L. T. Drzal, Compos. Interfaces, 2001, 8, 313–343 CrossRef CAS.
- X. Li, L. G. Tabil and S. Panigrahi, J. Polym. Environ., 2007, 15, 25–33 CrossRef.
- Q. Xie, F. Li and J. Li, et al., Carbohydr. Polym., 2018, 189, 56–64 CrossRef CAS PubMed.
- T. T. L. Doan, H. Brodowsky and E. MäDer, Compos. Sci. Technol., 2012, 72, 1160–1166 CrossRef CAS.
- L. Y. Mwaikambo and M. P. Ansell, J. Appl. Polym. Sci., 2002, 84, 13 CrossRef.
| This journal is © The Royal Society of Chemistry 2019 |

