 Open Access Article
Adsorption–desorption behavior of the hydrophobically associating copolymer AM/APEG/C-18/SSS
Hongping Quan ab,
Qiangying Luab,
Zhonghao Chenab,
Zhiyu Huang*ab and
Qingying Jiangab
aCollege of Chemistry and Chemical Engineering, Southwest Petroleum University, Chengdu 610500, PR China
bOil & Gas Field Applied Chemistry Key Laboratory of Sichuan Province, Chengdu 610500, PR China
First published on 18th April 2019
Abstract
In this study, acrylamide (AM), allyl polyethylene-1000 (APEG), octadecyl dimethyl allyl ammonium chloride (DMDAAC-18), and sodium styrene sulfonate (SSS) were chosen to synthesize a quadripolymer (HPAAT) in which a hydrophobic association exists between the molecules. The critical concentration of the hydrophobic association was determined using fluorescence spectrophotometry. Furthermore, HPAAT formed films by adsorbing onto a carbonate rock surface. The molecular structure of HPAAT was characterized using Fourier-transform infrared spectroscopy and 1H-NMR spectroscopy, the results showed that the obtained product was consistent with the target product. The intrinsic viscosity was determined using an Ubbelohde viscometer. The molecular weight and dispersion exponent of HPAAT were determined using gel permeation chromatography. Addition of HPAAT into 20% HCl decreased the reaction rate of the acid rock obviously, even at a low viscosity. Variation of the reaction rate with time with different amounts of HPAAT was investigated using the volume of carbon dioxide gas produced. The adsorption and desorption of HPAAT on a carbonate rock surface were demonstrated using infrared spectroscopy analysis, scanning electron microscopy and ultraviolet spectrophotometry.
1 Introduction
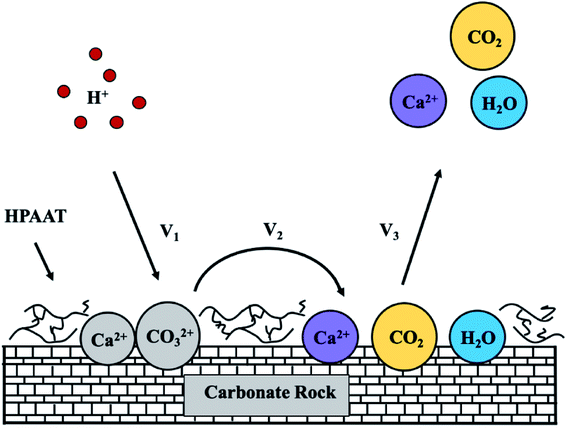
Acidification is the main means of increasing oil and gas production. The injected acid fully covers the entire layer to be processed, and this is the key to the success of the acidification operation. However, when the acid solution is injected into the stratum, the fast reaction rate between the hydrochloric acid and carbonates means that the acid cannot penetrate into the deepest places in the carbonate reservoir. Priority is given to the formation of fractures with high permeability, while a layer with low permeability cannot be treated. The reason for the low permeability of the reservoir could be due to two reasons: one is that the reservoir is a naturally low permeability reservoir (II reservoir); the second is that the permeability of oil reservoirs are reduced owing to the pollution close to the well in the process of oil and gas development.1–4 These unprocessed segments mean that production will be reduced and a certain amount of the reserves will be lost. Therefore, retarded acid technology is applied to give deep acidification in order to improve the effect of acid treatment, see Fig. 1.5–9There are two ways to increase the retardation rate: one is to reduce the diffusion rate of the hydrogen ions by increasing the viscosity of acids.6 and the other is to separate the acid solution from the rock by forming a film on the rock surface, thus reducing the reaction rate between the acid and the rock.10 Recently, gelled acids have effectively improved the permeability of reservoirs as retarded acids have attracted the interest of many researchers. A gelled acid is usually composed of HCl as the base–acid and a polymer gelling agent as an addictive. The gelled acid reduces the diffusion rate of H+ to the rock surface owing to its high viscosity and reduced filtration. However, it is difficult to penetrate into the deeper positions in the reservoir and flow back owing to the high viscosity. In this study, the acid rock reaction was slowed down mainly by forming a film on the surface of the rock.
Polymers are widely used, to date, various polymers have been successfully fabricated into nanofibrous membranes via electrospinning and have been evaluated for air filtration.11 Polymeric materials have contributed significantly to the development and improvement of medical devices and systems. Novel designed polymers using ion-beam modification methods have been studied to improve blood and tissue compatibility.12 The hydrophobic associative polymer can form a network structure by inter-molecule association in a dilute solution at a certain concentration, which can cause an increase in the elastic and viscous modulus of the polymer acid solution and helps to slow down the reaction between the acid and the rock.13–20 In oilfield applications, the hydrophobic associating polymer is adsorbed on the reservoir to allow the interaction of the polymer and the reservoir, which may have some beneficial effects on the reservoir.21 The ability of the hydrophobic associative polymer adsorbed onto rock surfaces has attracted the attention of many researchers. However, research into the adsorption behavior of hydrophobic associative polymers and the adsorption capacity and adsorption rate have not been fully explored.22–24
Owing to the aforementioned problems, it is particularly important to study retarded acids that have a low viscosity and good adsorption. In our study, acrylamide (AM), allyl polyethylene-1000 (APEG), octadecyl dimethyl allyl ammonium chloride (DMDAAC-18), and sodium styrene sulfonate (SSS) were chosen to synthesize a type of hydrophobic association polymer (HPAAT), the copolymer could form a thin film by adsorbing on the rock when used as a retarded additive. The aim of the study was to research the adsorption and desorption behavior in the acid rock reaction, including the effect of the addition of the polymer.
2 Experimental
2.1 Materials
The AM, SSS, anhydrous ethanol, calcium carbonate (teaching reagent) and hydrochloric acid were obtained from Kelong, Chengdu, China and were all analytical-reagent grade chemicals. APEG-1000 was purchased from the Haian petrochemical plant, Jiangsu, China. The DMAAC-18 was of an industrial grade and was obtained from Jiangsu Fumiao Chemical Reagent Factory (China). Azodiisobutyronitrile hydrochloride (V50) was purchased from the Ipres Technology Company (China).2.2 Synthesis
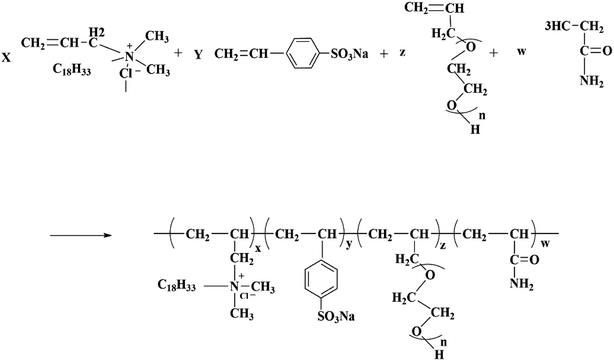
First, DMAAC-18 (0.56 g) was dissolved in 22.12 g of distilled water in a three-necked flask, and then AM (6.82 g), APEG-1000 (2.0 g) and SSS (0.103 g) were added into the solution, the solution was stirred until these were completely dissolved. Next, the initiator V50 (0.0113 g) was added into the solution, and was reacted for 5 h at 50 °C. Finally, the product was cut up and washed several times with ethanol. After washing, the product was dried at 50 °C to a constant weight, and the polymer was obtained. The molecular structure of HPAAT is shown in Scheme 1.2.3 Characterization and experimental measurements
![[thin space (1/6-em)]](https://www.rsc.org/images/entities/char_2009.gif) :
:![[thin space (1/6-em)]](https://www.rsc.org/images/entities/char_2009.gif) 6.5, using the same mobile phase), and filtered using a 0.45 μm filter membrane. These measurements were performed at room temperature (23 °C) for 90 min.
6.5, using the same mobile phase), and filtered using a 0.45 μm filter membrane. These measurements were performed at room temperature (23 °C) for 90 min.The HPAAT acid was placed at room temperature for 36 h as a backup. A fluorescence spectrophotometer was used to scan the pyrene solution. The strength of the first shock peak (373 nm) of the pyrene solution is represented as I1, and I3 represents the strength of the third shock peak (384 nm). The fluorescence test conditions used were: a fluorescence excitation wavelength of 335 nm, the excitation and emission slits were both 2.5 nm, the scanning range used was 350–550 nm, the scanning speed was 240 nm min−1, and the voltage was 700 V.
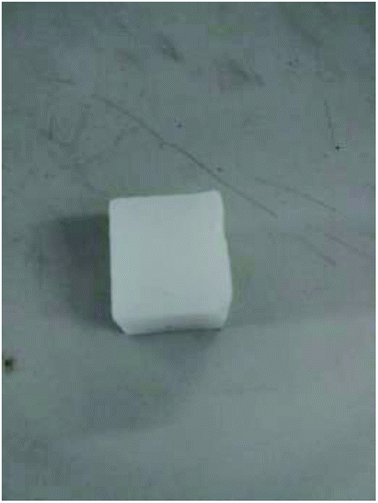
The blank experiment was performed in the same way as the above described evaluation method. The carbonate sample is shown in Fig. 2 and the calculation formula of retarding rate is as follows.
| Δm = m1 − m2 | (1) |
| Va = Δm × 1000/(S × Δt) | (2) |
 | (3) |
 | (5) |
3 Results and discussion
3.1 Characterization of the polymer
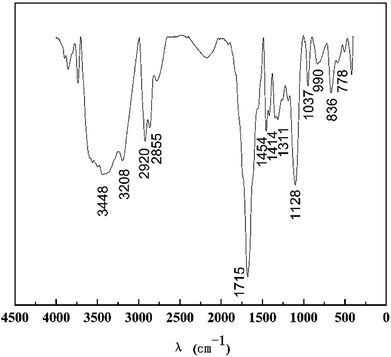
It can be seen from Fig. 3 that the characteristic absorption bands at 1715 cm−1 and 3448 cm−1 can be assigned to the C![[double bond, length as m-dash]](https://www.rsc.org/images/entities/char_e001.gif) O and N–H stretching vibrations of the amide groups of AM. The peaks of the benzene ring at 778 cm−1 and S
O and N–H stretching vibrations of the amide groups of AM. The peaks of the benzene ring at 778 cm−1 and S![[double bond, length as m-dash]](https://www.rsc.org/images/entities/char_e001.gif) O at 1414 cm−1 confirm the existence of SSS. The peaks at 2920 and 2855 cm−1 are ascribed to –CH3 and –CH2–. The peak at 3208 cm−1 is the stretching vibration peak of O–H. The peaks at 1454 cm−1 are due to the stretching vibrations of the C–H. The peak at 1128 cm−1 illustrates that the C–O–C stretching vibrations from APEG exist in HPAAT. Furthermore, 1311 cm−1 is the stretching vibration peak of the C–N. This result is consistent with the molecular design structure.
O at 1414 cm−1 confirm the existence of SSS. The peaks at 2920 and 2855 cm−1 are ascribed to –CH3 and –CH2–. The peak at 3208 cm−1 is the stretching vibration peak of O–H. The peaks at 1454 cm−1 are due to the stretching vibrations of the C–H. The peak at 1128 cm−1 illustrates that the C–O–C stretching vibrations from APEG exist in HPAAT. Furthermore, 1311 cm−1 is the stretching vibration peak of the C–N. This result is consistent with the molecular design structure.
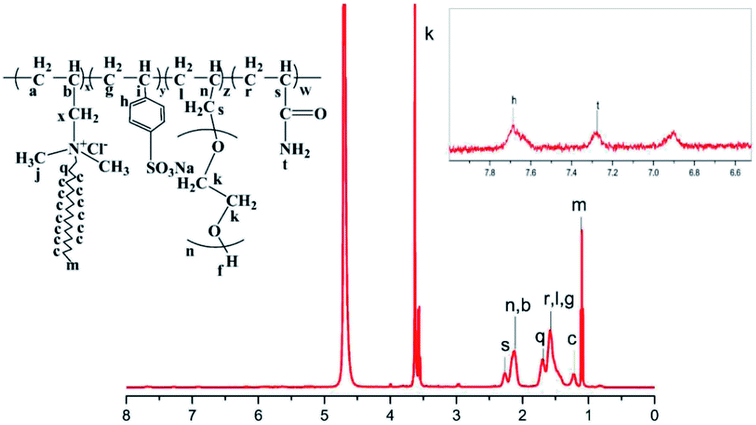
Fig. 4 shows the 1H-NMR (400 MHz, D2O) diagram of HPAAT, in which the chemical shift of the hydrogen spectrum of HPAAT is as follows: 1.09(m, –CH3), 1.25–1.36 (c, –(CH2)15–), 1.62 (r, l, g, –CH2–CH–C–O–NH2, –CH2–CH–CH2–, –CH2–CH–C), 1.71 (q, –N–CH2–CH2–), 2.14 (n, b, –CH–CH2–O–, –CH–CH2–N), 2.26 (s, –CH–C–O–NH2), 3.22 (z, x, –n–CH2–, CH2–N–), 3.30 (j, –N–CH3), 3.63 (k, –CH2–O–, –CH2–CH2–O–), 7.21 (t, –NH2), 7.67 (h, –CH–CH–C). The results of the 1H-NMR analysis were combined with the FTIR spectra shown in Fig. 3, we concluded that the obtained product was basically consistent with the designed molecule, which has been synthesized successfully.
The GPC data for HPAAT are shown in Table 1.
| Mn | Mw | MP | Mz | Mz + 1 | Polydispersity |
|---|---|---|---|---|---|
| 1.0 × 10⁵ | 2.7 × 10⁵ | 6.8 × 10⁴ | 5.4 × 10⁵ | 8.3 × 10⁵ | 2.62 |
The results showed that the average weight of the polymer was lower.
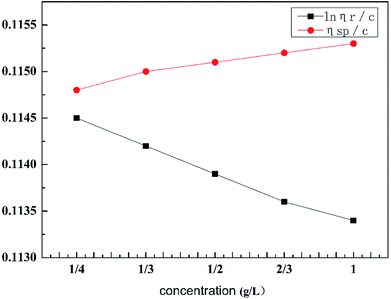
As can be seen from Table 2, the intrinsic viscosity of the retarded acid was 114.65 mL g−1. The intrinsic viscosity was determined using a Ubbelohde viscometer and the viscosity curve for HPAAT is shown in Fig. 5.
| Curve | Fitting equation | Intrinsic viscosity number [η] (mL g−1) |
|---|---|---|
ln![[thin space (1/6-em)]](https://www.rsc.org/images/entities/char_2009.gif) ηr/c ηr/c |
y = −0.0014x + 0.1147 | 114.65 |
| ηsp/c | y = 0.0006x + 0.1148 |
3.2 Critical concentration point of the hydrophobic association
As can be seen from Table 3, the reduced viscosity of the polymer acid solution is consistent with the results of the GPC tested previously. When the concentration increased from 0.7 to 0.8 wt%, the initial viscosity showed a significant increase that was determined by the apparent viscosity. The sudden increase in viscosity was due to the hydrophobic association, and the predominate intramolecular aggregation turned into predominately intermolecular aggregation.| Mass concentration (wt%) | Initial viscosity (mPa s) | Viscosity of residual acid (mPa s) |
|---|---|---|
| 0.5 | 6 | 3 |
| 0.6 | 9 | 3 |
| 0.7 | 9 | 3 |
| 0.8 | 21 | 6 |
| 0.9 | 27 | 6 |
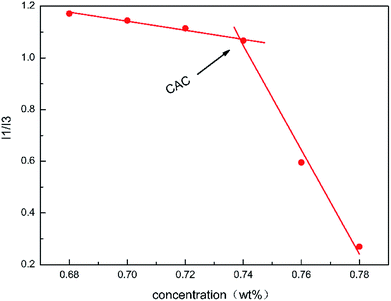
The apparent viscosity can reflect the hydrophobic correlation effect on the macro level, whereas the hydrophobic association properties of the polymer at a molecular level can be revealed using fluorometry. Nonpolar pyrene can be used as a fluorescence probe to reflect the intensity of the hydrophobic association effect, as nonpolar pyrene can solubilize into the hydrophobic region. According to the ratio of the fluorescence absorption intensity at 373 nm compared to that at 384 nm (I1/I3), the solubility of pyrene can be concluded. The more polar the microenvironment around the pyrene probe, the higher the value of I1/I3. When the intramolecular aggregation turns predominately into intermolecular aggregation, the value of I1/I3 shows an obvious decrease.
Fig. 6 shows the value of I1/I3 at different mass concentrations of the polymer acid solution. When the concentration surpassed 0.74 wt%, the value of I1/I3 fell abruptly, which was therefore considered to be the critical concentration of the hydrophobic association. To some extent, this is consistent with the results previously determined using the apparent viscosity. This result indicated that when the concentration of the polymer acid solution was larger than 0.74 wt% many hydrophobic areas were formed in the solution, while the polarity of the surrounding microenvironment was weakened.
3.3 Retarding capability test
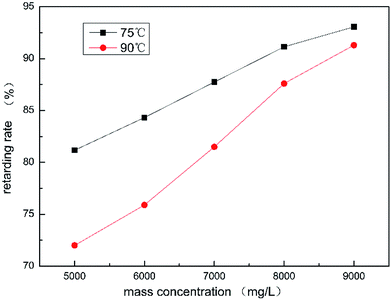
It can be seen from Fig. 7 that as the concentration of HPAAT increased, the retarding rate also increased. When the concentration of HPAAT ranges from 7000 to 8000 mg L−1, the increased trend in the retarding rate is basically stable, which is about 5%.In summary, it is not the hydrophobic association that effects the retarding rate of the polymer acid solution. The reason may be that the polymer adsorbs onto the carbonate surface during the acid–rock reaction.
3.4 Determination of the reaction rate
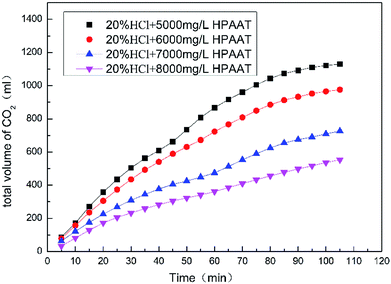
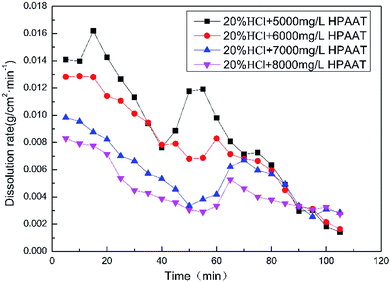
As can be seen from Fig. 8, with the increasing polymer concentration, the amount of carbon dioxide produced during the acid–rock reaction decreased. As shown in Fig. 9, as the time increased, the rate of the reaction first decreased and later increased. The results showed that the reason for the reducing reaction rate of the acid rock is because the polymer solution formed a thin film on the surface of the carbonate rock, which impeded the contact between H+ and the surface of the carbonate rock. As the reaction continued, the reaction rate dropped to a minimum and the adsorption reached saturation. The reaction time required to reach adsorption saturation also increased as the polymer concentration increased. With the continued reaction, the polymer broke off from the rock surface, and the dissolution rate increased in an obvious manner. Finally, the reaction rate gradually decreased, mainly owing to the consumption of H+ and the formation of a large amount of Ca2+.4 Mensuration of adsorption–desorption
4.1 UV spectrophotometric analysis of polymer solutions
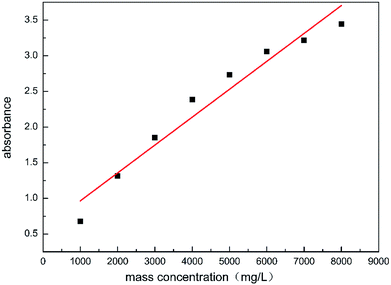
The test sample was prepared by mixing 0.8 g of the polymer powder with 100 mL of 20% HCl in a conical bottom glass tube, this was then made into a polymer acid solution of 8000 mg L−1, the solution underwent ultrasonic vibration for 30 min and was left to rest for 24 h. After the repose time, the test samples were prepared, the prepared solution of 8000 mg L−1 was diluted with 20% HCl, to obtain samples (solutions 1–8) with final concentrations from 1000 to 8000 mg L−1, all samples were prepared at ambient temperature. The absorbance of the diluted samples was obtained using 100 mm optical path quartz cells in an ultraviolet-visible spectrometer (UV-vis, PerkinElmer LS55, USA) at a selected wavelength of 233.7 nm.30 The results are shown in Fig. 10.The linear relationship between the absorbance and the mass concentration can be observed in Fig. 10. The corresponding HPAAT concentration can be found by the absorbance, which was detected using UV-vis spectroscopy. The absorbance at the maximum adsorption point was determined using UV-vis spectroscopy. The mass concentration was found by referring to the standard curve displayed above, thereby calculating the amount of adsorption. The polymer adsorption on the rock surface was measured using the depletion method.31
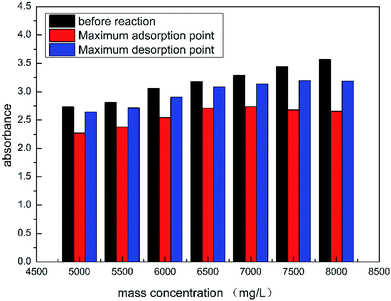
As shown in Fig. 11, the absorbance of HPAAT acid at the initial, maximum adsorption point and maximum desorption point can be clearly seen.
Formula for calculation of the adsorption amount:
 | (6) |
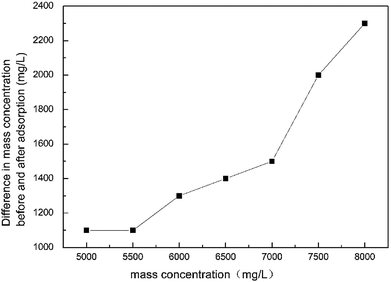
As the fixed reaction contact is 5 cm2 during the acid–rock reaction, the carbonate concentration in the polymer-calcium carbonate dispersion is approximately equal, therefore the amount of adsorption can be expressed by the difference in concentrations.
According to Fig. 12, as the concentration of the retarded acid increased, the difference between the concentration (absorption amount) at the maximum adsorption point and before the reaction gradually increased during the acid–rock reaction. Therefore, the higher the concentration of the retarded acid, the greater the amount of adsorption during the acid–rock reaction.
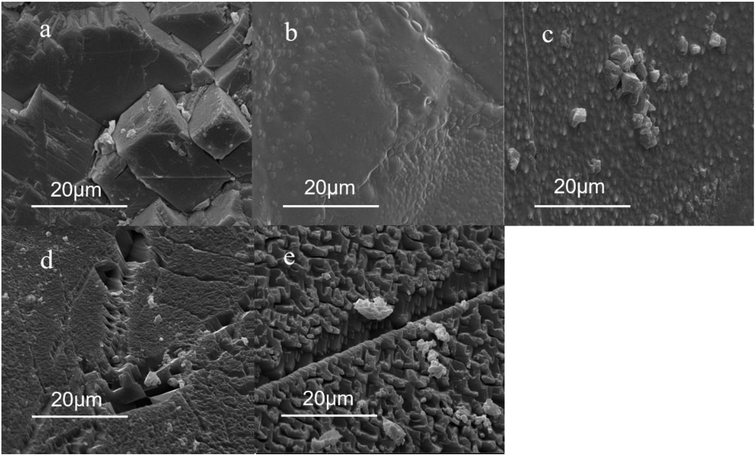
4.2 SEM analysis of the carbonate
Scanning electron microscopy was performed on the rock to explore whether the adsorption of the polymer acid solution on the rock surface is affected by hydrophobic association, as well as to investigate the micro-morphology of the rock surface before and after the adsorption of the polymer during the reaction of the acid and the rock. The results are shown in Fig. 13.Fig. 13a shows the SEM results demonstrating the roughness of the rock surface without the acid rock reaction. As shown in Fig. 13b, a thin-layer film was formed on the carbonate sample that was treated with 20% HCl and 5000 mg L−1 polymer acid solution for 40 min, and the carbonate rock surface looked smooth. As shown in Fig. 13d, for the carbonate sample that was treated with the polymer acid solution for 55 min a large number of cracks and voids were formed, meanwhile the thin film broke away from the carbonate surface and only a small amount of polymer remains. By comparing Fig. 13c with Fig. 13b it can be seen that the adsorption of the polymer on the calcium carbonate surface is significantly increased. As seen in Fig. 13e the adsorption film broke away from the carbonate surface. This showed that the added polymer could be absorbed onto the carbonate rock surface, and desorbed from the carbonate, leaving a small amount of polymer on the surface of the rock, with very little damage to the rock.
4.3 Infrared spectroscopy analysis of the carbonate rock surface
In this study, the infrared spectra of the carbonate rock surface were determined using WQF-520 Fourier-transform infrared spectroscopy at various points at which the rock and the 0.5 wt% HPAAT acid reacted. The surface changes of the carbonate rock samples before and after the acid–rock reaction were verified. The results are shown in Fig. 14.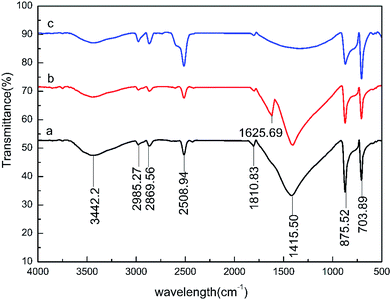 | ||
| Fig. 14 Infrared spectrogram of the carbonate rock surface: (a) before reaction; (b) at the maximum adsorption point; and (c) at the maximum desorption point. | ||
According to the infrared spectrum analysis, the carbonate rock spectrum before the reaction showed peaks at 3442.32, 2985.27, 2869.56, 2508.94, 875.52, 703.89 and 1600–1300 cm−1. These broad and strong absorption peaks are the absorption vibration peaks of calcium carbonate. The marble samples were dissolved for 40 min (the maximum adsorption point of 0.5 wt% HPAAT). Compared with the absorption peaks of before the reaction (Fig. 14a) and the maximum adsorption point (Fig. 14b), the C![[double bond, length as m-dash]](https://www.rsc.org/images/entities/char_e001.gif) O stretching vibration peak of the amide group at 1625.69 cm−1 at the maximum adsorption point indicates that during the acid–rock reaction the HPAAT was adsorbed onto the surface of the carbonate. It can be seen from the carbonate at the maximum desorption point (Fig. 14c) compared with the carbonate rock before dissolution (Fig. 14a) that the infrared analysis spectrum of the two are consistent, and the C
O stretching vibration peak of the amide group at 1625.69 cm−1 at the maximum adsorption point indicates that during the acid–rock reaction the HPAAT was adsorbed onto the surface of the carbonate. It can be seen from the carbonate at the maximum desorption point (Fig. 14c) compared with the carbonate rock before dissolution (Fig. 14a) that the infrared analysis spectrum of the two are consistent, and the C![[double bond, length as m-dash]](https://www.rsc.org/images/entities/char_e001.gif) O stretching vibration peak without the amide group indicates that the HPAAT has been taken off the marble surface.
O stretching vibration peak without the amide group indicates that the HPAAT has been taken off the marble surface.
5 Conclusions
In this study, a copolymer with a low viscosity and adsorption was developed to address the disadvantages of the short penetration distance, and the difficulty in injection and flowback in the process of acidification in oil and gas fields. HPAAT was obtained by free radical aqueous solution polymerization using four monomers: AM, APEG, DMAAC-18 and SSS. The initial viscosity and residual viscosity of the HPAAT were lower, which is beneficial to the injection and the flowback. The HPAAT adsorbed and formed a protective film on the carbonate, preventing the hydrogen ions from contacting the rock surface and improving the retarding effect of the acid. The molecular structure of HPAAT was characterized using FTIR and 1H-NMR spectroscopy. The weight-average molecular weight (Mw) was 2.7 × 10⁵, the number-average molecular weight (Mn) was 1.0 × 10⁵, and the polydispersity was equal to 2.62. Analysis was conducted for HPAAT at the concentrations of 5, 6, 7, 8 and 9 g L−1 The apparent viscosity showed that HPAAT at 7 g L−1 has a high retarding efficiency and the viscosity of the acid remained under 10 mPa. The retarding capability test implied that the absorption of HPAAT on the surface of the carbonate rock hindered the contact between H+ and the surface. The SEM, infrared spectrum analysis, and UV analysis implied that before and after the hydrophobic association the polymer adsorbed onto the surface of carbonate and formed a layer of adsorption film. After the acid and carbonate rock reacted, the absorption film was broken away from the surface of the carbonate, and a small amount of polymer remained on the carbonate surface and formed lots of cracks and voids. Therefore, the adsorption and desorption influenced the reaction rate of the acid and the carbonate. We plan to conduct further research on the application of the copolymer in the future.Conflicts of interest
There are no conflicts to declare.Acknowledgements
This work was supported by the National Natural Science Foundation of China (No. 51604229) and the Sichuan Science and Technology Plan Project (No. 2019YJ0315).References
- D. E. Johnson, K. B. Fox, L. D. Burns and E. M. O'Mara, Carbonate Production Decline Rates Are Reduced through Improvements in Gelled Acid Technology, SPE, Midland, Texas, 1988 Search PubMed.
- A. S. Pabley and D. L. Holcomb, A New Method of Acidizing of Acid Fracturing: Crosslinked Acid Gel, Annual Southwestern Petroleum Short Course, Dallas, Texas, 1980 Search PubMed.
- L. N. Morgenthaler, Application of a Three-Dimensional Hydraulic Fracturing Simulator for Design of Acid Fracturing Treatments, Society of Petroleum Engineers, Oklahoma, 1993 Search PubMed.
- T. D. Welton and S. V. Domelen, High-viscosity-yield acid systems for high-temperature stimulation, Society of Petroleum Engineers, Lafayette, Louisiana, 2006 Search PubMed.
- M. Steven, W. Brian, W. Davis, D. H. Gray and J. M. Brienen, Acid Fracturing in the Warrent Unit of Southeastern New Mexico, Society of Petroleum Engineers, Dallas, Texas, 1996 Search PubMed.
- G. D. Dean, C. A. Nelson, S. Metcalf, R. Harris and T. Barber, New Acid System Minimizes Post Acid Stimulation Decline Rate in the Wilmington Field, SPE, Bakersfield, California, 1998 Search PubMed.
- J. Mou, S. Zhang and Y. Zhang, Acid Leakoff Mechanism in Acid Fracturing of Naturally Fractured Carbonate Oil Reservoirs, Transp. Porous Media, 2012, 91(2), 573–584 CrossRef CAS.
- M. A. Sayed, H. A. Nasr-El-Din, J. Zhou and S. A. Holt, New Emulsified Acid to Stimulate Deep Wells in Carbonate Reservoirs, Society of Petroleum Engineers, Cairo, Egypt, 2011 Search PubMed.
- P. Y. Feng, D. Wang, G. Z. Liu, H. B. Wang and M. John, Reservoir Stimulation Using High-Temperature Deep-Penetrating Acid, Society of Petroleum Engineers, Anchorage, Alaska, 2011 Search PubMed.
- H. Quan, H. Li and Z. Huang, et al., Copolymer MCJS as a retarder of the acid–rock reaction speed for the stimulation of deep carbonate reservoirs, J. Appl. Polym. Sci., 2015, 132(7), 2259–2262 CrossRef.
- D. Lv, R. Wang and G. Tang, et al., Eco-friendly Electrospun Membranes Loaded with Visible-light Response Nano-particles for Multifunctional usages: High-efficient Air Filtration, Dye Scavenger and Bactericide, ACS Appl. Mater. Interfaces, 2019 DOI:10.1021/acsami.9b01508.
- Y. Suzuki, Ion beam modification of polymers for the application of medical devices, Nucl. Instrum. Methods Phys. Res., Sect. B, 2003, 206(03), 501–506 CrossRef CAS.
- H. A. Nasr-El-Din, A. M. Al-Othman and K. C. Taylor, et al., Surface tension of HCl-based stimulation fluids at high temperatures, J. Pet. Sci. Eng., 2004, 43(1), 57–73 CrossRef CAS.
- X. Song, M. Cao and Y. Han, et al., Adsorption of hydrophobically modified poly(acrylamide)-co-(acrylic acid) on an amino-functionalized surface and its response to the external solvent environment, Langmuir, 2007, 23(8), 4279 CrossRef CAS PubMed.
- A. A. Rakhnyanskaya, I. D. Pebalk and V. N. Orlov, et al., Controlled adsorption-desorption of cationic polymers on the surface of anionic latex particles, Polym. Sci., 2010, 52(5), 483–489 Search PubMed.
- K. C. Taylor and R. A. Burke, et al., Development of a flow injection analysis method for the determination of acrylamide copolymers in oilfield brines, J. Pet. Sci. Eng., 1998, 21(1–2), 129–139 CrossRef CAS.
- M. Alkhaldi, Reaction of citric acid with calcite, Chem. Eng. Sci., 2007, 62(21), 5880–5896 CrossRef CAS.
- F. Civan, J. Vasquez and D. Darymple, et al., Laboratory and Theoretical Evaluation of Gelation Time Data for Water-Based Polymer Systems for Water Control, Liq. Fuels Technol., 2007, 25(3), 19 Search PubMed.
- E. Volpert, J. Selb and F. Candau, et al., Adsorption of Hydrophobically Associating Polyacrylamides on Clay, Langmuir, 1998, 14(7), 1871–1874 CrossRef.
- K. C. Taylor and H. A. Nasreldin, Water-soluble hydrophobically associating polymers for improved oil recovery: A literature review, J. Pet. Sci. Eng., 1995, 19(3–4), 265–280 Search PubMed.
- H. Quan, Z. Chen and Y. Wu, et al., Adsorption behavior of the copolymer AM/DMC/APEG/DMAAC-16 on a carbonate rock and its application for acidizing, Petrochem. Technol., 2017, 40(8), 895–900 Search PubMed.
- P. Zhang, W. Huang and Z. Jia, et al., Conformation and adsorption behavior of associative polymer for enhanced oil recovery using single molecule force spectroscopy, J. Polym. Res., 2014, 21(8), 523 CrossRef.
- Y. A. Shashkina, Y. D. Zaroslov and V. A. Smirnov, et al., Hydrophobic aggregation in aqueous solutions of hydrophobically modified polyacrylamide in the vicinity of overlap concentration, Polymer, 2003, 44(8), 2289–2293 CrossRef CAS.
- P. Zhang, Y. Wang and W. Chen, et al., Preparation and Solution Characteristics of a Novel Hydrophobically Associating Terpolymer for Enhanced Oil Recovery, J. Solution Chem., 2011, 40(3), 447–457 CrossRef CAS.
- T. Wan, C. Zou and L. Chen, et al., Synthesis and Solution Properties of Hydrophobically Associative Polyacrylamides by Microemulsion Polymerization, J. Solution Chem., 2014, 43(11), 1947–1962 CrossRef CAS.
- H. Quan, Z. Li and Z. Huang, Self-assembly properties of a temperature and salt-tolerant amphoteric hydrophobically associating polyacrylamide, RSC Adv., 2016, 6(54), 49281–49288 RSC.
- Y. Du, C. Zhou and T. Zhou, et al., Preparation of acrylate oligomer and its application in the modification of waterborne polyurethane, Petrochem. Technol., 2011, 40(8), 895–900 CAS.
- M. H. Al-Khaldi, H. A. Nasr-El-Din and S. Mehta, et al., Reaction of citric acid with calcite, Chem. Eng. Sci., 2007, 62(21), 5880–5896 CrossRef CAS.
- K. Lund, H. S. Fogler and C. C. Mccune, et al., Acidization—IV: Experimental correlations and techniques for the acidization of sandstone cores, Chem. Eng. Sci., 1976, 31(5), 373–380 CrossRef CAS.
- J. F. Argillier, A. Audibert and J. Lecourtier, et al., Solution and adsorption properties of hydrophobically associating water-soluble polyacrylamides, Colloids Surf., A, 1996, 113(3), 247–257 CrossRef CAS.
- H. Lu and Z. Huang, Solution and Adsorption Properties of Hydrophobically Associating Polyacrylamide Prepared in Inverse Microemulsion Polymerization, J. Macromol. Sci., Part A, 2009, 46(4), 412–418 CrossRef CAS.
| This journal is © The Royal Society of Chemistry 2019 |

