
 Open Access Article
 This Open Access Article is licensed under a Creative Commons Attribution-Non Commercial 3.0 Unported Licence
Nonlinear optical behavior of n-tuple decker phthalocyanines at the nanosecond regime: investigation of change in mechanisms†
Kutloano E. Sekhosana‡
 * and
Tebello Nyokong‡*
* and
Tebello Nyokong‡*
Institute for Nanotechnology and Innovation, Department of Chemistry, Rhodes University, PO Box 94, Grahamstown 6140, South Africa. E-mail: sekhosanake@gmail.com; t.nyokong@ru.ac.za
First published on 23rd May 2019
Abstract
The coordination system of rare-earth n-tuple decker phthalocyanines would be better suited with appropriate metal ions with the correct coordination number and the solvent system of the reaction, amongst other reasons, for the formation of n-tuple decker phthalocyanines. As a result, these complexes are very rare. In this manuscript, we present new n-tuple decker phthalocyanines in the form of double- (complex 2), quadruple- (complex 3a) and sextuple-decker phthalocyanines (complex 3b), all of which contain neodymium and cadmium metal ions. The primary focus is the investigation of the nonlinear optical (NLO) mechanisms responsible for the observed reverse saturable absorption. While the extension of the π-electron system has been found to enhance the nonlinear optical behavior of complexes 3a and 3b, a change in the NLO mechanisms has been observed, with complex 2 lacking the triplet state population, as revealed by a laser flash photolysis technique. It has also been established that the excited state absorption cross sections follow a clear order of magnitude for the complexes under investigation: σ23 (for 3b) > σ23 (for 3a) > σ1m (for 2). This trend evidences the effects of the extension of the π-electron system.
1. Introduction
Macroheterocyclic tetraazoporphyrin ring complexes can be modified in such a way that the ligands interact with each other via coordination to transition metals and/or lanthanide ions, as is the case with multi-decker phthalocyaninato molecules. Such complexes are also referred to as advanced materials1 and find applications in many fields as single-molecule magnets,2–10 sensors,11–13 conductive materials,14–17 optical limiters,18–28 ambipolar organic field-effect transistors,29,30 supramolecular spin valves31 and self-assembled nanostructures.32,33 Lanthanide double-decker phthalocyanine (LnPc2) complexes, in particular, have been the center of interest in research for a long time.26,34 However, new developments have paved the way for the discovery of even more complex materials in the form of triple-decker,35 quadruple-decker,36 quintuple-decker37 and a sextuple-decker phthalocyanines.38 The sextuple-decker, to the best of our knowledge, has been prepared once. Therefore, it can be concluded that not much has been done in terms of developing such materials. The scarcity of such structures has been attributed to the selection of an appropriate metal ion with the necessary coordination number, geometry, charge, and hard/soft-acid/base characteristics to suit the coordination algorithm of tetrapyrroles.37 For simplicity, all sandwich-type phthalocyaninato complexes, presented in this manuscript, are termed n-tuple decker phthalocyaninato molecules. Quandruple-decker phthalocyaninato molecules have not been investigated for optical limiting, while their sextuple-decker counterparts have been shown to possess good optical limiting properties.37 This manuscript narrows its focus on investigating the mechanisms governing the reverse saturable absorption as well as the effects of π-conjugation on the optical limiting properties of the new n-tuple decker phthalocyanines in solution and thin films. These molecules are based on neodymium and cadmium metal ions. The bulk tert-butyl phenoxy substituents enhance the solubility in nonpolar solvents, hence the choice of dichloromethane as the solvent medium. All the molecules presented in this manuscript are new, since the tert-butyl phenoxy substituted n-tuple decker phthalocyanines have not been reported elsewhere. The molecules are embedded in polymers to form thin films for nonlinear optical (NLO) limiting studies. Poly(bisphenol A carbonate) was selected as the polymer for thin films because of its superior solubility in nonpolar solvents, thereby, limiting the challenges of the manufacturing of thin films.2. Experimental
2.1 Materials
Deuterated chloroform (CDCl3), 1-pentanol, 1,2,4-trichlorobenzene (TCB), and neodymium(III) acetate hydrate were purchased from Sigma-Aldrich. Dimethyl formamide (DMF), chloroform and dichloromethane (DCM) were purchased from MINEMA. Cadmium acetate dihydrate, 1,8-diazabicyclo[5.4.0]undec-7-ene (DBU) and poly(bisphenol A) carbonate were purchased from Fluka. Water was obtained from Milli-Q Water Systems (Millipore Corp., Bedford, MA, USA). The synthesis of bis-{2(3),9(10),16(17),23(24)-tetra(4-tert-buylphenoxy) phthalocyaninato} neodymium(III) (2) was reported in our previous publication.392.2 Synthesis of quadruple-decker phthalocyanine (3a) (Scheme 1)
Complex 2 (40 mg; 16.99 μmol) was placed in a clean round bottom flask (50 mL) that contained cadmium acetate hydrate (4.36 mg; 16.34 μmol). TCB (6 mL) was added to the reaction mixture under a blanket of argon, followed by refluxing for 24 h. Next, TCB was evaporated and the crude product was cooled to room temperature. The mixture of ethanol and water (v/v 1![[thin space (1/6-em)]](https://www.rsc.org/images/entities/char_2009.gif) :1) was used for further purification under centrifugation at 3000 rpm before the oven-dried blue product was loaded onto a chromatography column packed with silica. A CHCl3 and n-hexane solvent mixture was first used to remove the unreacted complex 2, after which a CHCl3 and methanol mixture (v/v 14:1) was employed to elute complex 3a as the second band, which was dried in open air. Yield: (67%). IR: [KBr, v, cm−1] 748, 771, 886, 940, 1013 (Pc skeleton), 1040, 1074, 1107, 1173, 1228, 1254 (C–O–C), 1326, 1363, 1392, 1471, 1506, 1600, 1737 (benzene, pyrrole, isoindole and aza), 2866, 2922, 2956 (C–H). UV-Vis (DCM): λmax nm (logε), 336 (4.79), 640 (4.85). Anal. calc. for C288H256N32O16Nd2Cd: C, 71.73; H, 5.35; N, 9.29%. Found: C, 71.66; H, 5.21; N, 9.32%. 1H NMR (CDCl3) for 3a δ, ppm 7.40–7.30 (18H, m, H-Ar), 7.14–6.96 (34H, m, H-Ar), 6.78–6.74 (20H, m, H-Ar), 6.47–6.34 (24H, m, H-Ar), 5.98 (16H, m, H-Ar), 1.49 (22H, m, H-tBu), 1.30–1.27 (34H, m, H-tBu), 1.08–1.05 (17H, H-tBu), 1.01–0.98 (33H, m, H-tBu), 0.86–0.77 (38H, m, H-tBu). MS (MALDI-TOF): (m/z): calc. 4822 amu. Found: 4824 amu [M + 2H]+.
:1) was used for further purification under centrifugation at 3000 rpm before the oven-dried blue product was loaded onto a chromatography column packed with silica. A CHCl3 and n-hexane solvent mixture was first used to remove the unreacted complex 2, after which a CHCl3 and methanol mixture (v/v 14:1) was employed to elute complex 3a as the second band, which was dried in open air. Yield: (67%). IR: [KBr, v, cm−1] 748, 771, 886, 940, 1013 (Pc skeleton), 1040, 1074, 1107, 1173, 1228, 1254 (C–O–C), 1326, 1363, 1392, 1471, 1506, 1600, 1737 (benzene, pyrrole, isoindole and aza), 2866, 2922, 2956 (C–H). UV-Vis (DCM): λmax nm (logε), 336 (4.79), 640 (4.85). Anal. calc. for C288H256N32O16Nd2Cd: C, 71.73; H, 5.35; N, 9.29%. Found: C, 71.66; H, 5.21; N, 9.32%. 1H NMR (CDCl3) for 3a δ, ppm 7.40–7.30 (18H, m, H-Ar), 7.14–6.96 (34H, m, H-Ar), 6.78–6.74 (20H, m, H-Ar), 6.47–6.34 (24H, m, H-Ar), 5.98 (16H, m, H-Ar), 1.49 (22H, m, H-tBu), 1.30–1.27 (34H, m, H-tBu), 1.08–1.05 (17H, H-tBu), 1.01–0.98 (33H, m, H-tBu), 0.86–0.77 (38H, m, H-tBu). MS (MALDI-TOF): (m/z): calc. 4822 amu. Found: 4824 amu [M + 2H]+.
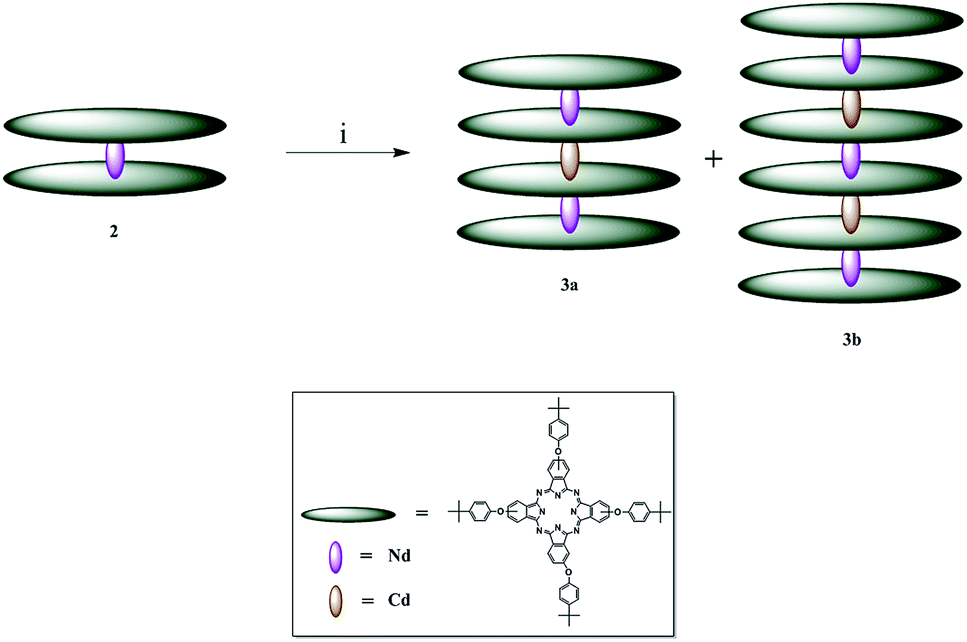 | ||
| Scheme 1 Synthetic pathway to obtain complexes 3a and 3b; i = TCB and cadmium acetate dihydrate at reflux temperature, 24 h. | ||
2.3 Synthesis of sextuple-decker phthalocyanine (3b) (Scheme 1)
Complex 3b was obtained as a by-product from the same reaction as that of complex 3a, except that a CHCl3 and methanol mixture (v/v 9:1) was used for the elution of the third blue band containing the required product. Yield: (22%). IR: [KBr, v, cm−1] 722, 747, 824, 886, 939, 1013 (Pc skeleton), 1041, 1074, 1106, 1173, 1229, 1254, 1289 (C–O–C), 1328, 1363, 1393, 1465, 1507, 1601, 1730 (benzene, pyrrole, isoindole and aza), 2852, 2922, 2954 (C–H). UV-Vis (DCM): λmax nm (logε), 338 (4.98), 636 (5.08). Anal. calc. for C432H384N48O24Nd3Cd2: C, 71.18; H, 5.94; N, 9.22%. Found: C, 71.09; H, 6.11; N, 9.26%. 1H NMR (CDCl3) for 3b: δ, ppm 7.79–7.71 (26H, m, H-Ar), 7.47–7.24 (42H, m, H-Ar), 7.13–6.93 (51H, m, H-Ar), 6.43–5.63 (49H, m, H-Ar), 1.53–1.35 (72H, m, H-tBu), 1.29 (6H, s, H-tBu), 1.26 (8H, s, H-tBu), 1.21 (7H, s, H-tBu), 1.07–0.94 (63H, m, H-tBu), 0.83–0.76 (60H, m, H-tBu). MS (MALDI-TOF): (m/z): calc. 7290 amu. Found: 7291 amu [M + H]+.
2.4 Preparation of thin films
Using 3b and 3c, thin films (3b-TF and 3c-TF) were obtained by following the procedure for the synthesis of the corresponding thin film formed from complex 2 (ref. 39) at the same concentrations (3.0 × 10⁻⁴ M). The thickness of the film was measured to be ∼6 μm using the knife edge attachment of the Bruker D8 Discover X-ray diffraction (XRD) diffractometer.2.5 Equipment
Infrared spectra were recorded on a Perkin Elmer 100 ART FT-IR spectrometer. Ultraviolet-visible (UV-Vis) spectra were recorded on a Shimadzu UV-Vis 2550 spectrophotometer. Emission spectra were recorded on a Varian Cary Eclipse fluorescence spectrophotometer. Luminescence lifetime measurements were performed using time correlated single photon counting setup (TCSPC) (PicoQuant FluoTime 300). The excitation source was a diode laser (LDH-P-C-485, 480 nm, 10 MHz repetition rate, 44 ps pulse width, Picoquant GmbH). The details were provided previously.40,411H NMR studies were performed using a Bruker AMX 600 NMR spectrometer. Elemental analysis experiments were carried out on a Vario-Elementar Microcube ELIII. Mass spectral data were collected using a Bruker AutoFLEX III Smart beam TOF/TOF Mass spectrometer. The spectra were acquired using α-cyano-4-hydroxycinnamic acid as the MALDI matrix and a 355 nm Nd:YAG laser as the ion source.
Electron spin resonance (EPR) spectra were recorded on a Bruker EPR 300E X-band (10 GHz) spectrometer equipped with a TM probe with ESR tubes. The spin Hamiltonian parameters were obtained by the simulation of the spectra. The static field (2500 G), center field (3500 G), modulation amplitude (100 G), sweep time (20.97 ms), time constant (10.24 ms), conversion time (5.12 ms), resolution (2048 pts), power (2.00 mW) and modulation frequency (100 kHz) were used as the experimental parameters at 298 K with 10 scans. Scanning electron microscope (SEM) images of thin films (2-TF, 3a-TF, and 3b-TF) were obtained using a JOEL JSM 840 scanning electron microscope operated at 20 kV.
X-ray powder diffraction patterns were recorded on a Bruker D8 Discover equipped with a proportional counter, using Cu-Kα radiation (λ = 1.5405 Å, nickel filter). The details were reported previously.40,41
All Z-scan experiments described in this study were performed using a frequency-doubled Nd:YAG laser (Quanta-Ray, 1.5 J/10 ns fwhm pulse duration) as the excitation source. A standard quartz cuvette with a lid (0.2 cm), purchased from Purshee, was used for the experiments performed in solution. Details were provided previously.18,42
3. Results and discussion
3.1 Synthesis of n-tuple decker phthalocyaninato complexes and their respective thin films
The conversion of LnPc2 complexes into stable quadruple-decker phthalocyanines is achieved by employing cadmium salts in the presence of TCB at reflux temperature.36 Similar methods have been employed to design sextuple-decker phthalocyanines38 using unmetallated phthalocyanine (H2Pc). Following these methods and placing complex 2 and cadmium acetate dehydrate in the TCB bath at reflux temperature, complexes 3a and 3b were formed. This is the first time when quadruple- and sextuple-decker phthalocyanines were synthesized in the same reaction vessel. It is also the first time when a sextuple-decker phthalocyanine was obtained by sandwiching two Cd(II) ions between three LnPc2 complexes. The contributing factors to this can be thought of as the mole ratio of complex 2 to the cadmium ion and time. However, the yield of 67% for complex 3a is desirable, considering that complex 3b is simultaneously formed. Separation of such highly stable complexes is, therefore, challenging.Complexes 2, 3a and 3b dissolve in highly volatile nonpolar solvents such tetrahydrofuran, chloroform and dichloromethane, as is the case with poly(bisphenol A) carbonate. For the preparation of thin films, chloroform was chosen as the best solvent with a controllable rate of evaporation.
3.2 Structural characterization of LnPc2 complexes and their respective thin films
![[double bond, length as m-dash]](https://www.rsc.org/images/entities/char_e001.gif) C, CN– and C–N moieties of the benzene ring, azo and the isoindole groups. These vibrations were observed between 1326 and 1601 cm−1 for complexes 2, 3a and 3b. The tert-butyl and C–H vibrations of the tert-butyl benzene or the benzene rings of these complexes appeared at ∼2852 to 2954 cm−1. It was observed that complex 2 absorbed moisture (Fig. 1), which was characterized by the OH– stretch at 3481 cm−1.
C, CN– and C–N moieties of the benzene ring, azo and the isoindole groups. These vibrations were observed between 1326 and 1601 cm−1 for complexes 2, 3a and 3b. The tert-butyl and C–H vibrations of the tert-butyl benzene or the benzene rings of these complexes appeared at ∼2852 to 2954 cm−1. It was observed that complex 2 absorbed moisture (Fig. 1), which was characterized by the OH– stretch at 3481 cm−1.
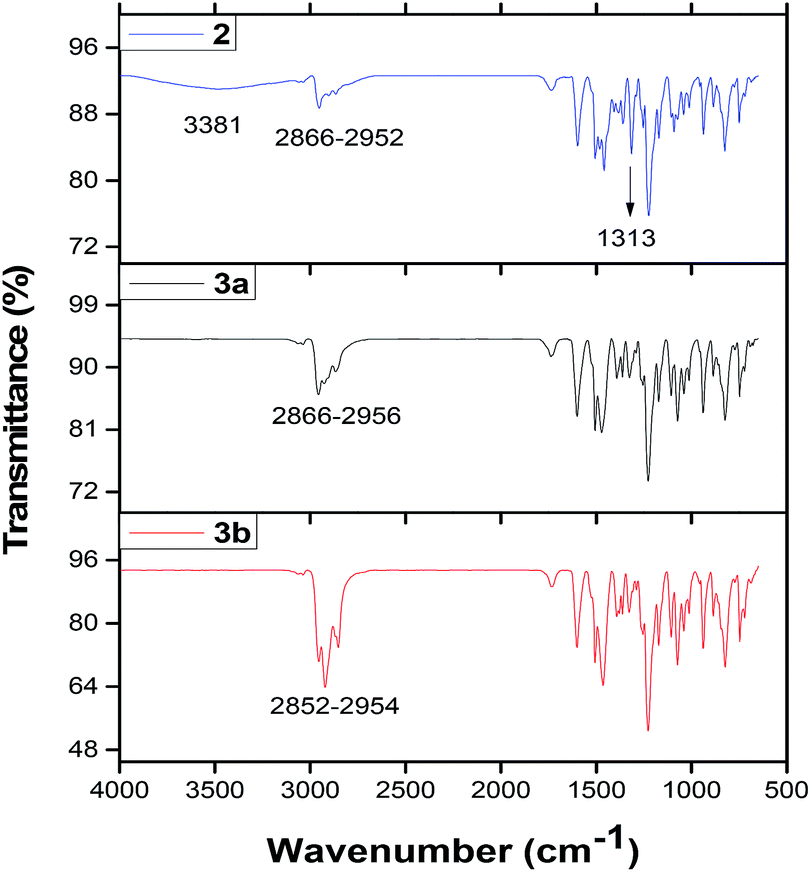 | ||
| Fig. 1 FTIR spectra of complexes 2,39 3a and 3b. | ||
 orbitals.
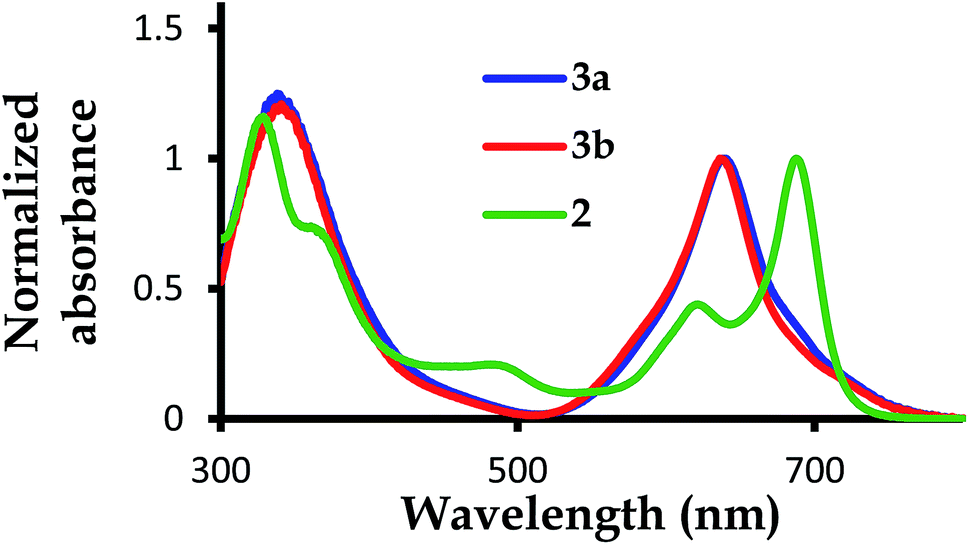 | ||
| Fig. 2 The normalized UV-Vis absorption spectra for complexes 2,39 3a and 3b, with 2 showing a blue valence band when the Q-bands for 3a and 3b are blue shifted with no blue valence band observed. | ||
The B-band results from the transitions between π(b2u) and 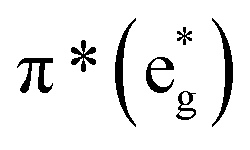 .51,52 The absorption spectra of complexes 3a and 3b are broader than those of blue forms39 but comparable to those of similar analogues.38
When the emergence of the ESR band is governed by the movement of an unpaired electron originating directly from the π-radicals, it would be expected that a phthalocyanine molecule, obtained via modification of a neutral LnPc2 complex, should not exhibit an ESR signal. However, for complexes 3a and 3b, ESR bands were observed. These ESR signals were characterized by intensities much higher than that of complex 2. Even though complexes 3a and 3b lack π-radicals, the presence of paramagnetic neodymium ions can encourage the movement of electrons. Since there are more paramagnetic neodymium ions in complexes 3a and 3b than in complex 2 (Fig. S3†), the presence of ESR signals of higher intensity is not surprising.
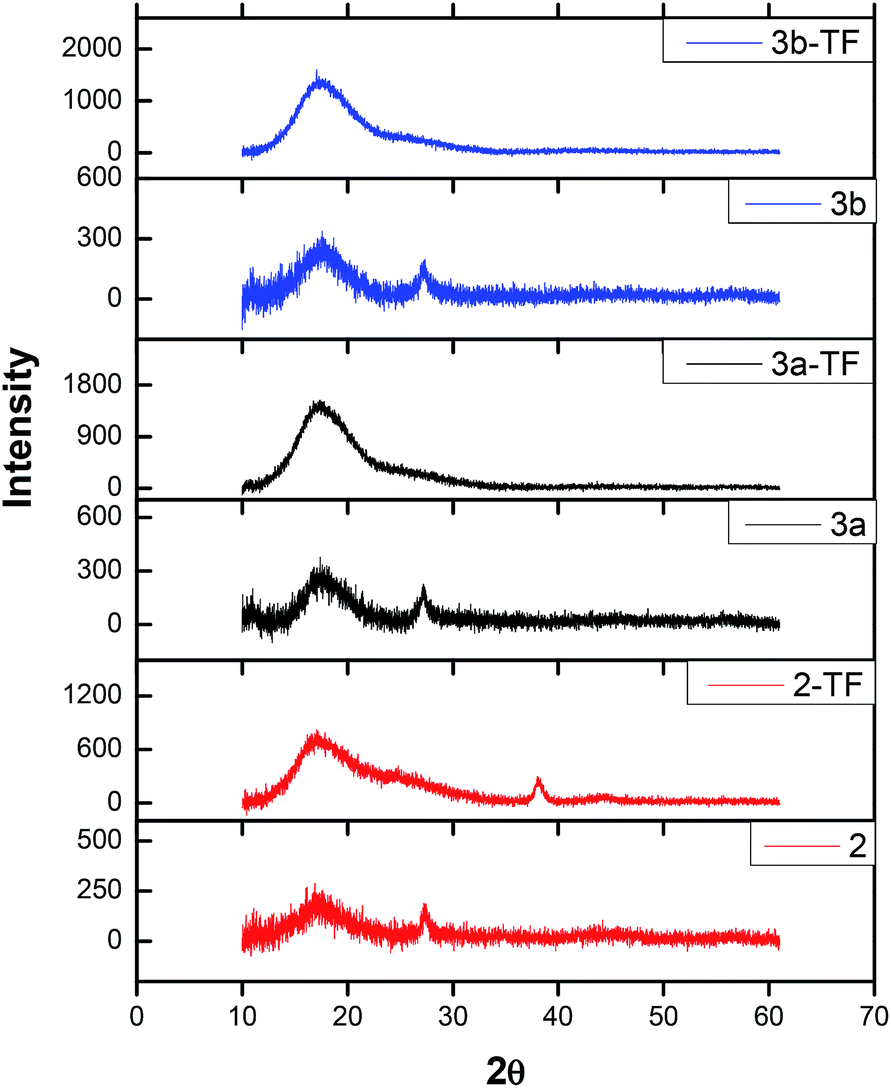 | ||
| Fig. 3 X-ray diffractograms of complexes 2,39 3a and 3b in powder form as well as their respective thin films 2-TF,39 3a-TF and 3b-TF. | ||
The only difference between X-ray diffractograms of the films is an additional sharp XRD peak observed at 38° only for 2-TF. The overall change in the XRD pattern signifies the influence of poly(bisphenol A) carbonate on the complex. The sizes of complexes 2, 3a and 3b were determined using the Debye–Scherrer equation56 to fit the XRD diffractograms and found to be 0.81, 1.56 and 1.87 nm, respectively.
3.3 Nonlinear optical signatures
The nonlinear optical behavior of a material can be monitored by subjecting the material to highly illuminating laser beams. The behavior is then analyzed as the material moves along the z-axis through the focal point of converging irradiation using the Z-scan technique. The intensity modulation affects the material as it approaches the focal point and, therefore, attenuates the transmittance (herein referred to as the normalized transmittance or TNorm). The Z-scan is only affected by the nonlinear absorption22 as all the transmitted light is detected. There are two techniques to detect the transmitted light, namely, the closed aperture and the open aperture Z-scans. This manuscript strictly focuses on presenting the data obtained from the open aperture Z-scan experiments performed in solution and solid state.The nonlinear optical parameters for complex 2 and its corresponding thin film (TF-2) have been discussed in detail before.39 For precise comparison of the nonlinear behavior, all the complexes were subjected to the same experimental conditions in the nanosecond regime. The establishment of the reverse saturable absorption (RSA), characterized by the reduction of TNorm at focus (z = 0), was achieved upon scanning along the z-axis of the Z-scan under resonant conditions. This behavior is illustrated for complexes 2, 3a and 3b in Fig. 4A and B.
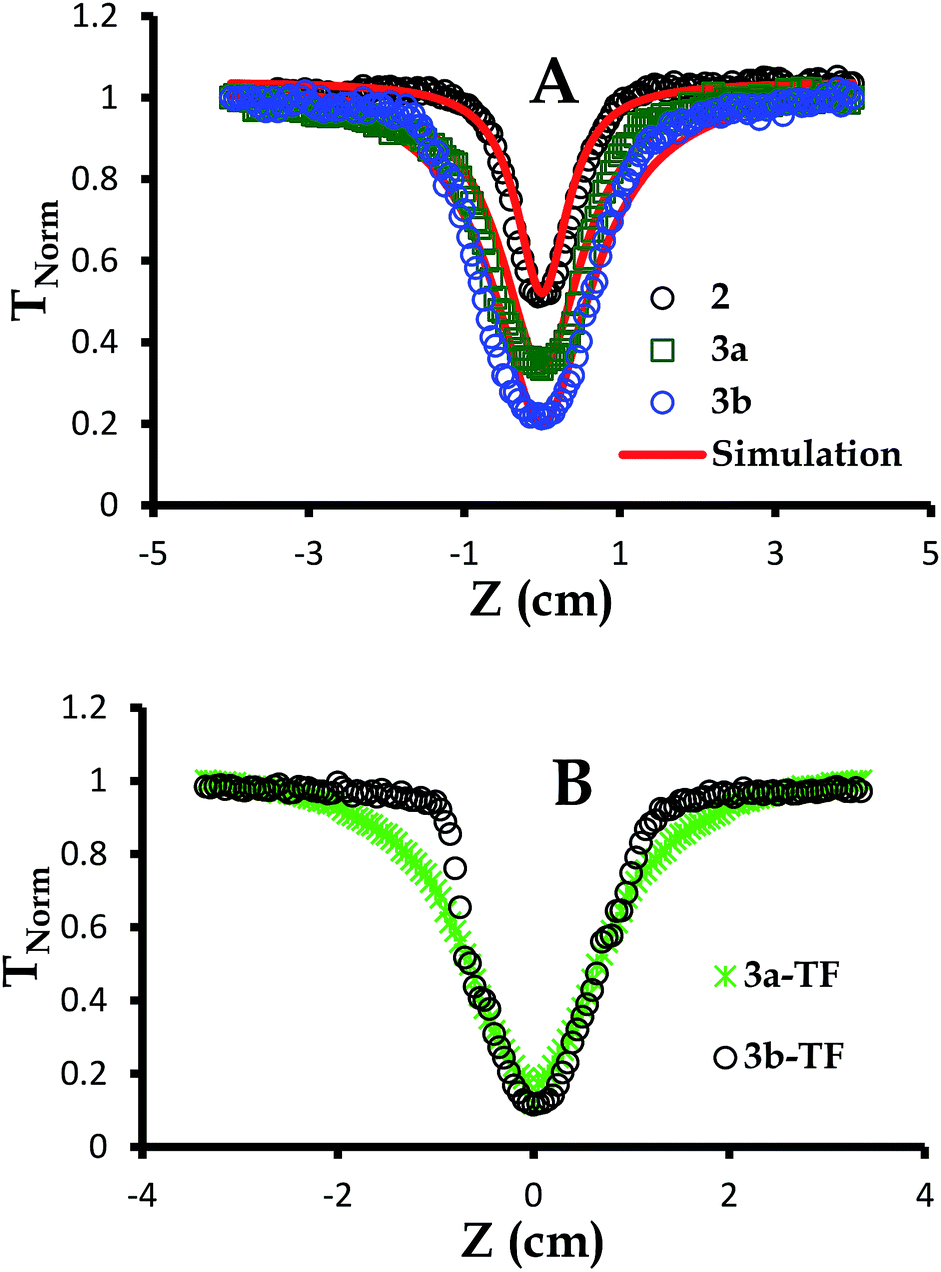 | ||
| Fig. 4 Open aperture Z-scan signatures of (A) 2,39 3a and 3b in DCM at 3.0 × 10⁻⁴ M and (B) 3a-TF and 3b-TF. The simulations were performed employing eqn (6)–(12). | ||
As can be seen in Fig. 4, the signature only attenuates about 48% of the input fluence for complex 2 as already discussed previously.39 For simplicity and better understanding of the behavior of this complex, we employed an excited state energy diagram similar to that obtained for LuPc2 by Orti et al., acquired by performing Valence Effective Hamiltonian (VEH) calculations,44,53 Fig. 5A.
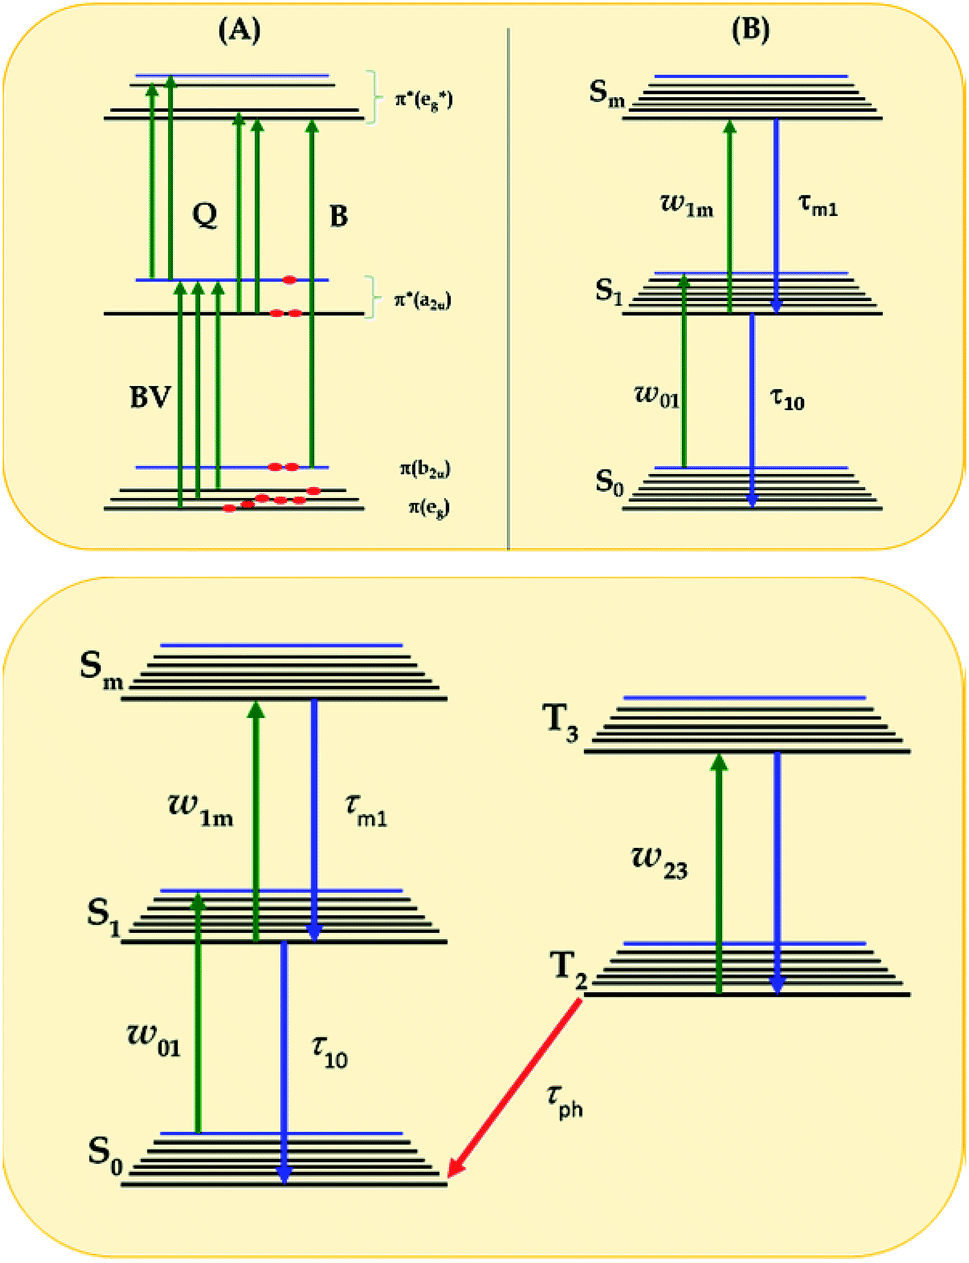 | ||
| Fig. 5 (A) Diagram showing singlet excited states of LnPc2 in comparison to that obtained by Orti et al. using Valence Effective Hamiltonian calculations;44,53 (B) three-energy-level diagram used to model the excited state cross-section spectrum within the rate equation model of eqn (1)–(3), according to ref. 56 and 57; and (C) general five-energy level diagram employed for the simulation of the NLO mechanisms of complexes 3a, 3b, 3a-TF and 3b-TF using eqn (6)–(12). | ||
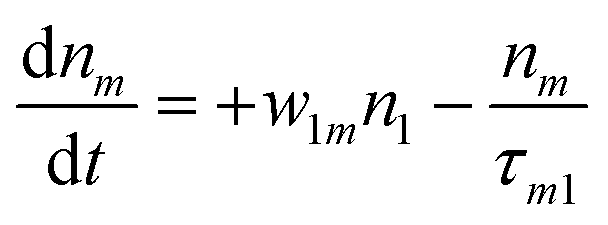
This is the strategy, illustrating that the excited molecules at a2u level undergo the  electronic transition when the energy is being pumped into level a2u. This electronic transition is depicted by the three-energy level diagram (Fig. 5B) describing similar electronic transitions where the ground singlet state, the first singlet excited state and the higher energy singlet state are denoted by S0, S1 and Sm, respectively. With S0, S1 and Sm corresponding to eg, a2u and
  , respectively, the electronic transitions eg → a2u and
  may describe the transition rates w01 and w1m, respectively. The excited molecules may relax via the relaxation pathways Sm → S1 (with decay time τm1) and S1 → S0 (with the first excited state lifetime τ10). When tuning the energy pump at eg → a2u (by transition rate w01 which is around the BV band (i.e., at 532 nm), the molecules at a2u would get excited to
  (Sm level) by the transition rate w1m. The relaxation then takes through
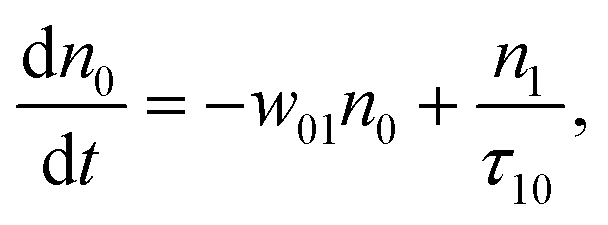
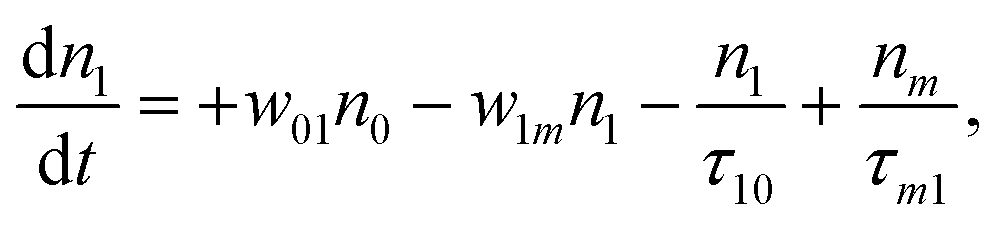
 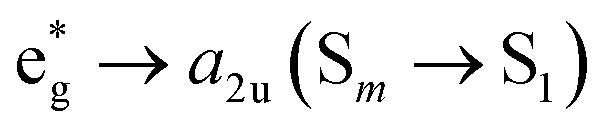 and a2u → eg (S1 → S0) upon losing the photon energy (hv) via τm1 and τ10. At both excitation regions, shown in Fig. 5B, the fractions of molecules at each level can be described using the following laser rate equations57,58 at E = 55 ± 0.1 μJ:
 | (1) |
 | (2) |
 | (3) |
In these eqns, ni is the population fraction of the state (i = 0, 1 and m) with n0 + n1 + nm = 1; w01 = σ01I(t)/hv and w1m = σ1mI(t)/hv, where σ01 and σ1m, are the ground and the singlet excited state absorption cross-sections, respectively, corresponding to the ground state (w01) and the excited state (w1m) transitions; τm1 and τ10 are the relaxation lifetimes from the highest excited singlet state (Sm) to the first excited singlet state (S1) and from the singlet excited state (S1) to the ground state (S0), respectively. Eqn (1)–(3) can be numerically solved by considering a GAUSSIAN temporal profile for the laser pulse, with the temporal dependence of the absorption coefficient described by eqn (4):
| α(t) = N{n0(t)σ01 + n1(t)σ1m} | (4) |
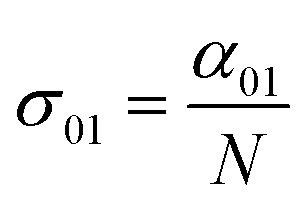
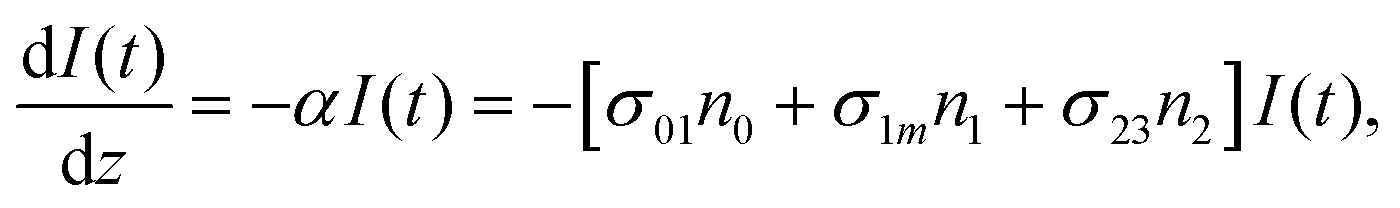
In eqn (4), N is the sample concentration in molecules per cm3. For all complexes, N was kept constant at 1.869 × 10¹⁷ molecules per cm3. This concentration is lower than the one reported for the YbPc2 complex.57 To calculate the transmittance, the propagation equation, dI(t)/dz(t) = −α(t)I(t), can be integrated over the sample thickness L and the full pulse width (t from −∞ to +∞). The ground state cross section is described by eqn (5):58
 | (5) |
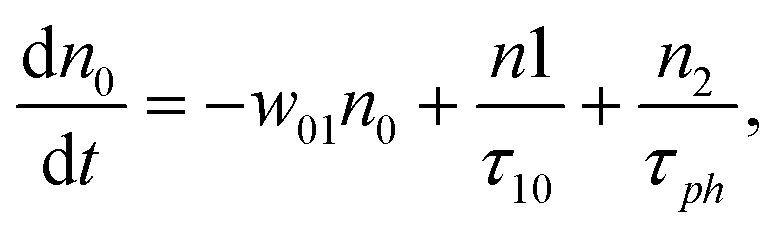
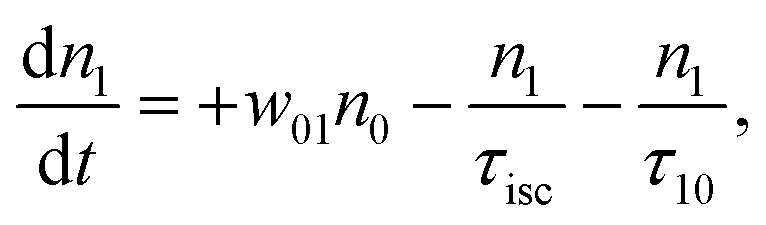
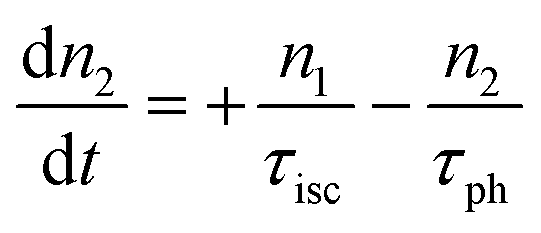
However, for the sandwich-type phthalocyanes25 whose triplet population is not affected by ligand–ligand interactions, the singlet excited state may be infinitesimally weaker and the relaxation decay time is far smaller than the laser pulse rate. In this case, a general five-level model (Fig. 5C) can be applied.59 This model ignores the vibrational levels of the electronic states such that the laser pulse width is assumed to be longer than any relaxation decay times associated with the levels. To further simplify the model, it is assumed that relaxation from Sm and T3 is very fast,59 hence the neglection of these two levels. Excitation at 532 nm leads to the S1 population. As highlighted above, even if the electrons undergo S1 → Sm, Sm lifetime is very fast. Therefore, the S1 → T2 transition (τisc) occurs via intersystem crossing (ISC). Once T2 is populated, the electrons undergo T2 → T3 transition and then relax back to T2 via the T3 → T2 electronic transition. For complexes 3a and 3b, the relaxation decay time (τph) at T2 was measured using the laser flash photolysis technique18 and found to be in the order of microseconds. Using laser flash photolysis, the triplet decay curves for complexes 3a and 3b were recorded (Fig. S4†) and fitted. The obtained triplet lifetimes ranged from 27 to 22 μs for complexes 3a and 3b, respectively. These values are consistent with the proposed τph,59 which has to be much longer than τisc. Ignoring the stimulated emission from S1 due to small fluorescence quantum yield, the following modified laser rate equations can be applied to simulate the excitation and relaxation of the system:
 | (6) |
 | (7) |
 | (8) |
 | (9) |
| Complex | σ01 (cm2) | σ23 (cm2) | k | τ10 (ns) |
|---|---|---|---|---|
| a Values obtained from ref. 39, τph (μs) in brackets. | ||||
| 2 | a4.85 × 10−18 | — | a8.08 | a5.32 |
| 2-TF | a1.62 × 10−17 | — | a19.3 | — |
| 3a | 2.36 × 10⁻¹⁷ | 9.92 × 10⁻¹⁷ | 4.20 | 5.40 (22) |
| 3a-TF | 1.89 × 10⁻¹⁷ | 4.01 × 10⁻¹⁶ | 21.2 | — |
| 3b | 5.53 × 10⁻¹⁷ | 2.72 × 10⁻¹⁶ | 4.91 | 4.50 (27) |
| 3b-TF | 2.24 × 10⁻¹⁷ | 6.92 × 10⁻¹⁶ | 30.9 | — |
Under the steady-state approximation, governed by the pulse width much longer than the relaxation time,60 all the time derivatives are set to zero. The assumption is valid for nanosecond pulses, in the case of phthalocyanines with singlet lifetime in the order of picoseconds.61 Once eqn (9) has been solved, the intensity-dependent absorption coefficient becomes:
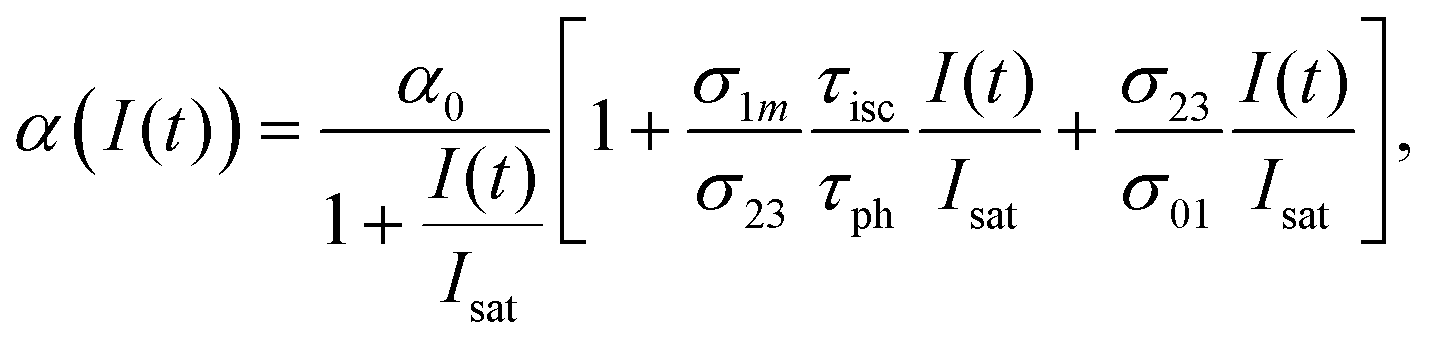 | (10) |
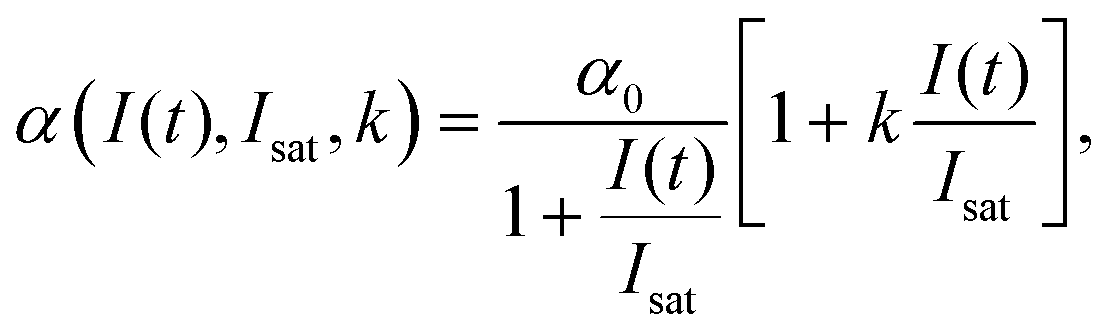 | (11) |
High k and βeff, low Fsat and low α0 values are characteristic of a superior optical limiter.50 The value of α(I(t), Isat, k) has to be substituted back into eqn (9) before application of the nonlinear absorption coefficient to open-aperture Z-scan experimental data. At this stage, the possible integration over a homogeneous sample of thickness L leads to a transcendental equation for transmission T as T = Iout/Iin, derived as:62
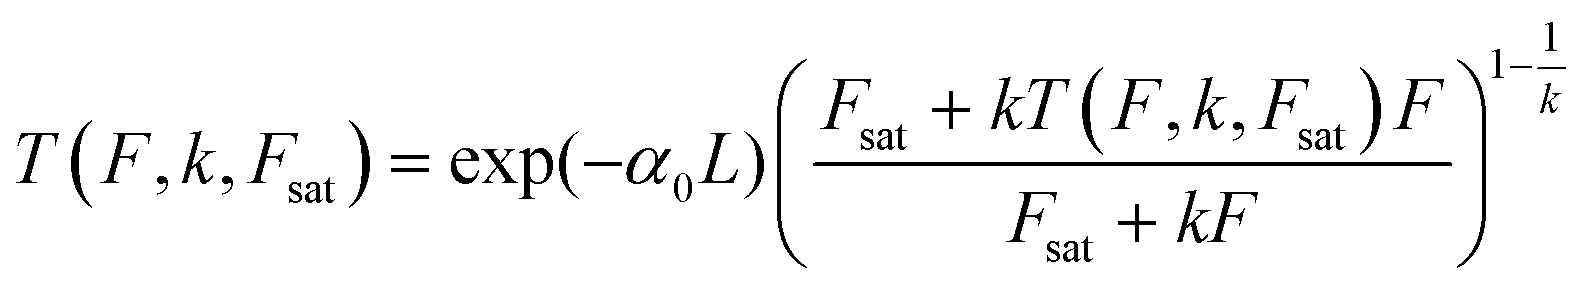 | (12) |
The nonlinear optical parameters obtained by fitting the Z-scan experimental signatures of complex 2 and its respective thin film 2-TF39 are listed in Table 1.
The concentration of complexes 3a and 3b at 3.0 × 10⁻⁴ M or 1.869 × 10¹⁷ molecules per cm3 has been selected to match that of complex 2,39 noting that due to saturation, the concentration of particles exceeded this value. This concentration selection creates fair comparison of nonlinear optical parameters for all complexes under investigation. These complexes showed no aggregation when concentration studies aimed at determining the molar extinction coefficients were performed. The open aperture Z-scan signatures of complexes 3a and 3b were more pronounced than those for complex 2 with 3b being the best, Fig. 4A. This enhanced nonlinear behavior can be attributed to a more extensive π-conjugated system in complexes 3a and 3a (Fig. 4A) compared to that of complex 2 and is in agreement with the nonlinear behavior proposed for the extension of π-electron system and heavy lanthanide central metal.57,63–65 Complexes 3a-TF and 3b-TF (Fig. 4C) exhibited better open aperture Z-scan signals that complexes 3a and 3b, respectively. This observation is similar to that of 2-TF in comparison to complex 2. The σ23 values for complexes 3a, 3b, 3a-TF and 3b-TF are shown in Table 1. The σ23 value is greater for the complex than for its respective thin film, evidencing the observed open aperture Z-scan signatures. It can also be observed that the σ01 values for 3a and 3b are larger than those for 3a-TF and 3b-TF, hence the larger k values of 3a-TF and 3b-TF in comparison to those of 3a and 3b but smaller than those of 2-TF (Table 2). This observation can be attributed to the aggregation which may have directly affected the ground state and the excited state absorption cross sections of thin films in different ways. Similarly, the k values for complexes 3a and 3b are smaller than those for complex 2.
| Complex | Im[χ(3)] (esu) | γ (esu) | Ilim (J cm−2) | Reduction of TNorm (%) |
|---|---|---|---|---|
| a — denotes that the Ilim value could not be determined due to less than 50% reduction in TNorm. | ||||
| 2 | 3.77 × 10⁻¹⁰ | 9.74 × 10⁻²⁸ | — | 48 |
| 2-TF | 1.19 × 10⁻⁸ | 3.07 × 10⁻²⁶ | 0.31 | 82 |
| 3a | 2.00 × 10⁻⁹ | 5.17 × 10⁻²⁷ | 0.34 | 66 |
| 3a-TF | 9.82 × 10⁻⁹ | 25.3 × 10⁻²⁷ | 0.10 | 82 |
| 3b | 4.91 × 10⁻⁹ | 12.7 × 10⁻²⁷ | 0.10 | 80 |
| 3b-TF | 1.25 × 10⁻⁸ | 32.2 × 10⁻²⁷ | 0.03 | 90 |
The scanning electron microscopy (SEM) images of 2-TF,39 3a-TF and 3b-TF were obtained for the samples on thin glass slides. These images were taken after performing the open aperture Z-scan experiments (discussed below) where the hazard of the laser beams pumped into the thin films could possibly result in holes and wrinkles on the surface as result of thermal effect. The SEM images of thin films were taken by focusing on the irradiated area (Fig. S6†). As can be seen in the SEM images (Fig. S6†), the surface exhibited homogeneity without any holes or pockets, proving that thin films were thermally stable.
 | (13) |
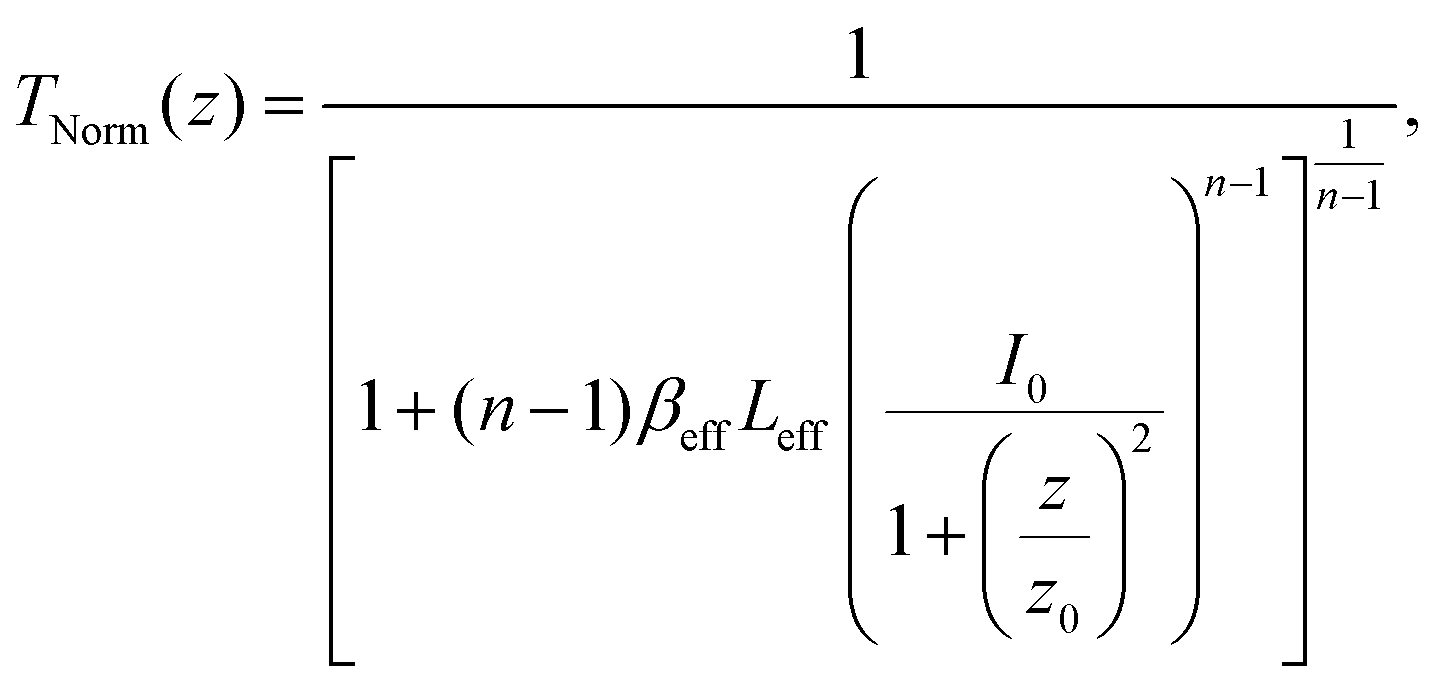
 (λ = wavelength of the laser beam and w0 = beam waist (∼2.56 × 10⁻³ cm) at the focus (z = 0)), respectively. We have applied this model to complexes 2 and 2-TF.39 When using eqn (13), there is an assumption that the higher singlet excited-state absorption cross section contributes significantly to the reverse saturable absorption and, therefore, only applies to complex 2 and its thin film, which exhibit lack of triplet–triplet absorption. To accommodate optical limiters, the mechanisms of which are governed by strong triplet–triplet absorption at the nanosecond regime, the effective absorption coefficient can be calculated according to the previously reported theory.67 The normalized transmittance in this case is defined by:
 | (14) |
 | (15) |
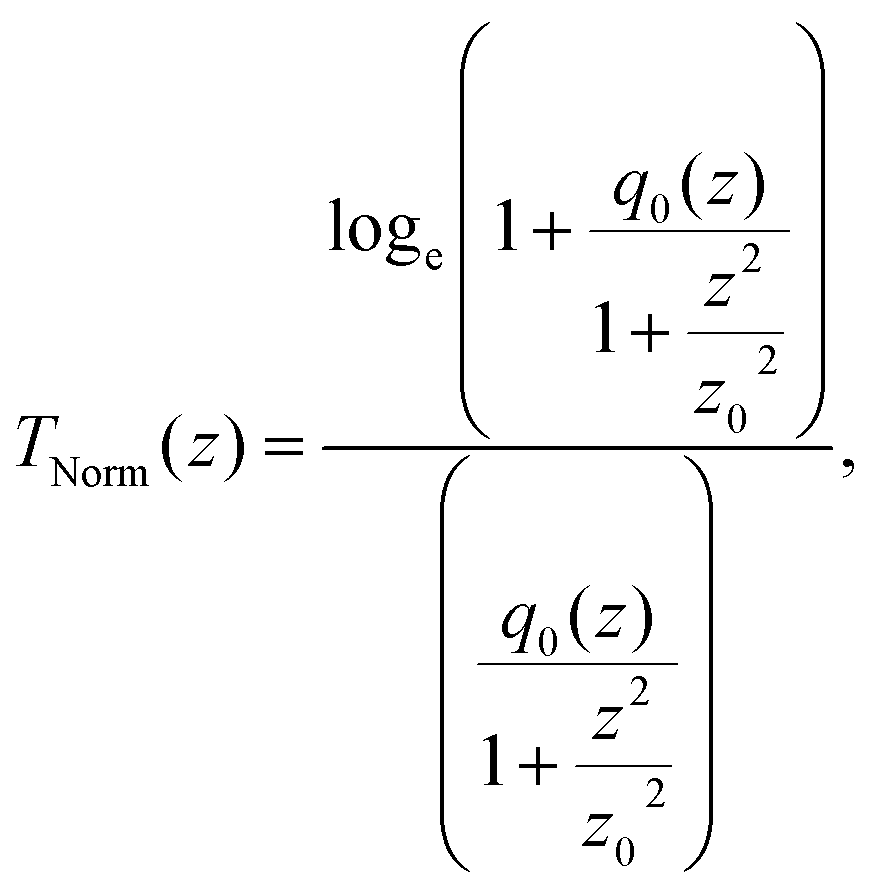
Other theories68,69 can, therefore, be applied to calculate the effective absorption coefficient. TNorm is then given by:
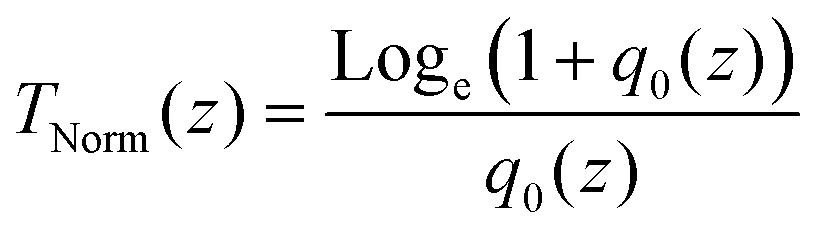 | (16) |
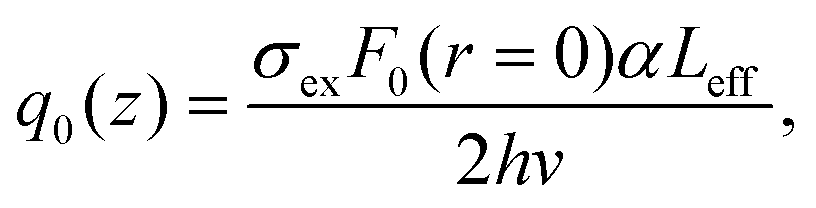
In this expression, q0(z) given by:
 | (17) |
In eqn (13), (15) and (17), Leff is commonly described as the effective thickness of the sample given by
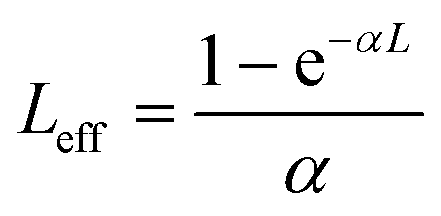 | (18) |
In eqn (18), α and L are the linear absorption coefficient and the thickness of the sample, respectively.
Once the βeff values were obtained applying the nonlinear regression techniques, we could easily compute the proportionality third order optical susceptibility (Im[χ(3)] in esu), which is an imaginary component, via eqn (19):70,71
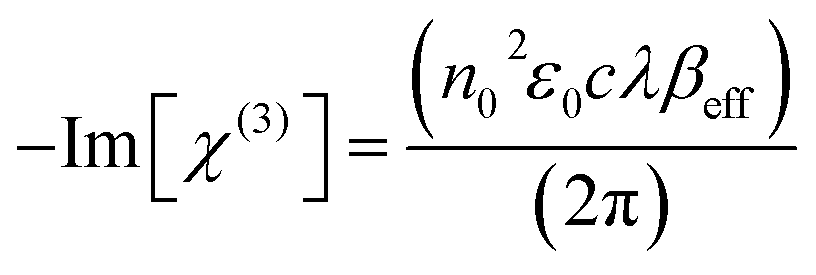 | (19) |
In eqn (19), c and n0, respectively, are the speed of light in vacuum and the linear refractive index, ε0 is the permittivity of free space and λ is the wavelength of the laser light.
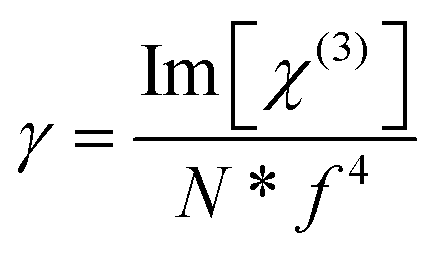
At the molecular level, there is a direct correlation between Im[χ(3)] (in esu) and the hyperpolarizability γ (which provides the nonlinear absorption per mole of the sample), expressed by eqn (20):71,72
 | (20) |
N* = CmolNA (Cmol is the concentration of the active species in the excited state in mol) and f denotes the Lorenz local field factor, given by eqn (21):
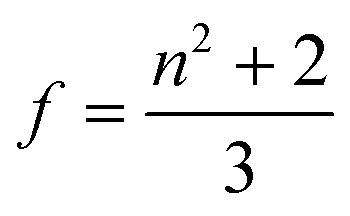 | (21) |
The optical limiting threshold is also very important to consider since it indicates the degree by which the transmission of the laser beam intensities to be received by an optical sensor being protected by an optical limiter is reduced. By definition, limiting intensity (Ilim in J cm−2) is the incident fluence at which the output fluence is half (50%) of the linear transmission.73,74 This refers to any strong attenuation, experienced by the photodiode detector when the nonlinear optical material responds to the intense beams. Such attenuations are an indication of an optical limiting effect. The Ilim values for complexes 2,39 3a and 3b as well as 2-TF,39 3a-TF and 3b-TF were, therefore, obtained at 50% of the linear transmittance by plotting the TNorm (related to the output fluence) against the input fluence (Fig. 6).
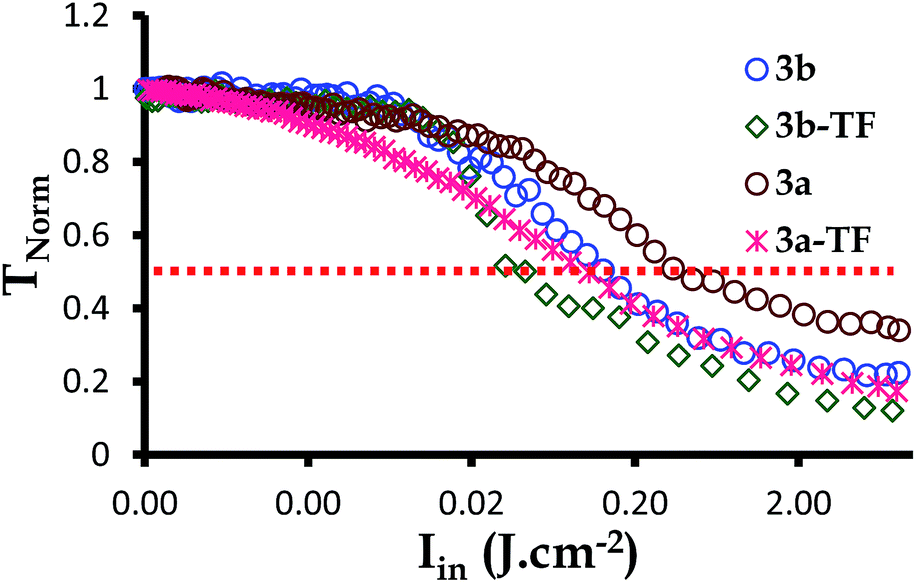 | ||
| Fig. 6 The normalized transmittance against the incident intensity plot for complexes 3a and 3b as well as their respective thin films 3a-TF and 3b-TF at the nanosecond regime. | ||
As indicated before, complex 2 (ref. 39) exhibits a different nonlinear optical mechanism to that shown by complexes 3a and 3b. This makes it difficult to compare Im[χ(3)] and the γ values, calculated for these complexes. However, given the fact that complexes 3a and 3b were designed by sandwiching the Cd(II) ion between the complex 2 molecules, the change in the mechanism is still very interesting. Despite the challenge of comparing the Z-scan experimental data, the assumptions made when deriving eqn (1)–(3) and (6)–(8) help ignore other possible contributions made by Sm and T3. This way, we can look at the pure processes that govern the nonlinear optical behavior observed for each complex. Although the behavior of complex 2 is based on two-photon absorption (2-PA) while for complex 3a and 3b on one-photon absorption (1-PA), the σ1m and σ23 values should be comparable. The open-aperture Z-scan experimental data shows the trend: σ23 ≫ σ1m, with σ23 for complex 3b greater than that of complex 3a, hence the better open aperture Z-scan signatures for complexes 3a and 3b compared to complex 2. The calculated Im[χ(3)] and γ values follow a similar trend, with those of complexes 3a and 3b (Table 2) being higher than those of complex 2. For 2-TF, the Im[χ(3)] and γ values (Table 2) were very high and larger than those of complex 2, as discussed previously.39 Similarly the Im[χ(3)] and γ values for 3a-TF and 3b-TF are greater than those calculated for complexes 3a and 3b. This observation is in agreement with what has been observed before.42,75 However, the Im[χ(3)] and γ values for 3a-TF were smaller than those of 2-TF. This overturn in the observed pattern of the Im[χ(3)] and γ values is attributed to aggregation,69 which is a known phenomenon in thin films that can affect the excited state absorption, thereby, deactivating the populated excited state. This observation is subjective since aggregation does not always exist in thin films, resulting in gigantic Im[χ(3)] and γ values.39 Overall, the better nonlinear optical behavior observed for complexes 3a and 3b compared to that of complex 2 in solution is a good indication of the influence of the extension of π-electron system at the same concentration. This is also evident when comparing complex 3a to complex 3b, with 3a being the best optical limiter. The Ilim values were also analyzed. These values are meant to be minimal for an efficient optical limiter.
Complexes 3a and 3b reduced the TNorm by more than 50%, hence the signals in Fig. 6 and the Ilim values in Table 2. The Ilim value is lower for complex 3b, indicating that complex 3b is a better optical limiter than complex 3a. A similar behavior was observed for 3a-TF and 3b-TF, with 3b-TF being a better optical limiter in solid state. In general, all thin films exhibited a reduction in TNorm of greater than 90% and lower Ilim values than those in solution.
4. Conclusions
A rare type of new n-tuple decker phthalocyanines were investigated for optical limiting applications. The broad absorption spectra of complexes 3a and 3b exhibited larger ground state absorption cross sections, which compete with the triplet excited state absorption cross sections, resulting in the lowest k values for complexes 3a and 3b compared to that of complex 2. It was also observed that the lack of interaction between the H2Pc ligands of complexes 3a and 3b enhanced the triplet population, thus changing the NLO mechanisms that control the reverse saturable absorption. More importantly, the extension of the π-electron system results in enhanced open aperture Z-scan signatures, also evidenced by the large Im[χ(3)] and γ values for complexes 3a and 3b compared to those of 2.Author contributions
The manuscript was written through contributions of all authors. All authors have given approval to the final version of the manuscript.Funding sources
Department of Science and Technology (DST) and National Research Foundation (NRF).Conflicts of interest
There are no conflicts of interest to declare.Abbreviations
| NLO | Nonlinear optical |
| DMF | Dimethyl formamide |
| DCM | Dichloromethane |
| DBU | 1,8-Diazabicyclo[5.4.0]undec-7-ene |
| TCB | 1,2,4-Trichlorobenzene |
| THF | Tetrahydrofuran |
| MS | Mass spectrum |
| NMR | Nuclear magnetic resonance |
| XTD | X-ray diffraction |
| UV-Vis | Ultraviolet-visible |
| TCSPC | Time correlated single photon counting |
| ESR | Electron spin resonance |
| SEM | Scanning electron microscope |
| LnPc2 | Lanthanide bisphthalocyanine |
| H2Pc | Unmetallated phthalocyanine |
| BV | Blue valence |
| VEH | Valence-Effective Hamiltonian |
| RSA | Reverse saturable absorption |
| TNorm | Normalized transmittance |
| ISC | Intersystem crossing |
| Ilim | Limiting threshold |
| 2-PA | Two-photon absorption |
| 1-PA | One-photon absorption |
Acknowledgements
This study was supported by the Department of Science and Technology (DST) and National Research Foundation (NRF), South Africa, through DST/NRF South African Research Chairs Initiative for Professor of Medicinal Chemistry and Nanotechnology (UID 62620), NRF (UID 110789), and by Rhodes University.References
- J. Jiang and D. K. P. Ng, A Decade Journey in the Chemistry of Sandwich-Type Tetrapyrrolato-Rare Earth Complexes, Acc. Chem. Res., 2009, 42(1), 79–88 CrossRef CAS.
- M. Gonidec, I. Krivokapic, J. Vidal-Gancedo, E. S. Davies, J. McMaster, S. M. Gorun and J. Veciana, Highly Reduced Double-Decker Single-Molecule Magnets Exhibiting Slow Magnetic Relaxation, Inorg. Chem., 2013, 52, 4464–4471 CrossRef CAS.
- M. Gonidec, D. B. Amabilino and J. Veciana, Novel double-decker phthalocyaninato terbium(III) single molecule magnets with stabilised redox states, Dalton Trans., 2012, 41, 13632–13639 RSC.
- H. Wang, B.-W. Wang, Y. Bian, S. Gao and J. Jiang, Single-molecule magnetism of tetrapyrrole lanthanide compounds with sandwich multiple-decker structures, Coord. Chem. Rev., 2016, 306, 195–216 CrossRef CAS.
- M. Mannini, F. Bertani, C. Tudisco, L. Malavolti, L. Poggini, K. Misztal, D. Menozzi, A. Motta, E. Otero, P. Ohresser, P. Sainctavi, G. G. Condorelli, E. Dalcanale and R. Sessoli, Magnetic behaviour of TbPc2 single-molecule magnets chemically grafted on silicon surface, Nat. Commun., 2014, 5, 4582 CrossRef CAS PubMed.
- T. Fukuda, W. Kuroda and N. Ishikawa, Observation of long-range f–f interactions between two f-electronic systems in quadruple-decker phthalocyanines, Chem. Commun., 2011, 47, 11686–11688 RSC.
- S. Lee and T. Ogawa, Molecular Design for Single-molecule Magnetism of Lanthanide Complexes, Chem. Lett., 2017, 46, 10–18 CrossRef CAS.
- H. Shang, S. Zeng, H. Wang, J. Dou and J. Jiang, Peripheral Substitution: An Easy Way to Tuning the Magnetic Behavior of Tetrakis(phthalocyaninato) Dysprosium(III) SMMs, Sci. Rep., 2015, 5, 8838 CrossRef CAS.
- H. Wang, K. Qian, D. Qi, W. Cao, K. Wang, S. Gao and J. Jiang, Co-crystallized fullerene and a mixed (phthalocyaninato)(porphyrinato) dysprosium double-decker SMM, Chem. Sci., 2014, 5, 3214–3220 RSC.
- H. Wang, K. Wang, J. Tao and J. Jiang, Twist angle perturbation on mixed (phthalocyaninato)(porphyrinato) dysprosium(III) double-decker SMMs, Chem. Commun., 2012, 48, 2973–2975 RSC.
- D. Xie, W. Pan, Y. D. Jiang and Y. R. Li, Erbium bis[phthalocyaninato] complex LB film gas sensor, Mater. Lett., 2003, 57(16–17), 2395–2398 CrossRef CAS.
- T. Basova, I. Jushina, A. G. Gürek, V. Ahsen and A. K. Ray, Use of the electrochromic behaviour of lanthanide phthalocyanine films for nicotinamide adenine dinucleotide detection, J. R. Soc., Interface, 2008, 5(24), 801–806 CrossRef CAS PubMed.
- M. G. Martín, M. L. Rodríguez-Méndez and J. A. de Saja, Films of Lutetium Bisphthalocyanine Nanowires As Electrochemical Sensors, Langmuir, 2010, 26(24), 19217–19224 CrossRef PubMed.
- J. Padilla and W. E. Hatfield, Correlation between π-orbital overlap and conductivity in bis-phthalocyaninato lanthanides, Inorg. Chim. Acta, 1991, 185(2), 131–136 CrossRef CAS.
- R. Jones, A. Krier and K. Davidson, Structure, electrical conductivity and electrochromism in thin films of substituted and unsubstituted lanthanide bisphthalocyanines, Thin Solid Films, 1997, 298(1–2), 228–236 CrossRef CAS.
- W. Göpel, Phthalocyanine prototype interfaces: Their importance for designing chemical sensor and molecular electronic devices, Synth. Met., 1991, 41(3), 1087–1093 CrossRef.
- W. Cao, H. Wang, X. Wang, H. K. Lee, D. K. P. Ng and J. Jiang, Constructing Sandwich-Type Rare Earth Double-Decker Complexes with N-Confused Porphyrinato and Phthalocyaninato Ligands, Inorg. Chem., 2012, 51, 9265–9272 CrossRef CAS PubMed.
- K. E. Sekhosana and T. Nyokong, Synthesis of ytterbium bisphthalocyanines: Photophysicochemical properties and nonlinear absorption behavior, Opt. Mater., 2014, 37, 139–146 CrossRef CAS.
- K. E. Sekhosana, M. H. Manyeruke and T. Nyokong, Synthesis and optical limiting properties of new lanthanide bis- and tris-phthalocyanines, J. Mol. Struct., 2016, 1121, 111–118 CrossRef CAS.
- A. I. Plekhanov, T. V. Basova, R. G. Parkhomenko and A. G. Gürek, Nonlinear optical properties of lutetium and dysprosium bisphthalocyanines at 1550 nm with femto- and nanosecond pulse excitation, Opt. Mater., 2017, 64, 13–17 CrossRef CAS.
- L.-C. Liu, C.-H. Tai, A. T. Hu and T.-H. Wei, Nonlinear optical properties of lutetium bisphthalocyanine and its application for an optical switch, J. Porphyrins Phthalocyanines, 2004, 8(7), 984–988 CrossRef CAS.
- S. Saydam, E. Yılmaz, F. Bağcı, H. G. Yağlioğlu, A. Elmalı, B. Salih and Ö. Berkaroğlu, Synthesis, characterization and electrochemical and optical limiting properties of novel CoII, CuII and double-decker LuIII phthalocyanines, Eur. J. Inorg. Chem., 2009, 14, 2096–2103 CrossRef.
- M. M. Ayhan, A. Singh, C. Hirel, A. G. Gürek, V. Ahsen, E. Jeanneau, I. Ledoux-Rak, J. Zyss, C. Andraud and Y. Bretonnière, ABAB homoleptic bis (phthalocyaninato) lutetium (III) complex: toward the real octupolar cube and giant quadratic hyperpolarizability, J. Am. Chem. Soc., 2012, 134(8), 3655–3658 CrossRef CAS PubMed.
- B. Ren, N. Sheng, B. Gu, Y. Wan, G. Rui, C. Lv and Y. Cui, Changing optical nonlinearities of homoleptic bis(phthalocyaninato) rare earth praseodymium double-decker complexes by the redox reaction, Dyes Pigm., 2017, 139, 788–794 CrossRef CAS.
- A. B. Karpo, V. E. Pushkarev, V. I. Krasovskii and L. G. Tomilova, Z-scan study of nonlinear absorption in novel lanthanide bis-phthalocyanines, Chem. Phys. Lett., 2012, 554, 155–158 CrossRef CAS.
- K. E. Sekhosana, M. Shumba and T. Nyokong, Electrochemical and non-linear optical behavior of a new neodymium double-decker phthalocyanine, Polyhedron, 2017, 138, 154–160 CrossRef CAS.
- N. Sheng, D. Liu, B. Gu, J. He and Y. Cui, A series of homoleptic bis(phthalocyaninato) rare earth sandwich complexes with large two-photon absorption cross-section, Dyes Pigm., 2015, 122, 346–350 CrossRef CAS.
- N. Sheng, Z. Yuan, J. Wang, W. Chen, J. Sun and Y. Bian, Third-order nonlinear optical properties of sandwich-type mixed (phthalocyaninato)(porphyrinato) europium double- and triple-decker complexes, Dyes Pigm., 2012, 95, 627–631 CrossRef CAS.
- J. Kan, Y. Chen, D. Qi, Y. Liu and J. Jiang, High-Performance Air-Stable Ambipolar Organic Field-Effect Transistor Based on Tris(phthalocyaninato) Europium(III), Adv. Mater., 2012, 24, 1755–1758 CrossRef CAS PubMed.
- Y. Chen, W. Su, M. Bai, J. Jiang, X. Li, Y. Liu, L. Wang and S. Wang, High Performance Organic Field-Effect Transistors Based on Amphiphilic Tris(phthalocyaninato) Rare Earth Triple-Decker Complexes, J. Am. Chem. Soc., 2005, 127, 15700–15701 CrossRef CAS PubMed.
- M. Urdampilleta, S. Klyatskaya, J.-P. Cleuziou, M. Ruben and W. Wernsdorfer, Supramolecular spin valves, Nat. Mater., 2011, 10, 502–506 CrossRef CAS PubMed.
- R. Sun, L. Wang, J. Tian, X. Zhang and J. Jiang, Self-assembled nanostructures of optically active phthalocyanine derivatives. Effect of central metal ion on the morphology, dimension, and handedness, Nanoscale, 2012, 4, 6990–6996 RSC.
- G. Lu, Y. Chen, Y. Zhang, M. Bao, Y. Bian, X. Li and J. Jiang, Morphology Controlled Self-Assembled Nanostructures of Sandwich Mixed (Phthalocyaninato)(Porphyrinato) Europium Triple-Deckers. Effect of Hydrogen Bonding on Tuning the Intermolecular Interaction, J. Am. Chem. Soc., 2008, 130, 11623–11630 CrossRef CAS PubMed.
- N. Kılınç, D. Atilla, A. G. Gürek, Z. Z. Öztürk and V. Ahsen, Volatile organic compounds sensing properties of tetrakis(alkylthio)-substituted lutetium(III) bisphthalocyanines thin films, Talanta, 2009, 80, 263–268 CrossRef PubMed.
- P. Zhu, Y. Wang, M. Ren, X. Zhao and X. Zhang, Sandwich-type heteroleptic tris(phthalocyaninato) terbium triple-decker: Single crystal structure and self-assembled nanostructures, Inorg. Chim. Acta, 2012, 392, 10–15 CrossRef CAS.
- T. Fukuda, T. Biyajima and N. Kobayashi, A Discrete Quadruple-Decker Phthalocyanine, J. Am. Chem. Soc., 2010, 132, 6278–6279 CrossRef CAS.
- H. Wang, N. Kobayashi and J. Jiang, New Sandwich-Type Phthalocyaninato–Metal Quintuple-Decker Complexes, Chem.–Eur. J., 2012, 18, 1047–1049 CrossRef CAS PubMed.
- H. Wang, D. Qi, Z. Xie, W. Cao, K. Wang, H. Shang and J. Jiang, A sandwich-type phthalocyaninato metal sextuple-decker complex: synthesis and NLO properties, Chem. Commun., 2013, 49, 889–891 RSC.
- K. E. Sekhosana, R. Nkhahle and T. Nyokong, The Primary Demonstration of Exciton Coupling Effects on Optical Limiting Properties of Blue Double-Decker Lanthanide Phthalocyanine Salts, ChemistrySelect, 2018, 3, 6671–6682 CrossRef CAS.
- K. E. Sekhosana, E. Antunes, S. Khene, S. D'Souza and T. Nyokong, Fluorescence behavior of glutathione capped CdTe@ZnS quantum dots chemically coordinated to zinc octacarboxy phthalocyanines, J. Lumin., 2013, 136, 255–264 CrossRef CAS.
- K. E. Sekhosana, E. Antunes and T. Nyokong, Glutathione capped CdTe@ZnS quantum dots–zinc tetracarboxy phthalocyanine conjugates: Fluorescence behavior studies in comparison with zinc octacarboxy phthalocyanine, Polyhedron, 2013, 54, 294–299 CrossRef CAS.
- K. E. Sekhosana and T. Nyokong, The nonlinear absorption in new lanthanide double decker pyridinebased phthalocyanines in solution and thin films, Opt. Mater., 2015, 47, 211–218 CrossRef CAS.
- H. Shang, H. Wang, W. Li and J. Jiang, Vibrational spectroscopy of phthalocyanine and naphthalocyanine in sandwich-type (na)phthalocyaninato and porphyrinato rare earth complexes. Part 15: The IR characteristics of phthalocyanine in homoleptic tetrakis(phthalocyaninato) rare earth(III)-cadmium(II) quadruple-deckers, Vib. Spectrosc., 2013, 69, 8–12 CrossRef CAS.
- E. Orti and J.-L. Brédas, Photoelectron Spectra of Phthalocyanine Thin Films: A Valence Band Theoretical Interpretation, J. Am. Chem. Soc., 1992, 114(22), 8669–8675 CrossRef CAS.
- V. Lemaur, M. Steel, D. Beljonne, D. Brédas and J.-L. Cornil, Photoinduced Charge Generation and Recombination Dynamics in Model Donor/Acceptor Pairs for Organic Solar Cell Applications: A Full Quantum-Chemical Treatment, J. Am. Chem. Soc., 2005, 127(16), 6077–6088 CrossRef CAS PubMed.
- T. C. VanCott, Z. Gasyna, P. N. Schatz and M. E. Boyle, Magnetic circular dichroism and absorption spectra of lutetium bis(phthalocyanine) isolated in an argon matrix, J. Phys. Chem., 1995, 99(13), 4820–4830 CrossRef CAS.
- C. Dunfold, B. Williamson and E. Krausz, Temperature-Dependent Magnetic Circular Dichroism of Lutetium Bisphthalocyanine, J. Phys. Chem. A, 2000, 104(16), 3537–3543 CrossRef.
- N. Ishikawa, O. Ohno and Y. Kaizu, Electronic states of bis(phthalocyaninato)lutetium radical and its related compounds: the application of localized orbital basis set to open-shell phthalocyanine dimers, J. Phys. Chem., 1993, 97(5), 1004–1010 CrossRef CAS.
- N. Ishikawa and Y. Kaizu, Disappearance of MCD A term in the fingerprint band of cation radicals of phthalocyanine metal complexes, Chem. Phys. Lett., 2001, 339(1–2), 125–132 CrossRef CAS.
- N. Ishikawa, O. Ohno, Y. Kaizu and H. Kobayashi, Localized orbital study on the electronic structure of phthalocyanine dimers, J. Phys. Chem., 1992, 96(22), 8832–8839 CrossRef CAS.
- M. Calvete, G. Y. Yang and M. Hanack, Porphyrins and phthalocyanines as materials for optical limiting, Synth. Met., 2004, 141(3), 231–243 CrossRef CAS.
- C. R. Mendonça, L. Gaffo, L. Misoguti, W. C. Moreira, O. N. Oliveira and S. C. Zilio, Characterization of dynamic optical nonlinearities in ytterbium bis-phthalocyanine solution, Chem. Phys. Lett., 2000, 323(3–4), 300–304 CrossRef.
- E. Orti, J. L. Bredas and C. Clarisse, Electronic structure of phthalocyanines: theoretical investigation of the optical properties of phthalocyanine monomers, dimers, and crystals, J. Chem. Phys., 1990, 92(2), 1228–1235 CrossRef CAS.
- M. Kandaz, A. T. Bilgiçli and A. Altındal, Metal ion sensing functional mono and double-decker lanthanide phthalocyanines: Synthesis, characterization and electrical properties, Synth. Met., 2010, 160(1–2), 52–60 CrossRef CAS.
- K. E. Sekhosana, E. Amuhaya and T. Nyokong, Nonlinear optical behavior of neodymium mono- and bi-nuclear phthalocyanines linked to zinc oxide nanoparticles and incorporated into poly acrylic acid, Polyhedron, 2016, 105, 159–169 CrossRef CAS.
- S. Sapra and D. D. Sarma, Simultaneous control of nanocrystal size and nanocrystal-nanocrystal separation in CdS nanocrystal assembly, Pramana, 2005, 65(4), 565–570 CrossRef CAS.
- L. De Boni, L. Gaffo, L. Misoguti and C. R. Mendonça, Nonlinear absorption spectrum of ytterbium bis-phthalocyanine solution measured by white-light continuum Z-scan technique, Chem. Phys. Lett., 2006, 419(4–6), 417–420 CrossRef CAS.
- M. G. Vivas, E. G. R. Fernandes, M. L. Rodríguez-Méndez and C. R. Mendonca, Study of singlet excited state absorption spectrum of lutetium bisphthalocyanine using the femtosecond Z-scan technique, Chem. Phys. Lett., 2012, 531, 173–176 CrossRef CAS.
- S. M. O'Flahery, S. V. Hold, M. J. Cook, T. Torres, Y. Chen, M. Hanack and W. J. Blau, Molecular Engineering of Peripherally and Axially Modified Phthalocyanines for Optical Limiting and Nonlinear Optics, Adv. Mater., 2003, 15(1), 19–32 CrossRef.
- M. Yüksek, A. Elmali, M. Durmuş, H. G. Yağlioğlu, H. Ünver and T. Nyokong, Good optical limiting performance of indium and gallium phthalocyanines in a solution and co-polymer host, J. Opt., 2010, 12(1), 015208 CrossRef (9 pages).
- J. S. Shirk, R. G. S. Pong, R. S. Flom, H. Heckmann and M. Hanack, Effect of Axial Substitution on the Optical Limiting Properties of Indium Phthalocyanines, J. Phys. Chem. A, 2000, 104(7), 1438–1449 CrossRef CAS.
- S. M. O'Flaherty, J. J. Doyle and W. J. Blau, Numerical Approach for Optically Limited Pulse Transmission in Polymer-Phthalocyanine Composite Systems, J. Phys. Chem. B, 2004, 108, 17313–17319 CrossRef.
- L. Chen, R. Hu, J. Xu, S. Wang, X. Li, S. Li and G. Yang, Third-order nonlinear optical properties of a series of porphyrin-appended europium(III) bis(phthalocyaninato) complexes, Spectrochim. Acta, Part A, 2013, 105, 577–581 CrossRef CAS PubMed.
- R. Rousseau, R. Aroca and M. L. Rodríguez-Méndez, Extended Hückel molecular orbital model for lanthanide bisphthalocyanine complexs, J. Mol. Struct., 1995, 356, 49–62 CrossRef CAS.
- M. J. F. Calvete, D. Dini, S. R. Flom, M. Hanack, R. G. S. Pong and J. S. Shirk, Synthesis of a Bisphthalocyanine and its Nonlinear Optical properties, Eur. J. Org. Chem., 2005, 16, 3499–3509 CrossRef.
- R. L. Sutherland, Handbook of Nonlinear Optics, Second Edition, Revised and expanded, Marcel Dekker, New York, NY, 2003 Search PubMed.
- G. L. Wood, M. J. Miller and A. G. Mott, Investigation of tetrabenzporphyrin by the Z-scan technique, Opt. Lett., 1995, 20(9), 973–975 CrossRef CAS PubMed.
- M. Sheik-Bahae, A. A. Said, T.-H. Wei, D. J. Hagan and E. W. Van Stryland, Sensitive measurement of optical nonlinearities using a single beam, IEEE J. Quantum Electron., 1990, 26, 760–769 CrossRef CAS.
- C. H. Kwak, Y. L. Lee and S. G. Kim, Analysis of asymmetric Z-scan measurement for large optical nonlinearities in an amorphous As2S3 thin film, J. Opt. Soc. Am. B, 1999, 16(4), 600–604 CrossRef CAS.
- P. Zhao, S. Xu, Z. Y. Li and F.-S. Zhang, Nonlinear Optical Properties of Novel Polymeric Rare Earth Phthalocyanine Studied Using Picosecond Z-Scan Technique, Chin. Phys. Lett., 2008, 25(6), 2058–2061 CrossRef CAS.
- Y. Chen, M. Hanack, Y. Araki and O. Ito, Axially modified gallium phthalocyanines and naphthalocyanines for optical limiting, Chem. Soc. Rev., 2005, 34(6), 517–529 RSC.
- D. Dini and M. Hanack, in The Porphyrin Handbook: Physical Properties of Phthalocyane-based Materials, ed. K. M. Kadish, K. M. Smith and R. Guilard, Academic Press, USA, 2003, vol. 17, p. 22 Search PubMed.
- S. V. Rao, Femtosecond and continuous-wave nonlinear optical properties of (H2)2SnPc, Sn(OH)2Pc, and Sn(Cl)2Pc studied using Z-scan technique, Proc. SPIE, 2009, 7197, 719715 CrossRef.
- Y. Chen, L. Gao, M. Feng, L. Gu, N. He, J. Wang, Y. Araki, W. J. Blau and O. Ito, Photophysical and Optical Limiting Properties of Axially Modified Phthalocyanines, Mini-Rev. Org. Chem., 2009, 6(1), 55–65 CrossRef CAS.
- K. E. Sekhosana and T. Nyokong, The optical limiting of blue and green ytterbium double-decker phthalocyanines in solution and in poly(acrylic acid) as thin films, Inorg. Chim. Acta, 2016, 450, 87–91 CrossRef CAS.
Footnotes |
| † Electronic supplementary information (ESI) available: NMR spectra of complexes 2 and 3a, mass spectra 3a and 3b, ESR spectra of 2, 3a and 3b, and SEM images of 2-TF, 3a-TF and 3b-TF. See DOI: 10.1039/c9ra01836k |
| ‡ These authors contributed equally. |
| This journal is © The Royal Society of Chemistry 2019 |