 Open Access Article
Naphthalimide-based optical turn-on sensor for monosaccharide recognition using boronic acid receptor†
Sanaz Seraja,
Shohre Rouhani *ab and
Farnoush Faridbod
 c
c
aDepartment of Organic Colorants, Institute for Color Science and Technology, Tehran, Iran. E-mail: rouhani@icrc.ac.ir
bCenter of Excellence for Color Science and Technology (CECST), Institute for Color Science and Technology, Tehran, Iran
cCenter of Excellence in Electrochemistry, School of Chemistry, College of Science, University of Tehran, Tehran, Iran
First published on 7th June 2019
Abstract
A highly selective and sensitive fluorescent sensor for the determination of fructose is developed. The fluorescent sensor was prepared by incorporating a new naphthalimide dye with a planar structure as a selectophore and graphene oxide (GO) nanoplatelets as a quencher for rapid optical detection of fructose. The designed probe, made with the high fusion loop-containing dye, along with the GO nanoplatelets, detected fructose over the other monosaccharides very well. The proposed sensor displays a linear response range of 7 × 10⁻⁵ to 3 × 10⁻² M with a low limit of detection of 23 × 10−6 M in solution at pH 7.4. This sensor shows a good selectivity towards fructose with respect to other saccharides. The proposed sensor was then applied to the determination of fructose in human plasma with satisfactory results.
1. Introduction
Fructose is one of the main sweeteners in the human diet, whose amount consumed in foods and drinks is increasing every day. Consumption of foods rich in sucrose and high-fructose corn syrup (HFCI) used to produce food and beverages is accompanied by the entry of large quantities of fructose and glucose into the human body.1 Excessive use of fructose is a very important factor in increasing the risk of developing metabolic syndrome in humans. Metabolic syndrome is a series of conditions including high blood sugar, abnormal levels of cholesterol and triglyceride, and elevated blood pressure, leading to an increased risk of heart attack, stroke and diabetes mellitus. Clinical evidence suggests that there is a correlation between high fructose intake and metabolic syndrome. Fructose increases the level of uric acid in the body, which reduces the endothelial nitric oxide level (the main cause of insulin action in the body). This decline leads to insulin resistance and other manifestations of metabolic syndrome.2,3 For the above reasons, measuring fructose levels via simple chemical techniques is very important.4 Over the past few decades, fluorescence organic molecules have been used for selective recognition of a wide range of analytes.5–7 Development of small molecules which are able to interact with carbohydrates requires special recognition moieties capable of strong binding under physiological conditions. Among various materials for saccharide detection, use of boronic acid and its derivatives has attracted a great deal of attention because of their strong interactions with sugars.8–11 The fluorescence of boronic acid-based compounds changes when attached to sugars. According to this property, many studies have been conducted on the use of boronic acid derivatives in conjunction with other recognition moieties for saccharide detection.12–16 The benefits of boronic acid derivatives in comparison with other species mentioned include (1) easily reversible regeneration by an acid wash; (2) stability allowing them to be used in harsh condition.17,18 1,8-Naphthalimide is a D–π–A chromophore with good chemical and optical properties. By placing different substitutions on the naphthalimide core, these dye substances can act via different mechanisms including photoinduced electron transfer (PET) and internal charge transfer (ICT). Naphthalimide dye has absorption and emission in the visible region with a large Stokes' shift to prevent self-quenching.19–24 The synthesis and application of various types of naphthalimide dyes in different optical and electrochemical sensors had already been undertaken by our team.25–29 In designing a fluorescent probe to detect saccharides, there is an important challenge which is related to minor fluorescence variations when attached with diols like sugars. In order to overcome this problem, a system should be designed in which the primary fluorescence emission of the dye is very low, and when the diol is attached, changes in fluorescence emission differ from optical sensors identified for saccharide detection. Therefore, several strategies are adopted in the present work. The first is to use graphene oxide. This material derived from carbon atoms with sp2 structure has different oxygen species at its surface. Because of having these functional groups at its surface, it has the ability to be conjugated with a variety of molecules. As a result, graphene oxide is a high efficient quencher for fluorescence dyes.30–37 For achieving the quenching effect by graphene oxide, the fluorescence dye should be absorbed onto the graphene sheet. The greater the planar structure of the dye, the higher the possibility of absorption through the graphene surface via π–π stacking forces will be. For this reason, a new naphthalimide dye was synthesized with a planar structure and high fusion loops. In addition to being absorbed onto the graphene surface, increasing the rings in the naphthalimide fluorophore can lead to greater electron absorption from the electron-rich center at the lower part of the molecule to create a probe with low fluorescence intensity based on PET mechanism inhibition. The increasing rigidity and planar structure of the dye and graphene quenching efficiency in monosaccharide detection are discussed, further.2. Experimental
2.1. Materials and methods
Acenaphthene, piperazine, bromomethylphenyl boronic acid pinacol ester and ortho-phenylenediamine were purchased from Merck Chemical Co. The graphene oxide nanoplatelets were purchased from Nano SANY Co. with a commercial code of US 7906, CAS 7732-18-5. The following experiments were conducted in PBS/DMF (99![[thin space (1/6-em)]](https://www.rsc.org/images/entities/char_2009.gif) :
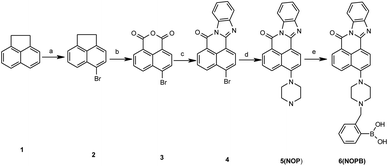
:![[thin space (1/6-em)]](https://www.rsc.org/images/entities/char_2009.gif) 1). This research was performed in accordance with the Declaration of Helsinki and with approval of the ethics board of the University of Tehran. Human plasma sample used in this work was from a healthy volunteer with O-positive blood who signed an informed consent form in the Iranian Blood Transfusion Center. It was a fresh frozen plasma (product code: E070V00). Fluorescence quantum yield was evaluated based on the absorption and fluorescence spectra, using fluorescein as a reference (φst = 0.95).34 The melting points (m.p.) were measured using a PerkinElmer (USA) Pyris 6 differential scanning calorimeter. Synthesis procedure for the fluorescent probe (NOPB) is illustrated in Scheme 1 (synthesis procedure and characterization of compounds are given in ESI S1 and S2†).
1). This research was performed in accordance with the Declaration of Helsinki and with approval of the ethics board of the University of Tehran. Human plasma sample used in this work was from a healthy volunteer with O-positive blood who signed an informed consent form in the Iranian Blood Transfusion Center. It was a fresh frozen plasma (product code: E070V00). Fluorescence quantum yield was evaluated based on the absorption and fluorescence spectra, using fluorescein as a reference (φst = 0.95).34 The melting points (m.p.) were measured using a PerkinElmer (USA) Pyris 6 differential scanning calorimeter. Synthesis procedure for the fluorescent probe (NOPB) is illustrated in Scheme 1 (synthesis procedure and characterization of compounds are given in ESI S1 and S2†).
2.2. Sample preparation
Identically weighted amount of compound NOPB was dissolved in DMF to obtain 10−3 M stock solutions. The NOPB solution was obtained by performing dilutions of the stock solution by PBS at a concentration of 10−5 M. The function of probes towards sugars was evaluated by using 0.5 ml of a fluorescence probe and 0.5 ml saccharide solution (from various concentrations of 0.0005 to 2 M) and 2 ml PBS solution.10 The pH of the solution was adjusted with NaOH or HCl aqueous solution. NOPB–GO complex was formed by boronic acids (NOPB) with various concentrations of graphene oxide.383. Results and discussion
3.1. Solvent effect on the NOPB probe
Naphthalimide dyes containing nitrogen substitutes at the C-4 position have good optical and chemical properties. The naphthalimide derivatives are grouped into three sub-units; donor, spacer, and fluorophore or acceptor based on PET mechanism inhibition.39 In the design of these dye materials, amine groups are generally used as donors.40,41 Due to the binding to sugars and the involvement of the donor group, the fluorescence properties of the molecule are altered, which are studied further. NOPB probe (λabs = 417 nm, ε = 9000 M−1 cm−1) was designed based on the PET mechanism inhibition. The Stokes' shift of NOPB is sufficient to prevent self-quenching. The quantum yield of this compound is 0.052 (fluorescein was employed as the reference). This low amount is due to the PET mechanism in the system, which leads to the detection of saccharides under physiological conditions. The synthesized probe was water soluble due to hydroxyl groups and thus had a high combining ability. In order to select the appropriate solvent for further investigation, the results of the investigation of the absorption behaviour of the dye synthesized in solvents with different polarities show that with increasing solubility change from non-polar to polar mode, the increase in maximum absorption wavelength was observed (13 nm). The effect of solvent polarity was also studied on the fluorescence emission and absorption changes in solvents with different polarization (from polar to nonpolar) (Fig. 1). NOPB compound displayed distinctly solvatochromic fluorescence spectra: the emission of NOPB shifted from 503 nm in toluene to 519 nm in PBS. The results revealed that the quantum yield of the examined probe was low due to the presence of PET mechanism in polar solvents such as methanol, water (PBS), and DMF. Also, in polar solvents, the level of orbital energy (HOMO) was lowered compared to nonpolar solvents, resulting in a stronger PET mechanism. Therefore, in order to obtain a lower quantum yield and increase the probability of fluorescence emission, the PBS solution was used further in this study.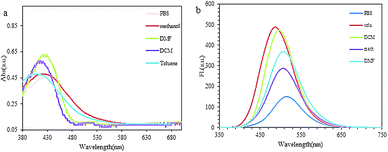 | ||
| Fig. 1 (a) Absorption spectra of NOPB in various solvents, (b) emission spectra of NOPB in various solvents. | ||
3.2. NOPB–GO composite
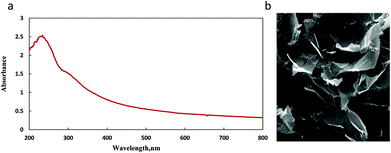
The graphene oxide utilized in the previous research of this group was also used here.42 UV-vis absorption and SEM techniques were applied to characterize the used commercial GO. UV-vis absorption spectrum of GO aqueous dispersion (15 μg mL−1) was obtained as shown in Fig. 2a. It showed maximum absorption at 229 nm due to the π–π* transition of aromatic C![[double bond, length as m-dash]](https://www.rsc.org/images/entities/char_e001.gif) C bonds and a shoulder around 300 nm due to the n–π* transition of C
C bonds and a shoulder around 300 nm due to the n–π* transition of C![[double bond, length as m-dash]](https://www.rsc.org/images/entities/char_e001.gif) O bonds. SEM technique investigated a planar morphology for GO Fig. 2b.
O bonds. SEM technique investigated a planar morphology for GO Fig. 2b.
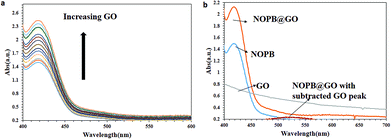
According to the tests, the employed graphene oxide had a multi-layered structure. Graphene oxide has hydroxyl, carboxyl, and epoxy functional groups at its surface. In response to these groups, graphene oxide has a tendency toward water molecules relative to the reduced graphene oxide which is easily dispersed in aqueous media. After stabilizing GO in PBS solution,30 various concentrations of graphene oxide were added to the NOPB solution. The quenching process was clearly observed. The fluorescence molecule acts as a donor while graphene oxide functions as the acceptor molecule. With absorbance of fluorescence probe onto the graphene oxide surface, the fluorescence emission of the NOPB dye is quenched. The absorption of the dye was investigated by UV-vis technique. As displayed in Fig. 3, increasing graphene oxide concentrations elevated the absorption rate. The fluorescence quenching phenomena can be examined by static and dynamic mechanisms. In a static mechanism, a complex is formed between the fluorescence probe and the quencher, which is non-fluorescence. In a dynamic mechanism, however, the quencher penetrates into the fluorophore molecule during its placement at the excited level. Due to the diffusion and collision with the fluorophore, the molecule returns to its ground state level and does not emit fluorescence. Therefore, by subtracting the absorbance of blank NOPB from that of the NOPB/GO solution, a new peak was observed at 523 nm. The new peak was probably due to the complex formation between NOBP dye and graphene oxide. Based on these results, the quenching mechanism may have proceeded through a static process.
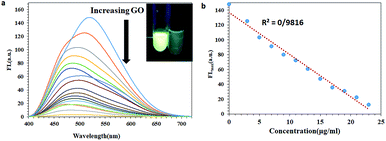
The fluorescence emission changes of the NOPB probe in the presence of various amounts of graphene oxide are illustrated in Fig. 4. With the elevation of the concentration of graphene oxide, fluorescence emission decreased significantly. This confirms the absorption of dye onto the graphene oxide surface. Further, the fluorescence emission of graphene oxide was also investigated. No fluorescence emission for graphene oxide was observed (results not shown here). Thus, it can be concluded that the quenching has been the result of the interaction between the fluorescence NOPB probe and graphene oxide and not due to resorption or inner filter effect. As can be observed, a good linear response was observed within the range of (0–23 μg ml−1).
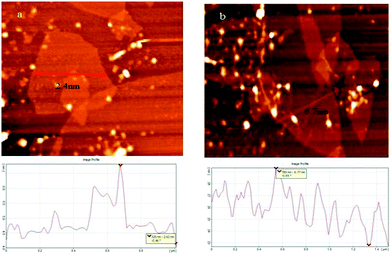
AFM technique was used to show the dye affinity for adsorption on the GO surface by measure the thickness of the GO flakes. Whereas the height of unmodified GO was 2.4 nm, that of GO stacked with NOPB dye increases up to 6.7 nm. The latter indicates the absorption of dye on GO sheets. Note that all intersected surface areas of NOPB/GO showed similar thickness increase of about 4 nm, pointing out that the dye was densely distributed on the GO surface (Fig. 5).
Raman spectroscopy additionally corroborated the composition of the composite (Fig. 6): the ratio of the intensity of the D band (1361 cm−1) to that of the G band (1600 cm−1) of NOPB/GO (0.96) is greater than that bare GO (0.91), which means that the C sp2 hybridization of the former is increased upon stacking with the aromatic compound.30
From another perspective, the quenching process was examined by other mechanisms including energy transfer and electron transfer. For this study, the graphene oxide absorption was plotted alongside the fluorescence emission of the NOPB probe where no overlap was observed. The energy levels of HOMO and LUMO of the NOPB dye and band gap of graphene oxide were determined by cyclic voltammetry and UV-vis spectroscopy (Fig. 7). The LUMO and HOMO energy levels were −2.641 eV and −5.523 eV, respectively. The valence bond of graphene oxide was reported to be −4.7 eV. Therefore, the electron is transferred from the excited state of fluorescence dye to graphene oxide. Accordingly, the quenching mechanism seems to be based on the electron transfer process.
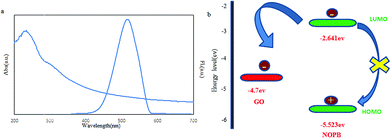 | ||
| Fig. 7 (a) Fluorescence emission of NOPB probe and UV-vis absorption of graphene oxide, (b) electron transfer from energy levels between NOPB dye and graphene oxide. | ||
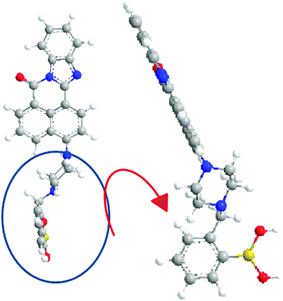
In order to create a stronger interaction between the fluorescence dye and graphene oxide, NOPB dye with a planar structure and high fusion loops were designed in relation to other dye molecules used along with graphene oxide43–46(Scheme 2). The NOPB dye can be absorbed onto the GO platelets via π–π stacking and electrostatic forces. Further, the quenching efficiency by GO can be calculated using formula η = (F0 − F)/F0 × 100 where F is the fluorescence intensity in the presence of GO and F0 shows the fluorescence intensity without the GO. With absorbance of the NOPB dye onto the GO surface, the quenching efficiency was 97.96%.
3.3. Spectral response of NOPB and NOPB–GO probes toward sugars
The boronic acid has the ability to react with diols, where the reaction is highly pH-dependent. Accordingly, changes in the fluorescence emission of probes in the presence and absence of sugar were investigated within the pH range of 2–12 (Fig. 8). In the absence of sugar, the fluorescence emission of the NOPB probe showed a modest reduction with elevation of pH from acidic to an alkaline state. In the acidic solution, the highest fluorescence emission was observed for both probes. Indeed, they were protonated in an acidic solution in the absence of sugar. Also, PET mechanism was cut off and fluorescence increased. With the rise of pH, the fluorescence emission diminished due to the establishment of the PET mechanism. In the presence of sugar, the greatest fluorescence emission was observed under neutral conditions that were predisposed to alkaline conditions. According to the studies, with an elevation of pH and alkalization of the media, the rate of conversion of trigonal form to tetrahedral anion form increased.47,48 As a result, more tetrahedral anions form at this pH (7.4) and the reaction proceeds with the ester formation.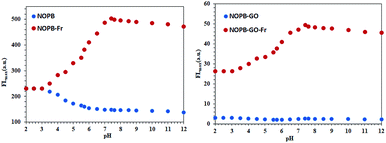 | ||
| Fig. 8 Fluorescence emission changes relative to the pH in the presence and absence of sugars in 50 mM PBS, [fructose] = 50 mM, λex = 391 nm. (a) NOPB (5 μM); (b) NOPB–GO (5 μM). | ||
On the other hand, the pKa diminishes when it reacts with sugar. The pKa for NOPB probe was 6, which was related to a boronic acid moiety. After reacting with sugar, it declined to 3.8. Also, the observed pKa for NOPB/GO complex was 5.7 which after the reaction with sugar, it declined to 3.5 confirming the response to sugar. By binding the boron atom to the diol and producing the boronate ester, the acidity of boron atom increases and as a result, the pKa of the system decreases. On the other hand, by binding a boron atom to a saccharide, a more electron deficient boron atomic center is created and the O–B–O bonded angle becomes narrower, resulting in the formation of a strong bond between boron atom and amine group. In addition, FL spectroscopy was conducted to investigate the interaction between the boronic acid and the diol. As revealed in Fig. 9, with an elevation of the fructose concentration, the fluorescence emission of the NOPB probe increased. The addition of fructose led to a 6.5-fold growth in fluorescence emission. By forming an N⋯B bond, the electron transfer from the amine to the fluorophore ring dropped, the PET was cut off, and the fluorescence emission increased.
The emission changes in the presence of various amounts of fructose are demonstrated in Fig. 10. With establishment, the covalent bond between boronic acid and diol of fructose, the hydrophilic property of the new NOPB–fructose complex was enhanced, resulting in the detachment of the probe from the GO surface (weakening π-stacking force). With the release of the complex from the GO surface, the GO quenching effect onto the NOPB probe diminished where the fluorescence emission of the NOPB probe would be ON. The percentage of recovery was calculated by [(F1 − F)/(F0 − F)], where F is the fluorescence emission of NOPB in the presence of GO, F0 represents the fluorescence emission of NOPB without GO, and F1 denotes the fluorescence emission of NOPB–GO with fructose. According to the calculation, the recovery ratio was 62.3%. The incomplete fluorescence recovery suggests that it is still part of NOPB attached to the GO surface due to strong π-stacking force.
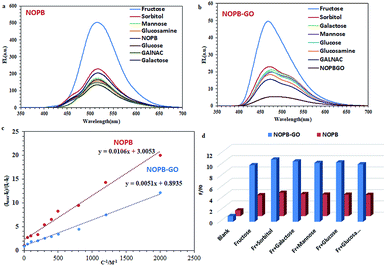
The results of Fig. 11, demonstrate the good selectivity to fructose for the NOPB and NOPB–GO probes. Further, 10 replicate measurements of 100 μM fructose yielded a reproducible intensity with relative standard deviations (R.S.D.) of 1.27% and 1.58%. To investigate the selectivity of both probes, the fluorescence emission changes were evaluated in the presence of different sugars. As revealed in Fig. 8, in the presence of 50 mM fructose, sorbitol, mannose, glucose, galactose, and glucosamine, the designed probes showed fluorescent changes only toward fructose. As can be seen, no significant changes were observed in the case of other saccharides. In the following, the binding interaction between probes and fructose was studied via association constant measurement (eqn (1)).40
| (Imax − I0)/(Ic − I0) = 1 + (KC)−1 | (1) |
Six independent optical sensors were examined for reproducibility test of the sensor.49 Fluorescence change of NOPB probe and NOPB–GO sensor (5 μM) in the presence of 10 mM of fructose in PBS (50 mM, pH 7.4, λex = 418 nm) were measured in 5 replicate (Fig. 12) and showed the R.S.D. of 1.8% and 1.9% respectively, demonstrating the good repeatability and reproducibility of the optical sensor.
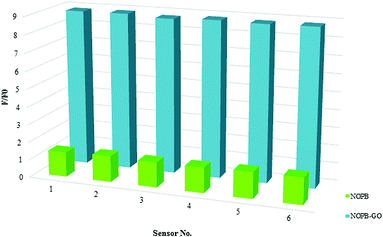 | ||
| Fig. 12 Fluorescence change of different NOPB probes and NOPB–GO sensors (5 μM) in the presence of 10 mM of fructose in PBS (50 mM, pH 7.4, λex = 418 nm). | ||
The linear response for NOPB probe lied within the range of [0.13–50 mM] with a regression R2 = 0.99. Limit of detection for NOPB is 0.040 mM. Also, the linear response ranges for NOPB–GO probe was within the range of [0.07–30 mM] with a regression R2 = 0.99. Limit of detection for NOPB/GO is 0.023 mM. The association constant, the detection limit (LOD) and quantum yield (Qy) in the presence of fructose were measured and shown in Table S3-1.† LOD by using 3Sb/K equation was measured where K is the slope of the fitted area and Sb is the standard deviation of the blank measurement of 10 times. Fluorescence enhancement and association constant results show that both probes are selective and sensitive to fructose than other saccharides.
According to the synthesized naphthalimide probes to detect fructose10,12,43 (Table S3-2†), fluorescence probes designed in this work, have in most respects, improved the performance compared to recent works. From 2006 onwards, further researches were carried out on the placement of boronic acid at the bottom of the naphthalimide ring and increased the fluorescence emission by binding to the target molecule based on the PET mechanism. In this research, a new naphthalimide probe with high fusion loops and the planar structure was designed for the first time to detect saccharides in comparison with previous works. The presence of fused loops increases the rigidity of the structure and creates a stronger PET in the system. Based on the PET mechanism, the initial fluorescence emission of the NOPB probe is low and when bonded with the target molecule (saccharides), the fluorescence emission increases significantly (Scheme 3). The design of this probe comes in many aspects, including the π-deficient aromatic system and one or two basic side chains, some of which shown promising antitumor activities50
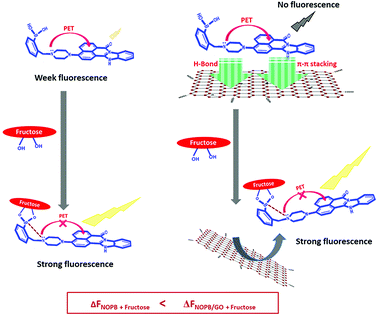 | ||
| Scheme 3 Schematic representation of signal generation for designed fluorogenic probe (NOPB) by fructose binding and its signal amplification in the presence of GO. | ||
In the NOPB probe, more fused loops were designed, which, in addition to reinforcing the PET mechanism, increased the planar structure by enhancing the ability to interact more strongly with GO. In the same way, James and colleagues43 used a naphthalimide dye including flexible chain and relatively high quantum yield with graphene oxide for fructose detection, resulting in a detection limit of 2.7 mM. In this work, the use of a more rigid dye with a large planar structure with a lower quantum yield enabled us to obtain a detection limit of 23 μm alongside graphene oxide. This suggests that the use of stronger PET structure and higher planar structure could lead to a more precise recognition of these biomolecules. As a result, a new generation of probes for saccharide detection with drug activity and a lower detection limit has the potential to create and study. The use of these high rigid structures in other fields such as fluorescence carbohydrate imaging and drug delivery is currently under study in our team whose results will be reported in the near future.
3.4. Analytical performance of the optical probes
To evaluate the feasibility of the sensing method for the detection of real samples, human plasma samples were spiked with different concentrations of fructose. The good recoveries indicated that our system was capable of the detection of fructose in real samples. The recovery values were close to 100%, indicating that the proposed method was helpful for fluorescence fructose detection (Table 1).| Sample | Added (mM) | Found (mM) | Recovery (%) (n = 5) |
|---|---|---|---|
| Plasma sample | 5 | 4.91 ± 0.04 | 98.2 |
| 15 | 15.16 ± 0.03 | 101.1 | |
| 25 | 25.92 ± 0.05 | 103.7 |
4. Conclusion
Two fluorescence probes were designed and used to detect saccharides based on OFF–ON enhancement mechanism. In both probes, the presence of the piperazine group strengthened the interaction between boronic acid and amine. Fluorescence probe with a planar and more rigid structure coupled with a stronger PET mechanism inhibition was applied for better absorption onto the graphene oxide to evaluate fluorescence enhancement with saccharides. In response to binding to the saccharide, fluorescence emission grew remarkably in both probes. In the NOPB–GO probe, NOPB was adsorbed on the GO surface and its fluorescence emission was totally quenched. In the presence of fructose, NOPB bound to diol of fructose and detached from the GO surface. NOPB–GO probe, in comparison with NOPB probe, showed a remarkable fluorescence enhancement (up to 35-fold fluorescence enhancement) with a lower detection limit. Thus, designing NOPB–GO nano platform probe can introduce a new generation of boronic-based monosaccharide optical sensor thanks to its simplicity and high selectivity to monosaccharides. Other nano platform sensors based on the carbon-based materials with higher sensitivity and selectivity are under research in our team.Conflicts of interest
There are no conflicts to declare.Acknowledgements
This project was supported by the Center of Excellence for Color Science and Technology (CECST), Institute for Color Science and Technology, Tehran-Iran and University of Tehran. Thanks, for providing us with good facilities to complete this work.Notes and references
- C. Tran, Nutrients, 2017, 9, 356 CrossRef PubMed.
- B. Ruizang and G. F. Yu, J. Nutr. Food Sci., 2018, 8, 65 Search PubMed.
- S. A. Hannou, D. E. Haslam, N. M. McKeown and M. A. Herman, Clin. Invest., 2018, 128, 545 CrossRef PubMed.
- H. Li, H. M. Byers and A. Diaz, Mol. Genet. Metab., 2018, 123, 428 CrossRef CAS PubMed.
- G. Saito, D. Velluto and M. Resmini, R. Soc. Open Sci., 2018, 5, 172137 CrossRef CAS PubMed.
- H. Lu, C. Yong, C. Han and Z. Hong, Chem. Pap., 2016, 70, 685 Search PubMed.
- Q. Li, T. Kamra and L. Ye, Chem. Commun., 2016, 52, 12237 RSC.
- W. Zhai, L. Male and J. S. Fossey, Chem. Commun., 2017, 53, 2218 RSC.
- S. D. Bull, M. G. Davidson, J. M. H. Van Denelson, J. S. Fossey, A. T. A. Jenkins, Y. Jiang, Y. Kubo, F. Marken, K. Sakurai, J. Zhao and T. D. James, Acc. Chem. Res., 2013, 46, 312 CrossRef CAS PubMed.
- S. Trupp, A. Schweitzer and J. Mohr, Org. Biomol. Chem., 2006, 4, 2965 RSC.
- D. Dechtrirat, N. Gajovic-Eichelmann, F. Wojcik, L. Hartmann, F. Bier and F. W. Scheller, Biosens. Bioelectron., 2014, 58, 1 CrossRef CAS PubMed.
- H. Chen, L. Li, H. Guo, X. Wang and W. Qin, RSC Adv., 2015, 5, 13805 RSC.
- Y. J. Huang, W. J. Quyang, X. Wu, Z. Li, J. S. Fossey, T. D. James and Y. B. Jiang, J. Am. Chem. Soc., 2013, 135, 1700 CrossRef CAS PubMed.
- L. N. Neupane, S. Y. Han and K. H. Lee, Chem. Commun., 2014, 50, 5854 RSC.
- J. S. Hansen, M. Ficker, J. F. Peterson, J. B. Christensen and T. Hoeg-Jensen, Tetrahedron Lett., 2013, 54, 1849 CrossRef CAS.
- B. Xu, J. Hou, K. Li, Z. Lu and X. Yu, Chin. J. Chem., 2015, 33, 101 CrossRef CAS.
- Z. Guo and I. Shin, Chem. Commun., 2012, 48, 5956 RSC.
- C. H. Wang and H. Zhu, Analyst, 2013, 138, 7146 RSC.
- S. M. Dimov, N. I. Georgiev, A. Asiri and V. Bojinov, J. Fluoresc., 2014, 24, 1621 CrossRef CAS PubMed.
- A. I. Said, N. I. Georgiev and V. B. Bojinov, Spectrochim. Acta, Part A, 2018, 196, 76 CrossRef CAS PubMed.
- Y. Tachapermpon and P. Piyanuch, J. Chem., 2015, 22, 9 Search PubMed.
- X. Qian and Y. Xiao, Chem. Commun., 2010, 46, 6418 RSC.
- S. Zheng, P. L. M. Lynch, E. Terence, S. Thomas and P. de. Silva, Photochem. Photobiol. Sci., 2012, 11, 1675 RSC.
- W. Grzesiak and B. Brycki, Molecules, 2012, 17, 12427 CrossRef CAS PubMed.
- P. Alaei, S. Rouhani and K. Gharanjig, Prog. Color, Color. Coat., 2013, 6, 87 Search PubMed.
- S. Seraj and S. Rouhani, J. Fluoresc., 2017, 27, 1877 CrossRef CAS PubMed.
- S. Rouhani and S. Haghgoo, Sens. Actuators, B, 2015, 209, 957 CrossRef CAS.
- P. Alaie, S. Rouhani, K. Gharanjig and J. Ghasemi, Spectrochim. Acta, Part A, 2012, 90, 85 CrossRef PubMed.
- S. Rouhani and F. Nahavandifard, Sens. Actuators, B, 2014, 197, 185 CrossRef CAS.
- E. Narvaez and A. Merkoci, Adv. Mater., 2012, 24, 3298 CrossRef PubMed.
- C. H. Lu and H. Yang, Angew. Chem., Int. Ed., 2009, 48, 4785 CrossRef CAS PubMed.
- X. Wu, Y. Xing, K. Zeng, K. Huber and J. X. Zhao, Langmuir, 2018, 34, 603 CrossRef CAS PubMed.
- O. Salihoglu, N. Kakenov, O. Balci, S. Balci and C. Kocabas, Sci. Rep., 2016, 6, 33911 CrossRef CAS PubMed.
- J. Balapanuru and J. X. Yang, Angew. Chem., Int. Ed., 2010, 49, 6549–6553 CrossRef CAS PubMed.
- H. Dong and W. Gao, Anal. Chem., 2010, 82, 5511–5517 CrossRef CAS PubMed.
- S. H. He and B. Song, Adv. Funct. Mater., 2010, 20, 453–459 CrossRef CAS.
- J. Kim and L. J. Cote, J. Chem. Phys., 2010, 132, 260–267 CAS.
- H. L. Zhang, X. L. Wei, Y. Zang, J. Y. Cao, S. Liu, X. P. He, Q. Chen, Y. T. Long, J. Li, G. R. Chen and K. Chen, Adv. Mater., 2013, 25, 4097 CrossRef CAS PubMed.
- X. Qian, Y. Xiao, Y. Xu and W. Zhu, Chem. Commun., 2010, 46, 6418 RSC.
- G. F. Whyte, R. Vilar and R. Woscholski, J. Chem. Biol., 2013, 6, 161 CrossRef PubMed.
- L. Zhu, S. H. Shabbir, M. Gray, V. M. Lynch, S. Sorey and E. V. Anslyn, J. Am. Chem. Soc., 2006, 128, 1222 CrossRef CAS PubMed.
- S. Lajevardi Esfahani, S. Rouhani and Z. Ranjbar, Surf. Interfaces, 2017, 9, 218 CrossRef.
- X. Sun, B. Zhu, D. K. J. Ji, Q. Chen, X. P. He, G. R. Chen and T. D. James, ACS Appl. Mater. Interfaces, 2014, 6, 10078 CrossRef CAS PubMed.
- J. L. Chen, X. P. Yan, K. Meng and S. F. Wang, Anal. Chem., 2011, 83, 8787 CrossRef CAS PubMed.
- S. He, B. Song, D. Li, C. Zhu, W. Qi, Y. Wen, L. Wang, S. Song, H. Fang and C. Fan, Adv. Funct. Mater., 2010, 20, 453 CrossRef CAS.
- Y. W. He, Y. Feng, L. Wei Kang and X. Liang Li, New J. Chem., 2018, 42, 11147 RSC.
- Y. Furikado, T. Nagahato, T. Okamoto, T. Sugaya, S. Iwatsuki, M. Inamo, H. D. Takagi, A. Odani and K. Ishihara, Chem. –Eur. J., 2014, 20, 1 CrossRef PubMed.
- E. Watanabe, Ch. Miyamoto, A. Tanaka, K. lizuka, S. Iwatsuki, M. Inamo, H. D. Takagi and K. Ishihara, Dalton Trans., 2013, 42, 8446 RSC.
- D. Zhao, H. Song, L. Hao, X. Liu, L. Zhang and L. LV, Talanta, 2013, 107, 133 CrossRef CAS PubMed.
- U. H. Sk, A. S. P. Gowda, M. A. Crampsie, J. K. Yun, T. E. Spratt, S. Amin and A. K. Sharma, Eur. J. Med. Chem., 2011, 46, 3331 CrossRef CAS PubMed.
Footnote |
| † Electronic supplementary information (ESI) available. See DOI: 10.1039/c9ra01757g |
| This journal is © The Royal Society of Chemistry 2019 |

