 Open Access Article
Mesoporous carbon prepared by etching halloysite nanotubes (HNTs) with pyrrole as a precursor for a sulfur carrier of superior lithium–sulfur batteries
Jiuqing Liu *,
Cheng Wang,
Jinqiang Cui,
Jie Li,
Qihou Li,
Meng Liu and
Yang Xi
School of Metallurgy and Environment, Central South University, Changsha, Hunan 410083, China. E-mail: jiuqing_liu@163.com; Tel: +86 0731 88710171
First published on 23rd April 2019
Abstract
Using pyrrole as a carbon precursor and halloysite nanotubes (HNT) as a templating agent, mesoporous carbon (MC) was prepared by template etching and combined with sulfur as a composite cathode for lithium–sulfur batteries. The mesoporous carbon/sulfur (MC/S) composite cathode exhibits a first cycle discharge specific capacity of 1355 mA h g−1 at 0.2C, and the utilization rate of active sulfur can reach 80.9%. Even after 500 cycles, the discharge specific capacity still remains at 496.9 mA h g−1 when tested at 0.5C. Furthermore, the hollow groove structure present in the MC/S electrode provides a large number of active sites for electrochemical reactions. The prepared MC/S composite cathode not only has a high discharge specific capacity and good cycle stability, but also increases the energy density of the lithium–sulfur battery. Therefore, this preparation process of MC is more conducive to practical application.
1. Introduction
In the lithium–sulfur battery system, the dissolution and shuttling of the charge–discharge products in the electrolyte will cause irreversible loss of the active material, and the electrode structure will be destroyed during the electrochemical reaction, which will seriously affect the cycle performance and life of the lithium–sulfur battery.1–3 At present, the actual energy density of lithium–sulfur batteries is much lower than the theoretical value, which seriously hinders large-scale industrial application.4,5 As one of the most important components among the entire lithium–sulfur battery system, the cathode has become a popular research hotspot.As the cathode material for lithium–sulfur batteries, elemental sulfur inevitably has problems of capacity reduction and shuttle effect.6 The application of conductive carbon,7–9 conductive polymer,10,11 oxide12,13 and other materials with different morphologies14 can not only improve the conductivity of the sulfur electrode, but also improve the utilization rate of the active sulfur. In addition, it can also inhibit the dissolution and migration of polysulfides, and reduce the deposition of irreversible insoluble discharge products (e.g. Li2S2 and Li2S) on the electrode.15 These advantages of composite sulfur electrode can effectively improve the rate performance of lithium–sulfur battery and extend its cycle life.
Carbon-based materials are abundant in type, good in electrical conductivity, and stable in chemical and physical properties. Therefore, the most common way to improve the electrochemical performance of lithium–sulfur battery is to combine carbon materials with sulfur as the cathode.16 The microporous carbon/sulfur composite cathode has a rich microporous structure, which can improve the cycle performance of lithium–sulfur battery.17,18 However, the microporous carbon has a weaker sulfur loading capacity, which reduces the high energy density advantage of lithium–sulfur battery.
Mesoporous carbon is a new class of non-silicon based mesoporous materials (2 nm < pore size < 50 nm) with large specific surface area (∼up to 2500 m2 g−1) and pore volume (∼up to 2.25 cm3 g−1), while having good conductivity, thermal stability, good biocompatibility, corrosion resistance, etc., and widely used in adsorption, separation, catalysis, electrochemical energy storage and other fields.19–25 Due to the increase of pore volume, composite cathode with mesoporous carbon as sulfur carrier has higher sulfur loading capacity. When mesoporous carbon was originally used as a matrix material for carbon–sulfur composite and applied to lithium–sulfur battery, it was proved to have a higher initial discharge specific capacity, but the capacity attenuated rapidly as the battery cycle progressed.26 For this reason, CMK-3 mesoporous carbon was used to prepare composite cathode for the first time. The assembled battery can still exhibit good electrochemical performance when the composite cathode contains 70% sulfur.27 Furthermore, researchers prepared the ordered mesoporous carbons (OMCs) by template synthesis method and used it as the carrier of sulfur. The first cycle discharge capacity of the lithium–sulfur battery reached 1200 mA h g−1, and it showed good stability even after 100 cycles.28 The above results show that the OMCs can exhibit superior electrochemical performance as a sulfur-carrying matrix for lithium–sulfur battery compared to microporous carbon. In addition, the assembled batteries exhibited similar electrochemical performance after the pores of the mesoporous carbon matrix were completely filled with elemental sulfur. It has also been found that when the pores were not completely filled with sulfur, the batteries exhibited more excellent cycle performance. This difference is because the transfer of electrolyte and ions was hindered when the pores are completely filled.29
Due to the advantages of small mass, large specific surface area and large pore volume, the use of mesoporous carbon as a sulfur carrier can solve the problems of lithium–sulfur battery to some extent. What's more, the discharge specific capacity and cycle stability of the lithium–sulfur battery can be further improved without sacrificing energy density. In this paper, using pyrrole as a carbon precursor and halloysite nanotubes (HNT) as a templating agent, the mesoporous carbon (MC) was prepared by template etching and combined with sulfur as the cathode for lithium–sulfur battery.
2. Experimental section
2.1. Preparation of mesoporous carbon (MC)
(1) 450 mL deionized water and 6 mL concentrated hydrochloric acid (GR, Sinopharm Chemical Reagent Co., Ltd., China) were mixed to prepare an acid solution. 3 g halloysite nanotubes (HNT, AR, Beijing, China) was added to the above solution for magnetic stirring and ultrasonic dispersion to make it uniformly dispersed. Then, 0.5 mL pyrrole (AR, Arkema Inc., Beijing, China) was added followed by magnetic stirring for 12 h (marked as solution A). (2) 2.27 g ammonium persulfate (APS, AR, Sinopharm Chemical Reagent Co., Ltd., China) was mixed with 1 mL concentrated hydrochloric acid to prepare 100 mL acid solution (marked as solution B), and then solution B was added to the solution A followed by magnetic stirring under ice bath condition for 12 h (marked as solution C). (3) After the solution C was centrifuged and the product was washed to neutral, the polypyrrole/halloysite composite (PPy/HNT) was obtained. (4) The PPy/HNT was dried in a vacuum oven at 60 °C for 24 h. Then, under the protection of argon atmosphere, the PPy/HNT was heated to 900 °C at a heating rate of 3 °C min−1 and then incubated for 6 h. Finally, it was naturally cooled to room temperature and ground to obtain the C/HNT composite. (5) 10 mL concentrated hydrochloric acid and 10 mL hydrofluoric acid (GR, Sinopharm Chemical Reagent Co., Ltd., China) were mixed to prepare a 100 mL acid solution (marked as solution D). Then, 1 g C/HNT composite was added to the solution D followed by magnetic stirring for 12 h. (6) After the solution D was centrifuged and the product was washed to neutral, the product was finally dried in a vacuum oven at 60 °C for 24 h to obtain mesoporous carbon (MC).2.2. Preparation of mesoporous carbon/sulfur (MC/S) composite
0.2 g mesoporous carbon (MC) and 0.8 g sublimed sulfur (AR, Sinopharm Chemical Reagent Co., Ltd., China) were placed in a mortar and mixed uniformly. Then, the mixed material was placed in a Teflon stainless steel reaction vessel, and heated at 155 °C for 12 h to obtain mesoporous carbon/sulfur (MC/S) composite, which was used as an active material.2.3. Electrode preparation and cell assembly
The electrode slurry comprising 70 wt% active material, 20 wt% carbon black (Super P, Sinopharm Chemical Reagent Co., Ltd., China), and 10 wt% PVDF (HSV900, Arkema Inc., Beijing, China) in N-methyl-1-pyrrolidone (NMP, Sinopharm Chemical Reagent Co., Ltd., China) was casted on aluminum foil by using a doctor blade and dried at 60 °C for 12 h to form the composite cathode. The mass loading of active sulfur in each cathode was 1.3–1.4 mg cm−2. Lithium metal was used as the anode and 1 M LiTFSI in 1,2-dimethoxyethane (DME)/1,3-dioxolane (DOL) (1![[thin space (1/6-em)]](https://www.rsc.org/images/entities/char_2009.gif) :
:![[thin space (1/6-em)]](https://www.rsc.org/images/entities/char_2009.gif) 1, v/v) with 0.2 M LiNO3 inside (Duoduo Reagent Co., Ltd., China) was used as the electrolyte. The amount of electrolyte in the cell was controlled to be ∼20 μL per milligram of sulfur. A Celgard 2320 separator was used to physically separate the anode and the cathode. The assembly of lithium–sulfur battery was completed in an argon-filled glove box (Universal 2440/750) with O2 and H2O levels below 0.1 ppm using CR2025 type coin cells.
1, v/v) with 0.2 M LiNO3 inside (Duoduo Reagent Co., Ltd., China) was used as the electrolyte. The amount of electrolyte in the cell was controlled to be ∼20 μL per milligram of sulfur. A Celgard 2320 separator was used to physically separate the anode and the cathode. The assembly of lithium–sulfur battery was completed in an argon-filled glove box (Universal 2440/750) with O2 and H2O levels below 0.1 ppm using CR2025 type coin cells.
2.4. Material characterization
The phases of the materials were characterized by X-ray diffraction (XRD, Rint2000, Japan). The microstructure and morphology of the samples were characterized by scanning electron microscope (SEM, JSM5600LV, Japan) and transmission electron microscope (FE-TEM, Tecnai G2 F20, USA). The chemical bond or functional group information of the samples was obtained by a Fourier transform infrared spectrometer (FTIR, IRTracer-100, Japan). The BET data of the samples was obtained by a direct reading specific surface area analyzer (MONOSORB, Quantachrome, USA). Thermogravimetric analysis (TGA) of the MC/S composite was carried out by 704 F1 Phoenix. Galvanostatic charge/discharge cycling was performed at voltage range of 1.8–2.8 V in a Neware Battery Test System (Shenzhen Neware New Energy Tech. Co. Ltd). Cyclic voltammetry (CV, 0.1 mV s−1) and electrochemical impedance spectroscopy (EIS, 1 Hz to 100 kHz, 5 mV) measurements were conducted by an electrochemical workstation (CHI660D, Shanghai).3. Results and discussion
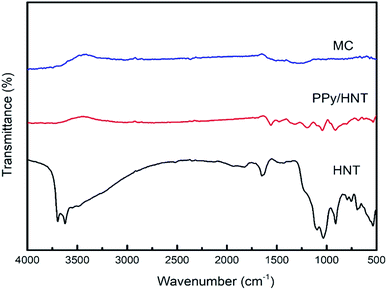
Fig. 1 is the FTIR spectrum of halloysite nanotubes (HNT), PPy/HNT composite, and mesoporous carbon (MC), respectively. It can be seen from the infrared spectrum curve of MC that the characteristic peak of polypyrrole has disappeared, which indicates that polypyrrole has been completely carbonized under high temperature condition. At the same time, the characteristic peak of HNT has also disappeared, indicating that the HNT template has been completely etched after treatment with hydrofluoric acid and hydrochloric acid.Fig. 2 is the scanning electron microscope (SEM) and transmission electron micrograph (TEM) images of the HNT, PPy/HNT composite and mesoporous carbon (MC), respectively. As seen in Fig. 2c, the PPy/HNT composite obtained by polymerization still retains the tubular structure of HNT (Fig. 2a and b). And the thickness of the polypyrrole layer coated on the outside of the composite is about 5 nm (Fig. 2d). As shown in the TEM image (Fig. 2e) of MC, the tubular structure of the PPy/HNT composite was not damaged after being etched by a mixed acid solution. According to Fig. 2f, MC has the same hollow trough structure as HNT, and its inner diameter is approximately the same as the outer diameter of HNT. This reflects that the polymerization of pyrrole mainly occurs on the outer surface of HNT. Moreover, the thickness of the MC wall does not change from that of the outer polypyrrole. From this, it can be concluded that the HNT in the inner layer of C/HNT composite has been completely reacted as a template during the etching process. This is the same as the result obtained by infrared spectroscopy.
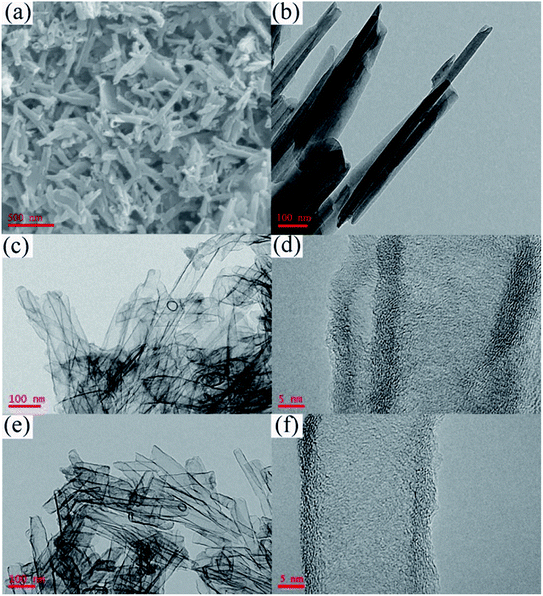 | ||
| Fig. 2 SEM image of (a) HNT; TEM images of (b) HNT, (c) PPy/HNT composite and (e) MC; HRTEM images of (d) PPy/HNT composite and (f) MC. | ||
In order to verify that the sulfur is uniformly distributed in the MC, a mapping analysis of the MC/S composite was performed. Combined with Fig. 3a, the tubular structure of MC/S composite can be clearly seen. According to Fig. 3b and c, the distribution range of elemental carbon and elemental sulfur in MC/S composite is approximately the same. It can be concluded that the sulfur is substantially evenly distributed on the MC. Through a simple BET test, the specific surface area of MC obtained by template etching is about 600 m2 g−1. After compounding sulfur, the specific surface area of MC/S composite is reduced to only 50 m2 g−1. This is due to the sulfur entering the tubular interior of MC.
 | ||
| Fig. 3 SEM image of (a) MC/S composite; mapping analysis of (b) elemental carbon and (c) elemental sulfur. | ||
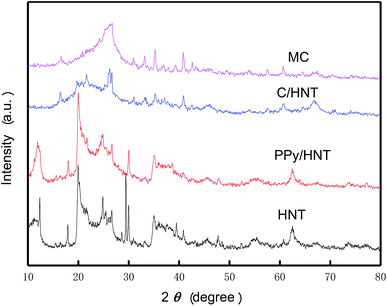
The XRD patterns of halloysite nanotubes (HNT), PPy/HNT composite, C/HNT composite and mesoporous carbon (MC) are shown in Fig. 4. Comparing the diffraction curves of PPy/HNT composite and HNT, it is known that HNT can maintain its structural stability after the polymerization of pyrrole. After carbonization at 900 °C, the diffraction spectrum of the obtained C/HNT composite shows a broad diffraction peak between 15° and 35°, which is the characteristic peak of 002 crystal plane of carbon. This indicates that HNT was converted into a spinel phase after the structure collapsed under high temperature condition, while polypyrrole was carbonized to form amorphous carbon. In addition, after etching the HNT template with a mixed acid solution, no characteristic peak appeared near 13° on the diffraction curve of MC, indicating that the crystal structure of MC remains stable.30
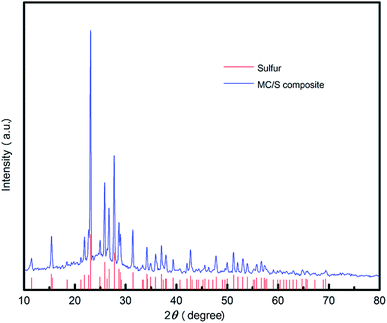
Due to a higher temperature used in the synthesis of MC/S composite, the crystal structure of sulfur in the obtained MC/S composite may undergo a transition. By comparing the XRD pattern of MC/S composite (Fig. 5) with the characteristic peaks of synthetic sulfur, it can be seen that the characteristic peaks of sulfur before and after compounding are very consistent. It can be concluded that the sulfur in the MC/S composite still maintains the original crystal structure.
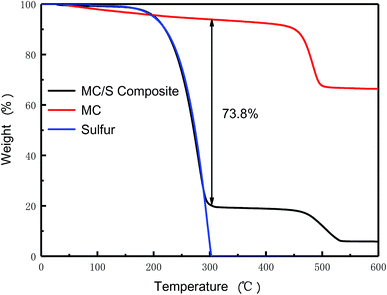
Fig. 6 is the thermogravimetric (TGA) curves of the prepared MC/S composite, MC and sulfur, respectively. In the composite preparation process, the mass percentage of MC and sublimed sulfur is 20![[thin space (1/6-em)]](https://www.rsc.org/images/entities/char_2009.gif) :
:![[thin space (1/6-em)]](https://www.rsc.org/images/entities/char_2009.gif) 80. Therefore, the sulfur content in MC/S composite is calculated to be 73.8%. Before the temperature is below 300 °C, the weight loss curve of MC/S composite is almost the same as that of sublimed sulfur, indicating that sublimed sulfur is uniformly distributed in the MC. Since the MC prepared by using HNT as template has a larger specific surface area and a richer mesoporous structure, sublimed sulfur is more likely to be distributed on its surface during high-temperature melting. Thereby the MC/S composite with a higher sulfur loading ensures the high energy density of lithium–sulfur battery.
80. Therefore, the sulfur content in MC/S composite is calculated to be 73.8%. Before the temperature is below 300 °C, the weight loss curve of MC/S composite is almost the same as that of sublimed sulfur, indicating that sublimed sulfur is uniformly distributed in the MC. Since the MC prepared by using HNT as template has a larger specific surface area and a richer mesoporous structure, sublimed sulfur is more likely to be distributed on its surface during high-temperature melting. Thereby the MC/S composite with a higher sulfur loading ensures the high energy density of lithium–sulfur battery.
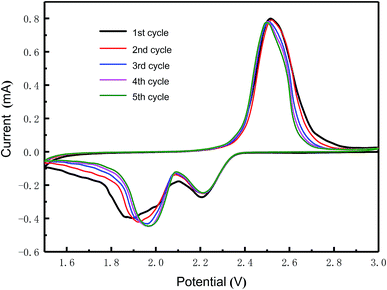
Fig. 7 shows the CV curves of the MC/S composite cathode in the potential range of 1.5–3.0 V at a scanning rate of 0.1 mV s−1, during the first five cycles. At different cycles, two distinct reduction peaks can be observed, indicating that the sulfur is reduced in two stages. The peak at high voltage corresponds to the reduction of cyclic S8 to highly polysulfide ion (S8 → Sn2−), while the peak at low voltage corresponds to the further reduction of soluble polysulfide ion to insoluble oligomeric sulfur ion (Sn2− → Li2S2 + Li2S). The oxidation peak that occurs during the voltage retrace process represents the oxidation of lithium polysulfide to elemental sulfur (Li2Sn → S8). After the activation of the first cycle, the cyclic voltammetry curve is relatively stable in the subsequent scanning process. As the number of cycles increases, the reduction peak gradually shifts to the higher voltage position, while the high sulfur reduction voltage represents a fast sulfur reduction kinetic rate. At the same time, the oxidation peak gradually shifts to the lower voltage position. Therefore, the voltage difference (ΔE) between the oxidation peak and the reduction peak is gradually reduced, indicating that the prepared MC/S composite cathode has good electrochemical reversibility. Since ΔE is caused by the polarization of the active material during charge and discharge, it can also be concluded that the redox kinetics process of the cathode is gradually improved.31–35
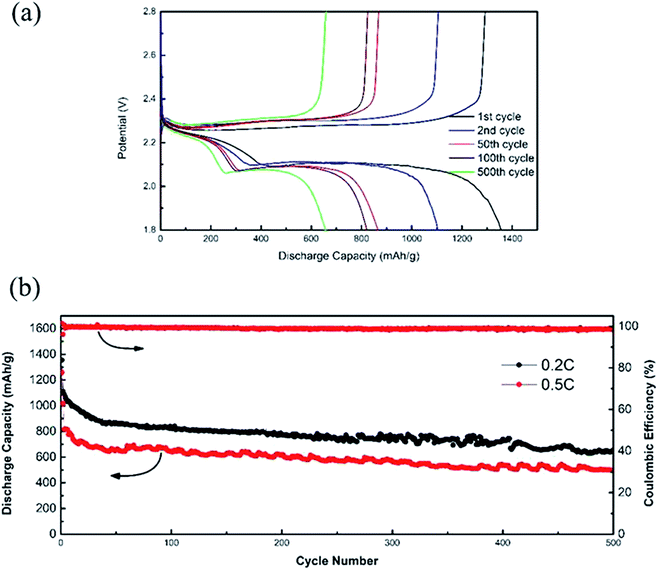
Fig. 8a is a graph showing the charge/discharge curves of the MC/S composite cathode at 0.2C for 1st, 2nd, 50th, 100th and 500th cycles. There are two obvious platforms on the discharge curves, because the electrochemical reaction process between elemental sulfur and lithium is a multi-step reaction. The voltage of the platform corresponding to different discharge cycle is almost no change, indicating that the prepared MC/S composite cathode has good anti-polarization ability. The MC/S composite cathode has first cycle discharge specific capacity of 1355 mA h g−1 at 0.2C, and the utilization rate of active sulfur can reach 80.9%. The capacity of the MC/S composite cathode in the first two discharge cycles decays faster, because the active sulfur particles loaded on the MC surface inevitably dissolve in the electrolyte during the electrochemical reactions.
The cycling performance of the MC/S composite cathode is shown in Fig. 8b. It can be seen that the discharge specific capacity of the MC/S composite cathode decreases when the current density is increased from 0.2C to 0.5C. This is because the polarization inside the electrode becomes more serious as the current density increases, and the electrochemical reaction kinetics becomes slower, resulting in a more serious irreversible loss of the active sulfur. However, the composite cathode exhibits excellent cycle stability after 30 cycles, and the discharge specific capacity remains at 496.9 mA h g−1 even after 500 cycles at 0.5C. In addition, the discharge specific capacity retention rate from 50th to 500th cycle is 75.8%, and the average attenuation per cycle is 0.05%. Except for the first cycle, the coulombic efficiency of the composite cathode at the charge/discharge rate of 0.5C is always close to 99%. The unique mesoporous structure of MC provides a framework for the uniform dispersion of active sulfur and forms a good conductive network, thereby increasing the utilization rate of active sulfur. Furthermore, the adsorption of mesoporous structure can not only effectively inhibit the dissolution of active sulfur in the electrolyte, but also provide a buffer space for the volume expansion of active sulfur in the electrochemical reaction process, thus ensuring the stability of the electrode structure.
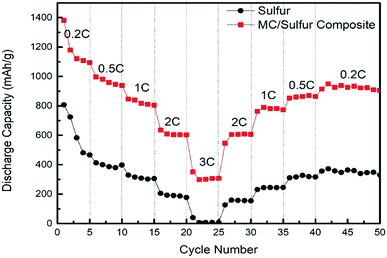
To make a further investigation on the reaction dynamics of MC/S composite cathode, the rate performance was characterized at the different current densities (0.2C, 0.5C, 1C, 2C and 3C) and the result is depicted in Fig. 9. The discharge specific capacity gradually decreases as current density increases from 0.2 to 3C. Even though at the maximum charge/discharge rate (3C), the specific capacity is still up to 351.3 mA h g−1. When current density is restored to 0.2C, the discharge specific capacity can reach 937.7 mA h g−1 and the capacity retention rate is 84.6%. It can be seen that the discharge specific capacity of the MC/S composite cathode at the same rate is much higher than that of the pure sulfur cathode. Especially at high charge/discharge rate (3C), the discharge specific capacity of the pure sulfur cathode is close to zero after 1st discharge cycle. This is because the MC has good electrical conductivity and the rich mesoporous structure allows rapid migration of ions and electrons, while the high specific surface area also facilitates the absorption of electrolyte. The good rate reversibility of the MC/S composite cathode indicates that the composite has good structural stability.
The electrochemical performance exhibited by MC/S composite cathode is related to the internal impedance of the battery. Fig. 10 is the electrochemical impedance spectroscopy (EIS) of the MC/S composite cathode before cycle, after 20th cycle and after 100th cycle, respectively. The EIS spectrum is composed of a small intercept in the high frequency, two semicircles in the high intermediate frequency, and an inclined line in the low frequency. After fitting the equivalent circuit, it can be seen that the measured EIS data is in good agreement with the fitted data, and the corresponding detailed fitting data is shown in Table 1. In the equivalent circuit diagram and the fitting data, R1 is the internal resistance of the battery, R2 is the interface charge transfer resistance, R3 is the deposition diffusion impedance, CPE1 is the surface diffusion capacitance of the MC/S composite cathode and the lithium electrode, and CPE2 refers to the double layer capacitance distributed on the surface of the cathode. As displayed in Table 1, the value of R1 increases as the cycle progresses, because the polysulfide produced by the electrochemical reaction dissolves into the electrolyte at the beginning of the cycles. The value of R1 remains relatively stable during the subsequent cycles, indicating that no excess polysulfide continues to diffuse in the electrolyte. The value of R2 is up to 61.94 Ω before cycle, and gradually decreases as the cycle progresses. This reflects that the sulfide on the surface of the composite electrode can re-engage in the electrochemical reaction of the battery, which improves the utilization of the active sulfur. The value of R3 increases in the previous cycle, indicating that Li2S is formed on the surface of the anode. This value is relatively stable during the subsequent cycles, which shows that the MC/S composite cathode has good dynamic characteristics during charge/discharge process, so the electrode exhibits long-term cyclic stability (Fig. 8) and good rate performance (Fig. 9).
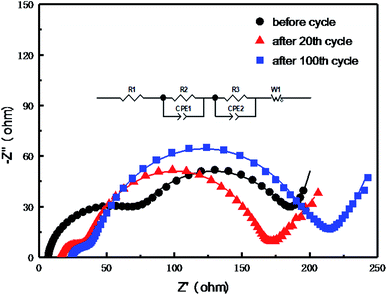 | ||
| Fig. 10 Electrochemical impedance spectroscopy of the MC/S composite cathode before and after cycles. | ||
| Resistance | Before cycle | After 20th cycle | After 100th cycle |
|---|---|---|---|
| R1 (Ω) | 6.35 | 16.09 | 20.50 |
| R2 (Ω) | 61.94 | 15.83 | 12.09 |
| R3 (Ω) | 119.50 | 132.50 | 147.70 |
4. Conclusions
In order to further increase the sulfur content of cathode in the lithium–sulfur battery and ensure the energy density, an excellent MC was prepared by template etching and combined with sulfur as electrode. The prepared MC has larger specific surface area and rich mesoporous structure. Moreover, the MC/S composite cathode exhibits good cycle stability and rate performance, and the utilization rate of the active sulfur can reach 80.9%. The research results of the MC/S composite cathode are beneficial to the further practical application of the lithium–sulfur battery, and there is also some inspiration for the development of other carbon materials as the sulfur carrier of the lithium–sulfur battery.Conflicts of interest
There are no conflicts to declare.Acknowledgements
The authors would like to give our sincere gratitude to the support by National Key R&D Program of China (Grant No. 2018YFB0104200).References
- S. S. Zhang, J. Power Sources, 2013, 231, 153–162 CrossRef CAS.
- D. Bresser, S. Passerini and B. Scrosati, Chem. Commun., 2013, 49, 10545–10562 RSC.
- D. H. Liu, C. Zhang, G. M. Zhou, W. Lv, G. W. Ling, L. J. Zhi and Q. H. Yang, Adv. Sci., 2018, 5, 1700270 CrossRef PubMed.
- D. P. Lv, J. M. Zheng, Q. Y. Li, X. Xie, S. Ferrara, Z. M. Nie, L. B. Mehdi, N. D. Browning, J. G. Zhang, G. L. Graff, J. Liu and J. Xiao, Adv. Energy Mater., 2015, 5, 1402290 CrossRef.
- J. X. Song, Z. X. Yu, M. L. Gordin and D. H. Wang, Nano Lett., 2016, 16, 864–870 CrossRef CAS PubMed.
- D. Zheng, X. R. Zhang, J. K. Wang, D. Y. Qu, X. Q. Yang and D. Y. Qu, J. Power Sources, 2016, 301, 312–316 CrossRef CAS.
- G. X. Li, J. H. Sun, W. P. Hou, S. D. Jiang, Y. Huang and J. X. Geng, Nat. Commun., 2016, 7, 10601 CrossRef CAS PubMed.
- Z. Zhang, L. L. Kong, S. Liu, G. R. Li and X. P. Gao, Adv. Energy Mater., 2017, 7, 1602543 CrossRef.
- S. Z. Niu, G. M. Zhou, W. Lv, H. F. Shi, C. Luo, Y. B. He, B. H. Li, Q. H. Yang and F. Y. Kang, Carbon, 2016, 109, 1–6 CrossRef CAS.
- Y. Yang, G. H. Yu, J. J. Cha, H. Wu, M. Vosgueritchian, Y. Yao, Z. A. Bao and Y. Cui, ACS Nano, 2011, 5, 9187–9193 CrossRef CAS PubMed.
- H. W. Chen, W. L. Dong, J. Ge, C. H. Wang, X. D. Wu, W. Lu and L. W. Chen, Sci. Rep., 2013, 3, 1910 CrossRef PubMed.
- L. W. Ji, M. M. Rao, H. M. Zheng, L. Zhang, Y. C. Li, W. H. Duan, J. H. Guo, E. J. Cairns and Y. G. Zhang, J. Am. Chem. Soc., 2011, 133, 18522–18525 CrossRef CAS PubMed.
- X. Liu, J. Q. Huang, Q. Zhang and L. Q. Mai, Adv. Mater., 2017, 29, 1601759 CrossRef.
- X. Liang, A. Garsuch and L. F. Nazar, Angew. Chem., 2015, 127, 3979–3983 CrossRef.
- J. M. Zheng, M. Gu, C. M. Wang, P. J. Zuo, P. K. Koech, J. G. Zhang, J. Liu and J. Xiao, J. Electrochem. Soc., 2013, 160, A1992–A1996 CrossRef CAS.
- Y. X. Yin, S. Xin, Y. G. Guo and L. J. Wan, Angew. Chem., Int. Ed., 2013, 52, 13186–13200 CrossRef CAS PubMed.
- B. Zhang, X. Qin, G. R. Li and X. P. Gao, Energy Environ. Sci., 2010, 3, 1531–1537 RSC.
- S. R. Zhao, C. M. Li, W. K. Wang, H. Zhang, M. Y. Gao, X. Xiong, A. B. Wang, K. G. Yuan, Y. Q. Huang and F. Wang, J. Mater. Chem. A, 2013, 1, 3334–3339 RSC.
- Y. Z. Zhang, L. Chen, Y. Meng, J. Xie, Y. Guo and D. Xiao, J. Power Sources, 2016, 335, 20–30 CrossRef CAS.
- C. Weinberger, X. Cao and M. Tiemann, J. Mater. Chem. A, 2016, 4, 18426–18431 RSC.
- C. X. Guo, X. L. Tong and X. Y. Guo, Int. J. Hydrogen Energy, 2016, 41, 22941–22951 CrossRef CAS.
- B. Wang, J. Di, G. P. Liu, S. Yin, J. X. Xia, Q. Zhang and H. M. Li, J. Colloid Interface Sci., 2017, 507, 310–322 CrossRef CAS PubMed.
- L. N. Sui, Y. T. Wang, W. B. Ji, H. Q. Kang, L. F. Dong and L. Y. Yu, Int. J. Hydrogen Energy, 2017, 42, 29820–29829 CrossRef CAS.
- L. Hadidi, A. Y. F. Mahmoud, T. K. Purkait, M. T. McDermott and J. G. C. Veinot, Nanotechnology, 2017, 28, 587–598 Search PubMed.
- M. Baca, K. Cendrowski, P. Banach, B. Michalkiewicz, E. Mijowska, R. J. Kalenczuk and B. Zielinska, Int. J. Hydrogen Energy, 2017, 42, 30461–30469 CrossRef CAS.
- T. L. Wang, P. C. Shi, J. J. Chen, S. Cheng and H. F. Xiang, J. Nanopart. Res., 2016, 18, 189–196 CrossRef.
- X. L. Ji, K. T. Lee and L. F. Nazar, Nat. Mater., 2009, 8, 500–506 CrossRef CAS PubMed.
- X. L. Li, Y. L. Cao, W. Qi, L. V. Saraf, J. Xiao, Z. M. Nie, J. Mietek, J. G. Zhang, B. Schwenzer and J. Liu, J. Mater. Chem., 2011, 21, 16603–16610 RSC.
- X. Y. Tao, X. R. Chen, Y. Xia, H. Huang, Y. P. Gan, R. Wu, F. Chen and W. K. Zhang, J. Mater. Chem. A, 2013, 1, 3295–3301 RSC.
- A. P. Wang, F. Y. Kang, Z. H. Huang, Z. C. Guo and X. Y. Chuan, Microporous Mesoporous Mater., 2008, 108, 318–324 CrossRef CAS.
- X. Y. Zhu, F. Zhang, L. Zhang, L. Y. Zhang, Y. Z. Song, T. Jiang, S. Sayed, C. Lu, X. G. Wang, J. Y. Sun and Z. F. Liu, Adv. Funct. Mater., 2018, 28, 684–691 Search PubMed.
- K. X. Xiang, S. Y. Cai, X. Y. Wang, M. F. Chen and S. X. Jiang, J. Alloys Compd., 2018, 740, 687–694 CrossRef CAS.
- R. Yang, L. Li, D. Chen, L. P. Chen, B. Ren, Y. L. Yan and Y. H. Xu, ChemistrySelect, 2017, 2, 11697–11702 CrossRef CAS.
- J. Yao, T. Mei, Z. Q. Cui, Z. H. Yu, K. Xu and X. B. Wang, Chem. Eng. J., 2017, 330, 644–650 CrossRef CAS.
- J. Wang, H. Yang, C. Guan, J. L. Liu, Z. Chen, P. Liang and Z. X. Shen, J. Mater. Chem. A, 2017, 5, 24602–24611 RSC.
| This journal is © The Royal Society of Chemistry 2019 |

