
 Open Access Article
 This Open Access Article is licensed under a Creative Commons Attribution-Non Commercial 3.0 Unported Licence
Synthesis and characterization of polyaniline, polypyrrole and zero-valent iron-based materials for the adsorptive and oxidative removal of bisphenol-A from aqueous solution†
Lerato Hlekelelea,
Nomvuyo E. Nomadoloa,
Katlego Z. Setshedia,
Lethula E. Mofokengab,
Avashnee Chettya and
Vongani P. Chauke *a
*a
aPolymers and Composites, Materials Science and Manufacturing, Council for Scientific and Industrial Research, PO Box 395, 0001, Pretoria, South Africa. E-mail: VChauke@csir.co.za; Vonganic@yahoo.com
bMolecular Sciences Institute, School of Chemistry, University of the Witwatersrand (Wits), Private Bag X3, Johannesburg 2050, South Africa
First published on 9th May 2019
Abstract
One pot synthesis of a polypyrrole, polyaniline and Fe0 nano-composite (Fe0-PPY/PANI) was achieved by polymerizing aniline and pyrrole with FeCl3 followed by the reduction of Fe3+ to Fe0 with NaBH4. PPY/PANI was synthesized the same way as Fe0-PPY/PANI, except that all the FeCl3 was removed by rinsing. The presence of Fe0 was demonstrated using several analytical techniques; this was shown in comparison to materials that are without Fe0. A series of materials were screened as both adsorbents and catalyst for the activation of H2O2 towards bisphenol A (BPA) removal in batch experiments. Polymers performed better than composites containing Fe0 at adsorption, whereas Fe0 based materials were better catalysts for the activation of H2O2. BPA samples were then spiked with other contaminants including sewage water to test the performance of the various adsorbents and Fenton catalysts. PPY/PANI was found to be a better adsorbent than the rest, whereas Fe0-PPY/PANI was the best Fenton catalyst. The adsorption kinetics of BPA onto PPY/PANI was studied; it was found that the process was governed by the pseudo-second-order kinetic model. The adsorption isotherms revealed that the amount of BPA taken up by PPY/PANI increased with increasing temperature and was governed by the Langmuir adsorption isotherm. The mechanism in which Fe0-PPY/PANI and H2O2 degraded BPA was studied, it was found that surface-bound hydroxyl radicals were responsible for the degradation of BPA. It was also shown that the degradation process included the formation of smaller compounds leading to the reduction of the total organic content by 57%.
Introduction
Bisphenol A, (BPA) (2,2-bis(4-hydroxyphenyl)propane), is one of the most frequently manufactured organic chemicals that is used in the production of polycarbonate plastics, epoxy resins and several other types of plastic product.1,2 The persistence of BPA in our environment, as well as its exposure to humans and animals, comes from its presence in baby feeding bottles, plastic containers, food cans and landfill leachates.3,4 BPA has been classified as an endocrine disrupting compound (EDC) as it has been shown to display hormone-like properties as it is able to disrupt the functioning of thyroid processes, and nervous and immune systems.5–8 Furthermore, BPA exposure has been associated with poor sperm production and different kinds of cancer.9–11 Regrettably, BPA and other EDC's (such as some hormones, pesticides, etc.) have been frequently detected in water and wastewater.12,13 This suggests that conventional drinking and wastewater treatment plants cannot completely remove all the EDCs.14Various technologies have been developed and reported for the removal of EDCs, these include photocatalytic degradation, biological treatment, advanced oxidation processes (AOPs), and adsorption.15–17 Adsorption technology has received a lot of attention due to its simplicity, cost-effectiveness, and high efficiency.18–20 Different adsorbents such as activated carbon, agricultural waste, polymer resin, organic clay, membranes, polymeric/inorganic hybrid composites, and zero-valent iron nanocomposites have been used for the removal of EDCs and various other contaminants.21–23 Organic polymeric materials such as polyaniline, polypyrrole, and composites of thereof have been shown to be potent adsorbents for the removal of pharmaceuticals, anions, organics, and cations.24–27 Furthermore, organic polymeric materials along with other types of carbon materials such as carbon nanotubes, graphene, and nitrogen-doped carbon nanotubes can be used as supports for active nanomaterials for removing contaminants from water.28–30
On the other hand, zero-valent iron (Fe0), is an environmentally friendly material which in the past few years has been exploited as a cheap catalyst in Fenton-like reactions.31,32 This is because Fe0 activates oxidants such as hydrogen peroxide (H2O2) and persulphate (S2O82−) to form highly reactive (oxidizing) radicals such as hydroxyl (HO˙), sulfate (SO4˙−) and superoxide (O2˙−) radical species which are known to be highly effective for degrading organic contaminants.31,32 Other materials which undergo AOPs and have been exploited for water remediation include titanium dioxide and its derivatives,33,34 Liu et al. also demonstrated the removal of over 75% of BPA within 12 hours using a zero valent aluminum-acid system.31 The high efficiencies of AOPs in the removal of BPA from water have motivated the synthesis of a dual nanocomposite, where it was postulated that polypyrrole–polyaniline would adsorb BPA and Fe0 would degrade BPA into less-toxic degradation products.
Therefore, the aim of this work was to synthesize and characterize materials consisting of polypropylene (PPY), polyaniline (PANI) and Fe0. These materials were tested as adsorbents and catalysts for the activation of H2O2 for Fenton-like reactions towards the removal of BPA. PPY and PANI are conducting polymers that have been used as mediums to root or house metal nanoparticles in nanocomposite synthesis.35 Moreover, PANI and PPY have nitrogen based functional groups that can assist in the removal of organic phenolic compounds through hydrogen bonding.36–38 In addition, immobilization of Fe0 nanoparticles onto polymer matrices has been demonstrated to be beneficial in reducing aggregation of Fe0 nanoparticles by Bhaumik et al., where they used PANI as a support material for Fe0 nanoparticles.39
Experimental
Materials
Pyrrole (PY, 99%), anhydrous iron(III)chloride (FeCl3), aniline (ANI, ≥99.5%), sodium hydroxide (NaOH) sodium borohydride (NaBH4), bisphenol A (BPA, 99+%), hydrochloric acid (HCl, 37%), humic acid, potassium iodide (KI), hydrogen peroxide (H2O2, 30 wt% in H2O) and sodium chloride (NaCl) were all purchased from Sigma-Aldrich, SA. Argon gas (AR) was purchased from AFROX, South Africa. Phenol (99–100% assay) was purchased from Parchem whereas methanol (99.8% assays) was purchased from Protea Chemicals. Acetonitrile for HPLC, gradient grade (>99.9%) was purchased from Merck. The water used in this work unless stated otherwise is pure water with a resistivity of 18.2 MΩ cm. Hypodermic polypropylene syringes (5 ml) and 0.45 μm cellulose acetate membrane syringe filters were purchased from Sigma-Aldrich SA. Sewage water was obtained from Marble Hall waste-water treatment plant in Limpopo province, South Africa.Materials synthesis
Pyrrole (0.2 ml – 0.19 g), aniline (0.6 ml – 0.61 g) and water (80 ml) were added into a 250 ml conical flask and stirred for 1 hour. FeCl3 (6 g) was then added to the mixture and was stirred for a further 3 hours. Argon gas was then bubbled into the reaction mixture which contained residual FeCl3 and/or FeCl2 that served as a source of Fe to be reduced to nano Fe0. Freshly prepared NaBH4 (0.75 M) solution (50 ml) was added dropwise to the reaction mixture to reduce oxidized Fe species to Fe0. The reaction mixture was then stirred for another 20 min to complete the reduction. After this, acetone was added to stop the polymerization reaction, followed by filtration to collect Fe0-PPY/PANI. The material was then washed with distilled water until the filtrate became colorless and washed with acetone to remove oligomers. The material was then dried in a vacuum oven at 90 °C for 24 h. The theoretical composition of this material is PPY(13%)![[thin space (1/6-em)]](https://www.rsc.org/images/entities/char_2009.gif) :PANI(40%):Fe0(47%). In the case of Fe0-PPY and Fe0-PANI, the exact same procedure was used except for that only pyrrole (0.8 ml – 0.77 g and 6 g FeCl3) was polymerized in the case of the former and the only aniline (0.8 ml – 0.82 g and 6 g FeCl3) was polymerized when making the latter. The theoretical composition of the two composites are PANI(55%):(45%)Fe0 and PPY(52):(48)Fe0. When making materials that consisted of polymers only without Fe0, i.e. PPY, PANI, and PPY/PANI, after polymerizing all of the FeCl3 was rinsed away with water when filtering. The theoretical composition of PPY/PANI is PPY(24%):(76%).
:PANI(40%):Fe0(47%). In the case of Fe0-PPY and Fe0-PANI, the exact same procedure was used except for that only pyrrole (0.8 ml – 0.77 g and 6 g FeCl3) was polymerized in the case of the former and the only aniline (0.8 ml – 0.82 g and 6 g FeCl3) was polymerized when making the latter. The theoretical composition of the two composites are PANI(55%):(45%)Fe0 and PPY(52):(48)Fe0. When making materials that consisted of polymers only without Fe0, i.e. PPY, PANI, and PPY/PANI, after polymerizing all of the FeCl3 was rinsed away with water when filtering. The theoretical composition of PPY/PANI is PPY(24%):(76%).
Materials characterization
The surface morphology of the samples was investigated by transmission electron microscopy (TEM, FEI Tecnai G2 Spirit electron microscope at 120 kV) and scanning electron microscopy (SEM, FEI NOVA nanolab 600 FIB/SEM). For the powder X-ray diffraction analysis, a PXRD, Bruker D2 PHASER diffractometer (Ni-filtered Co-Kα radiation) was used. The surface area of the nanocomposite was determined by a Micromeritics Tristar II 3020 Surface Area and Porosity BET analyzer using nitrogen adsorption. Thermogravimetric analysis (TGA) was conducted in an air atmosphere on a TGA, PerkinElmer Pyris 1 TGA. The wettability studies were conducted on a KRUSS DSA 100.The point of zero charge (pzc) was determined by the solid addition technique.40 Here, 5 mg of the solid sample was dispersed in 25 ml of 0.1 M NaCl and equilibrated at room temperature (ca. 23 °C) for 48 hours. The initial pH (pHi) of the suspensions was adjusted using 0.05 M HCl and 0.05 M NaOH. The final pH (pHf) of the suspensions was measured after the 48 hours equilibration. The difference between pHf and pHi was plotted against pH and the pzc, and the point where pH is equal to 0, is the pzc of PPY/PANI.
Removal experiments
Batch experiments were conducted in 3 sets of experiments, (i) pH optimization, (ii) material screening experiments, and (iii) assessing the effect of other contaminants on the removal efficiencies of some of the materials synthesized. BPA solutions were prepared in 5% acetonitrile in water. In pH optimization experiments, 50 ml of 50 ppm solution of BPA was transferred into a plastic bottle. To these solutions, 25 mg of the materials were added, closed and agitated at 200 rpm in a thermostatic shaker for 24 h. The pH of the solutions was varied using NaOH or HCl. Also, in Fenton reactions, 15 ppm of H2O2 was added simultaneously with the catalyst to initiate the reaction. In experiments where the effect of other contaminants was studied, 0.12 M of NaCl, or 10 ppm phenol or 2 ppm humic acid was added to the relevant BPA solutions.Kinetics experiments were also performed where, typically, 200 ml BPA solution at a pH 6 for adsorption experiments and pH 3 for Fenton-like reactions was transferred into a 500 ml glass beaker. To this solution, 100 mg of the adsorbent or Fenton catalyst was added to initiate the reaction and agitated using an overhead stirred batch reactor stirring at 200 rpm. Also, 15 ppm of H2O2 was added in Fenton reactions. Additionally, in scavenging experiments, 5 mM KI or 350 mM methanol was added to the BPA solutions. In experiments where the effect of sewage-water was investigated, 25% of filtered sewage water was added to the BPA solutions. In all of these kinetics experiments, 1 ml aliquots were sampled using a syringe at predetermined intervals and filtered using a syringe filter.
The samples in all of these experiments were analyzed using high-performance liquid chromatography (Shimadzu HPLC, SPD-M20A, and Prominence with a UV/VIS Photodiode Array Detector). The analyst was eluted using a gradient solvent system consisting of water and acetonitrile. The gradient was as follows: the gradient began with 30% acetonitrile for 6 min, followed by the increase of acetonitrile to 90% over 2 min and kept like this for 1 min. The concentration of acetonitrile was then reduced back to 30% in 8 min and kept constant for 3 min. The gradient flow rate was 0.2 ml min−1 using a Phenomenex LUNA 5 μm C18 reverse phase column (150 × 4.60 mm). The BPA concentration was measured at 225 nm. Total organic content (TOC) measurements were done using a TOC analyzer (Tekmar Dohrmann Apollo 9000) relying on CO2 for quantification.14,41
In order to identify the degradation products, having performed kinetics experiments for Fenton-like reactions, the remaining solution was filtered to remove the catalyst particles. The liquid was then freeze-dried using a Telstar (LyoAlfa10) freeze drier. The dry samples were then dissolved in 10 ml acetonitrile and analyzed on an LC/MS/MS system. The chromatography was performed using the same column, solvent gradient system, and flow rate as described above and the intermediates were identified using mass-spectrometry (3200 Q TRAP LC/MS/MS). The MS was operated in the negative ion mode at an m/z range of 50–300.
Results and discussion
Materials characterization
The PXRD analysis was conducted on the materials in order to differentiate the diffraction properties of PPY, PANI, PPY/PANI and Fe0-PPY/PANI (Fig. 1). A broad peak was observed on the PXRD pattern of PPY at a 2θ value of 31°. This peak was assigned as a characteristic peak for PPY that resulted from the π–π interactions of partial PPY chains, comparable to those that occur in the case of aromatic groups.42,43 The broadness of the peak showed the amorphous nature of the polymer. In the case of PANI, several peaks were observed at 2θ values of 12.3, 18.2, 25.3, 30.1, 32.3 and 35.3 and were assigned as (001), (011), (020), (200), (121) and (022) reflections of the emeraldine salt form of PANI.44 The PXRD patterns of PPY/PANI and Fe0-PPY/PANI were observed to have been similar to that of PPY (without PANI characteristic peaks) except for that the peaks were broader and were centered at lower 2θ values (2θ = 31.5° for PPY, 29.8° for PPY/PANI and 27.8° for Fe0-PPY/PANI). The broadness of these peaks suggested polymerizing the two polymers simultaneously compromised their crystallinity thus yielding a material that was more amorphous than the separate polymers. Furthermore, two low intensity and narrow peaks were observed on the PXRD pattern of Fe0-PPY/PANI, at 2θ values of 37.3 and 53.7 and were attributed to the presence of Fe0, similar peaks were observed by Hwang et al. and were attributed to nanoscale Fe0.45 Important information was deduced from PXRD analysis: (i) it was established that PANI and PPY were successfully polymerized together (to form PPY/PANI composite), and (ii) Fe3+ (used as an initiator for the polymerization of pyrrole and aniline) was reduced to Fe0 in the presence of the polymer composite to form Fe0-PPY/PANI.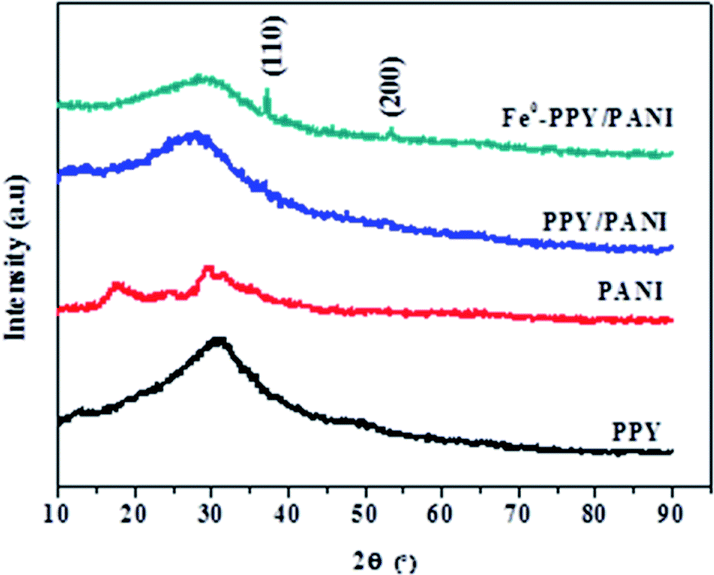 | ||
| Fig. 1 The PXRD patterns of the various materials. | ||
TEM and SEM imaging analyses were conducted on the samples in order to study their morphological characteristics. The morphology of Fe0-PANI was observed to be fibrous and intertwined (Fig. 2a and c), similar to that which was observed by Rahy et al.46 On the other hand, the morphology of Fe0-PPY was observed to be spheres that were linked into a chain like morphology, Fig. 2b and c. Similar morphological properties were observed by Chougule et al.47 Dark spots were observed on the TEM images of PANI and PPY; this was because of the Fe0 nanoparticles.
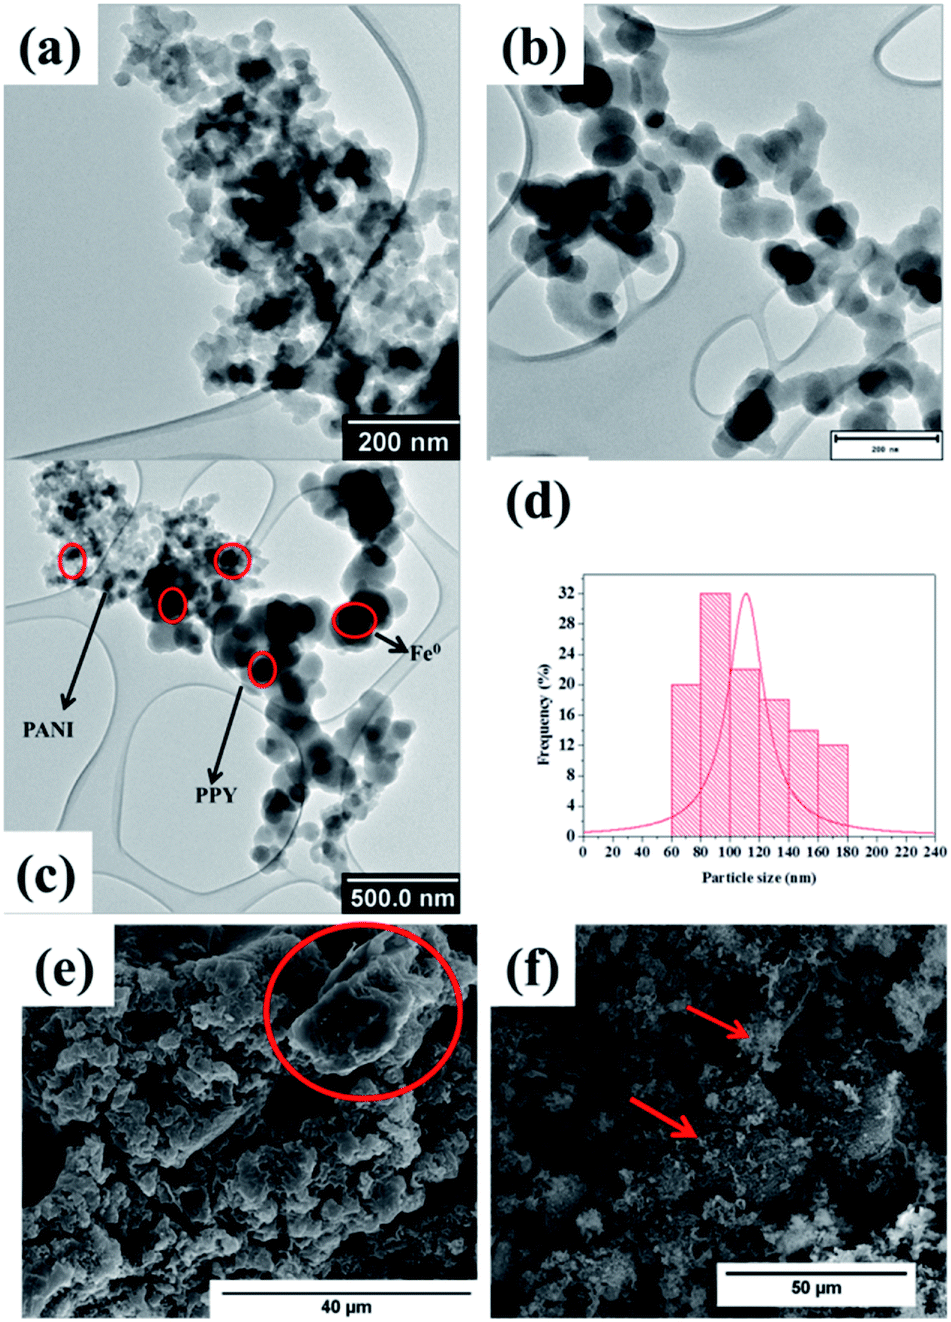 | ||
| Fig. 2 TEM images of (a) Fe0-PANI, (b) Fe0-PPY, (c) Fe0-PPY/PANI (d) particle size distribution of Fe0 nanoparticles in Fe0-PPY/PANI and SEM image of (e) PPY/PANI and (f) Fe0-PPY/PANI. | ||
The TEM image of the Fe0-PPY/PANI composite revealed that the material consisted of the morphological characteristics which were observed for Fe0-PANI and Fe0-PPY separately (Fig. 2c). Here, also, the Fe0 nanoparticles were identified as the particles (dark spots) embedded in the polymeric material on the TEM image (Fig. 2c). It was possible to differentiate between PANI/PPY and Fe0 by contrast because Fe0 nanoparticles are significantly heavier than PPY or PANI and as such the interactions with the beam of electrons differed. The particle size distribution of the Fe0 nanoparticles was measured to have been between 60 and 180 nm at an average of 110 nm (Fig. 2d). It was observed on the SEM image of PPY/PANI that the surface of the material is smooth (Fig. 2e). The circled area on the SEM image (Fig. 2e) better shows the smoothness of PPY/PANI. This is also shown in Fig. S1a.† On the other hand, the morphology of Fe0-PPY/PANI is characterized by a harsher surface caused by the Fe0 nanoparticles loaded on the surface of PPY/PANI (Fig. 2f and S1b†). The EDS spectrum of PPY/PANI showed that the material consisted of only carbon (nitrogen atoms were not picked because of their low relative abundance) (Fig. S1c†) whereas Fe was detected and observed on the EDS spectrum Fe0-PPY/PANI (Fig. S1d†). Furthermore, Fe0-PPY/PANI was mapped using EDS to study the dispersion of the Fe0 nanoparticles on the surface of PPY/PANI (Fig. S2a and b†). Here, it was observed that the Fe0 nanoparticles are well distributed on the surface of PPY/PANI. No evidence of agglomeration was observed.
TGA measurements of PPY/PANI (Fig. 3a) and Fe0-PPY/PANI (Fig. 3b) were performed in order to study the thermal properties of the materials and to estimate the amount of non-combustible iron species in the materials. The thermogram of PPY/PANI started decreasing from the onset and stopped decreasing at 600 °C at which point, over 90% of the material had combusted. The residual non-combustible material which was less than 10% of the material was attributed to Fe and Cl species that remained when the material was rinsed. In the case of Fe0-PPY/PANI, it was observed that 68% of the material was carbonaceous material (polymer) as it was combusted at temperatures below 600 °C (Fig. 3b). The remaining residue which accounted for 32 wt% was attributed to Fe0 as it was the only other material in the composite except for the polymer materials as it was shown by PXRD. The mass of the sample was observed to have increased at temperatures between 200 and 450 °C, indicating that the material was oxidizing further proving that iron in the material was in its zero valent state.
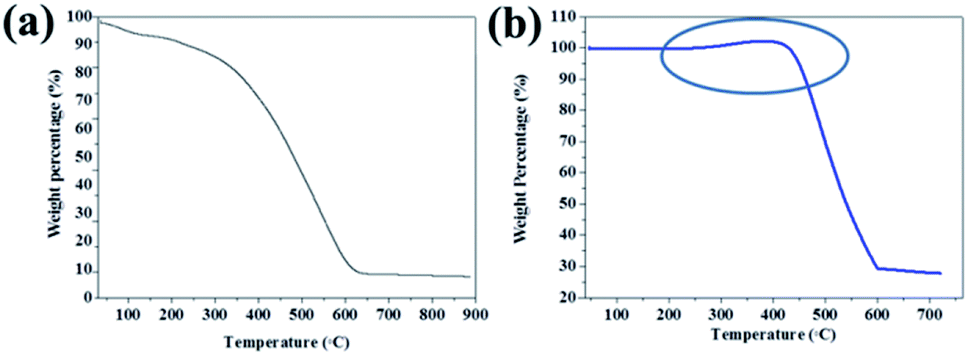 | ||
| Fig. 3 Thermogram of (a) PPY/PANI and (b) Fe0-PPY/PANI. | ||
The BET surface area of PPY/PANI was found to be 27.5 m2 g−1 whereas that of Fe0-PPY/PANI was 20.1 m2 g−1. The reduction in surface area was attributed to that the smaller Fe0 particles blocked the polymer substrate pores thus reducing the surface area.
Removal experiments
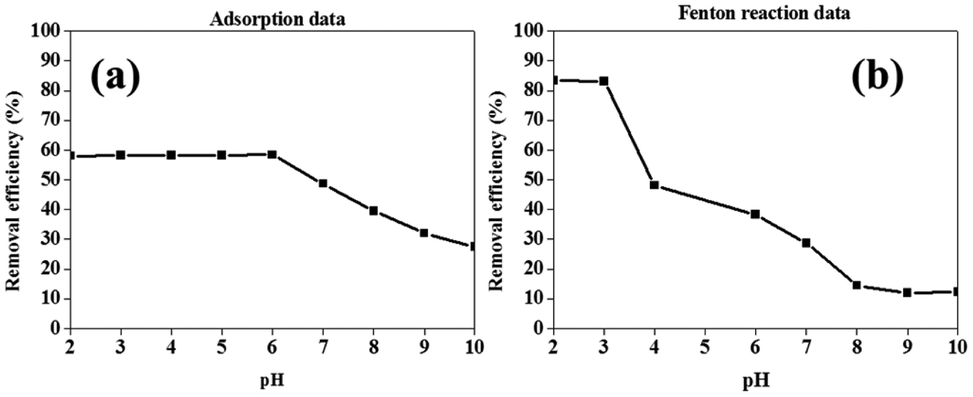 | ||
| Fig. 4 Effect of pH on the (a) adsorption of BPA using PPY and (b) Fenton degradation of BPA using Fe0. Experimental conditions: 50 ml of 50 ppm BPA, 25 mg of catalyst or adsorbent and 15 ppm H2O2 for only Fenton reactions. | ||
In the case of the removal of BPA by Fenton reaction using Fe0 and H2O2, it was observed that the removal of BPA was at its highest at pH values below 3 (Fig. 4b). At pH values higher than 3, it was observed that the removal efficiency decreased with increasing pH values. This was attributed to two factors, the direct participation of H+ in the degradation reaction and mass transport limitations as a result of a formation of hydroxide precipitation on the surface of the material at higher pH values.50,51 Consequently, succeeding Fenton reactions were conducted at pH 2, unless specified otherwise.
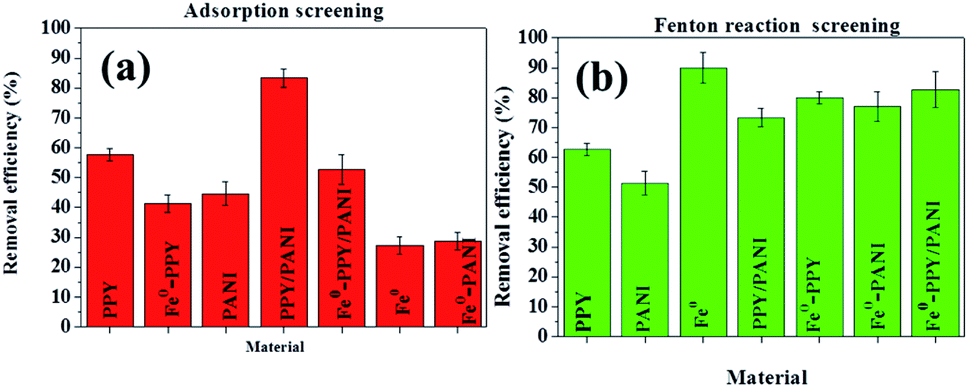 | ||
| Fig. 5 Removal efficiencies of BPA using the various materials by (a) adsorption and (b) Fenton reaction. Experimental conditions: 50 ml of 50 ppm BPA, 25 mg of catalyst or adsorbent and 15 ppm H2O2 for only Fenton reactions. | ||
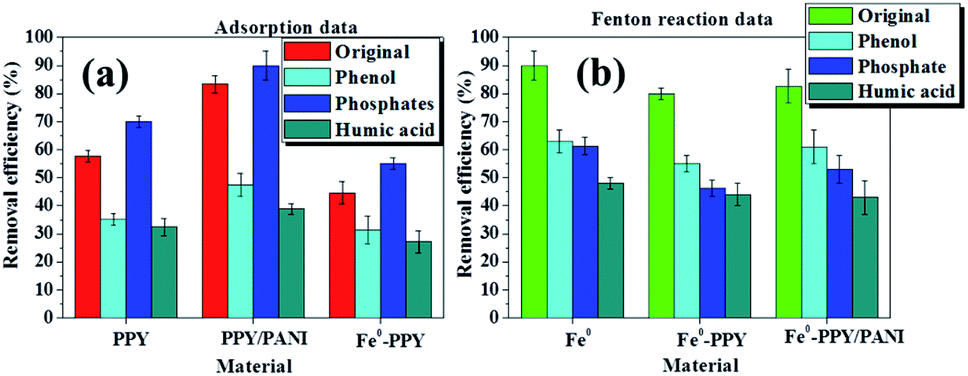 | ||
| Fig. 6 Removal efficiencies of bisphenol-A in the presence of other contaminants using the various materials by (a) adsorption and (b) Fenton reaction. Experimental conditions: 50 ml of 50 ppm BPA, 25 mg of catalyst or adsorbent and 15 ppm H2O2 for only Fenton reactions. | ||
The attenuation of adsorption of various kinds of organic contaminants on carbon-based adsorbents as a result of the presence of humic acid has been reported in other publications.55–57 Jiyong et al. observed this when adsorbing 17-ethinyl estradiol or BPA on single-walled carbon nanotubes.48 They contributed their observations to two possible reasons: (i) the two model contaminants were in competition with humic acid for adsorption sites and (ii) the humic acid blocked the pores on the adsorbents. These reasons also explain the adsorption attenuation of BPA on the materials reported here in the presence of humic acid.
The adsorption efficiencies of BPA in the presence of phenol using the various materials were the second lowest observed in our experiments (Fig. 6a). This was because phenol is a smaller organic compound compared to BPPA and it has similar structural properties as BPA except it looks like half of BPA. This indicates that the two compounds competed for the adsorption sites on the surface of the adsorbent materials and were adsorbed by the same mechanism thus reducing the efficiency at which BPA was adsorbed.
In the case of samples spiked with NaCl, the adsorption of BPA using the various materials increased. This experiment was conducted to investigate the influence that electrolytes have on the materials synthesized. This observation was explained by the screening effect phenomenon. This occurred because the presence of a relatively high concentration of NaCl affected the surface charge of the aromatic polymeric adsorbents to favor the π–π dispersion interactions.58,59 This then consequently increased the adsorption of BPA onto the adsorbents.
The effect that phenol, humic acid, and NaCl had on the removal of BPA through the activation of H2O2 using the various catalysts was also investigated and the results are plotted in Fig. 6b. Here it was observed that the removal efficiencies of the various materials were reduced significantly by the various contaminants, with Fe0 showing the best performance followed by Fe0-PPY/PANI. The activation of H2O2 for the removal of contaminants usually follows the radical formation route; this is crucial to why the presence of other contaminants reduced the removal of BPA. Phenol competed directly with BPA for radicals thus the attenuation of the removal efficiency. In the case of humic acid, it is possible that it may have combined with the carbon-based catalyst to form complexes that hindered the usual activation pathways.60 It was postulated that the decrease in performance as a result of the presence of chlorides was due to that the chlorides quenched the radicals and formed less-oxidative species as was reported for iodine atoms.61
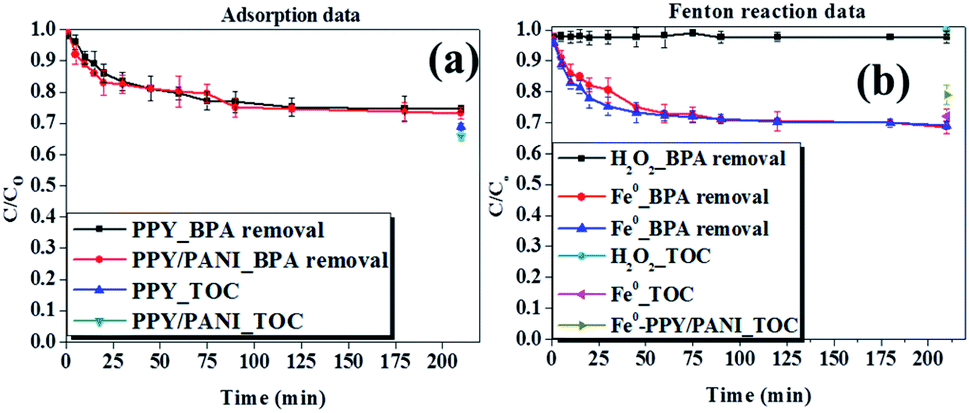 | ||
| Fig. 7 Removal efficiencies of bisphenol-A and TOC using various materials by (a) adsorption and (b) Fenton reaction. Experimental conditions: 200 ml of 50 ppm BPA, pH 6 for adsorption experiments and pH 3 for Fenton reactions, 100 mg of adsorbent or Fenton catalyst and 25% of sewage-water. | ||
In order to investigate this claim, several other experiments were conducted to determine the effect of different parameters on the removal of BPA and TOC attenuation. The parameters investigated were the adsorbent/catalyst dosage, H2O2 concentration (only in Fenton reactions) and the amount of sewage water. These experiments were conducted using the better performing adsorbent (PPY/PANI) and catalyst (Fe0-PPY/PANI).
Data obtained when investigating the effect of sewage water concentration on the ability of PPY/PANI and Fe0-PPY/PANI to remove BPA as an adsorbent and catalyst respectively are shown in Fig. S3a and b.† Here it was observed that in both adsorption and catalytic experiments, the amount of BPA removed decreased with increasing concentration of sewage water. This demonstrates that the constituents of the sewage water competed with BPA. A similar conclusion that the elements of sewage water competed with BPA was reached having observed how the mass of adsorbent (PPY/PANI) and Fenton catalyst (Fe0-PPY/PANI) affected the BPA uptake. Here, it was observed that the amount of BPA uptake increased with an increasing amount of adsorbent and Fenton catalyst (Fig. S4†). TOC measurements were also recorded as a function of the mass of adsorbent and Fenton catalyst. It was observed that the total organic content also decreased with increasing mass of materials, achieving more than 50% removal efficiency in both adsorption and Fenton experiments (Fig. S4†). This showed that with the right dosage, the materials can be applicable in real life samples.
The effect that the concentration of H2O2 has on the removal efficiency of BPA and total organic content by Fenton reaction using Fe0-PPY/PANI was also investigated (Fig. S5†). These experiments were conducted because H2O2 plays an important role in Fenton like experiments. Here, it was observed that BPA removal efficiency increased with increasing H2O2 from 2 to 20 mM. The removal efficiency decreased slightly when the concentration of H2O2 was above 20 mM. The scavenging effect brought upon by the surplus amount of H2O2 possibly caused a slight decrease in BPA uptake (see eqn (S1) and (S2)†). Nevertheless, the BPA and TOC uptakes reached 85 and 65% respectively, showing that the matter in the sewage water used was in competition with BPA and that the materials have a potential of being used in real life samples.
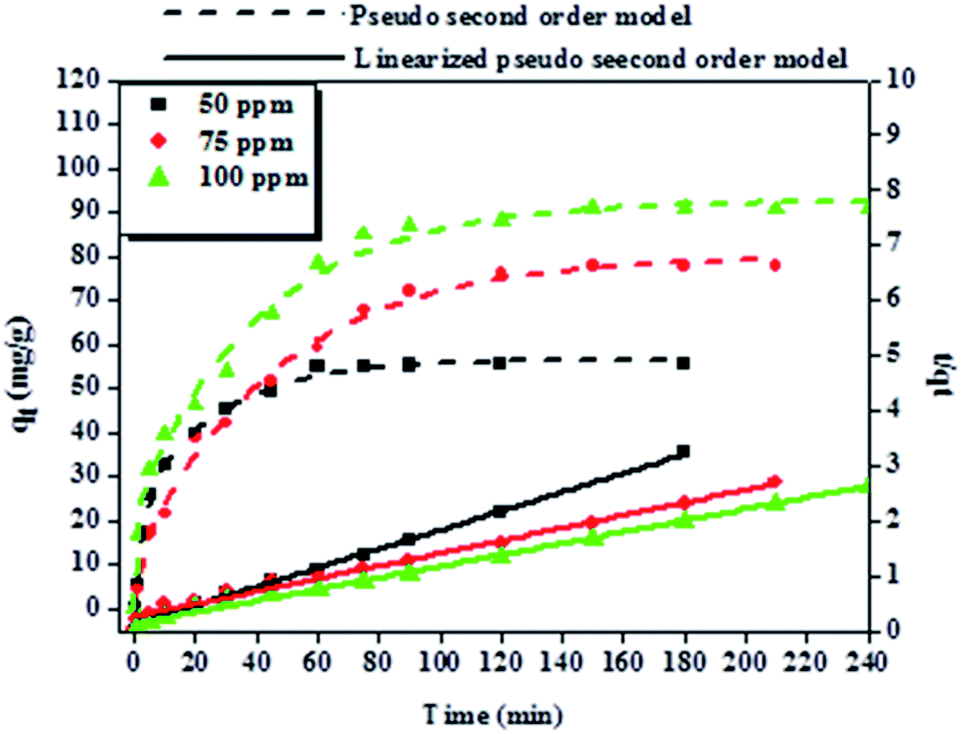 | ||
| Fig. 8 Adsorption kinetics and the pseudo-second-order kinetic plot of BPA adsorption onto 50 mg of PPY/PANI. Experimental conditions: 200 ml of various concentrations of BPA (50, 75 and 100 ppm) at pH 6.0 and at 23 °C. | ||
To explore the adsorption mechanism and reaction rates of BPA adsorption onto PPY/PANI, the kinetics data were subjected to the linearized forms of the Lagergren pseudo-first order (eqn (1)) and Ho pseudo-second order (eqn (2)) kinetic models given by,
|
ln(qe − qt) = lnqe − kt
| (1) |
 | (2) |
| Co (mg L−1) | Pseudo-first order model | Pseudo-second order model | ||||
|---|---|---|---|---|---|---|
| k1 (min−1) | qe (mg g−1) | R2 | k2 (g mg−1 min−1) | qe (mg g−1) | R2 | |
| 50 | 0.026 | 4.72 | 0.931 | 0.00152 | 60.6 | 0.998 |
| 75 | 0.011 | 6.54 | 0.992 | 0.00044 | 89.3 | 0.994 |
| 100 | 0.014 | 6.81 | 0.980 | 0.00072 | 97.1 | 0.996 |
Diffusion processes
Information about the adsorption mechanism provides valuable insights on the overall rate of adsorption, where a rate-limiting step of the adsorption of BPA onto PPY/PANI can be determined. This is useful for the design and optimization of adsorption system conditions.64 Adsorption dynamics can be described in four consecutive steps which are as follows: (i) film or surface diffusion where the adsorbate is transported from the bulk solution to the external surface of adsorbent, (ii) interparticle diffusion, (iii) intraparticle or pore diffusion, where the adsorbate molecules move into the interior of adsorbent particles, and (iv) chemical reaction on the sorbent surface.64 The first step is controlled by the stirring rate in the flask and the surface chemical reaction step is usually fast. Thus, the two steps cannot be the rate limiting steps and we can assume that one of the two or both the diffusion processes (step ii and iii) are the limiting steps and consequently. To describe the interparticle diffusion, the transfer of BPA onto a solid phase can be modeled by relation eqn (3).
 | (3) |
 | (4) |
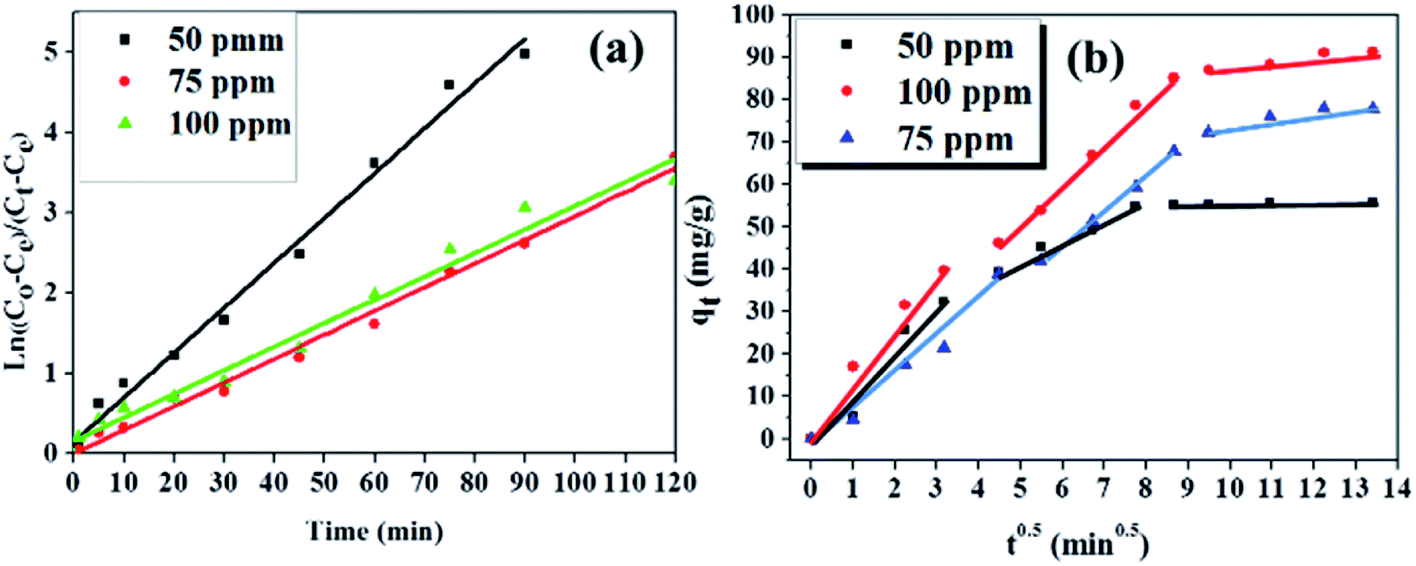 | ||
| Fig. 9 Diffusion models showing (a) interparticle and (b) intraparticle. Experiments conditions: 200 ml of various concentrations of BPA (50, 75 and 100 ppm) at pH 6.0 and at 23 °C adsorbed onto 50 mg of PPY/PANI. | ||
| Interparticle diffusion model | Intraparticle diffusion model | ||||
|---|---|---|---|---|---|
| Co (mg L−1) | k′ | R2 | Kp (mg g−1 min−0.5) | C (mg g−1) | R2 |
| 50 | 0.053 | 0.990 | 4.56 | 1.93 | 0.995 |
| 75 | 0.030 | 0.991 | 7.68 | 0.09 | 0.996 |
| 100 | 0.036 | 0.977 | 9.64 | 2.31 | 0.998 |
The intraparticle diffusion can also be a significant step in this adsorption diffusion process. The Weber–Morris relation (eqn (5)) is used to define the intraparticle diffusion mechanism. This is denoted by the relationship between the time-dependent adsorption capacity (qt) and the t0.5 shown in eqn (5).
| qt = KPt0.5 + C | (5) |
The slopes of the first two linear segments of the plots in Fig. 9b were also scrutinized to investigate the rates of reactions during the diffusion steps. Here it was observed that although both diffusion steps were rate limiting, the slopes of the first linear segments were steeper than the slopes of the second linear segments. This meant that the intraparticle diffusion step was slower than the interparticle diffusion step, in all the BPA concentrations investigated.64
Meanwhile, the intraparticle diffusion constant Kp and the intercept (C) were calculated from the second linear segment of the plots and were given in Table 2.
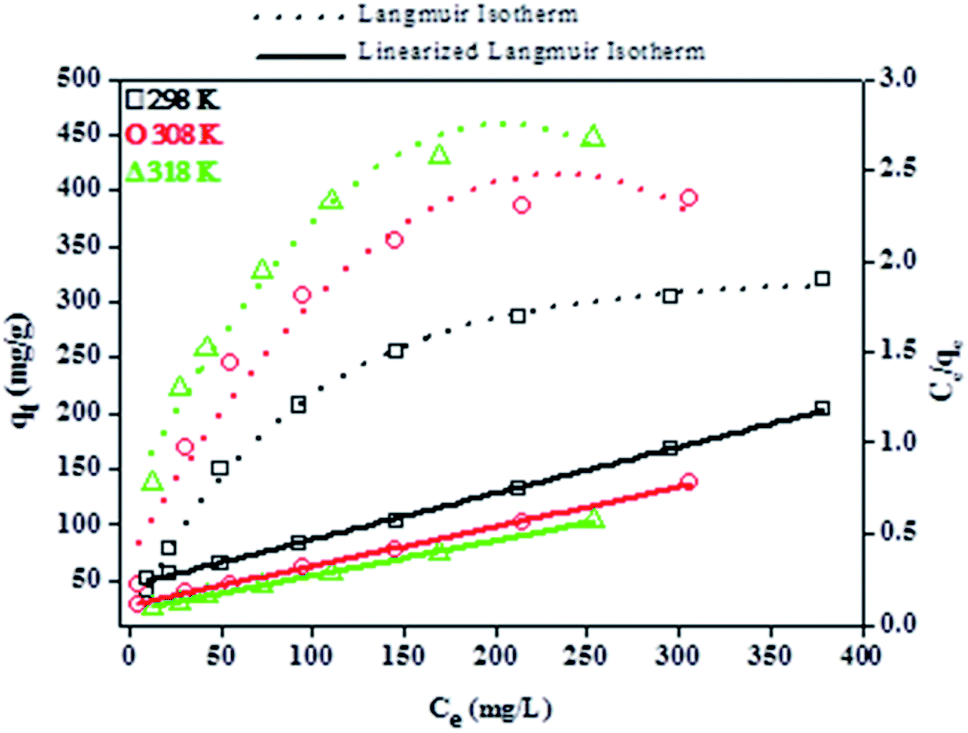 | ||
| Fig. 10 Effect of solution temperature on the removal of BPA using PPY/PANI where the temperature is varied from 298 to 318 K. Experimental conditions: 200 ml of 50 ppm BPA and 100 mg PPY/PANI. | ||
It was seen that a significant increase in BPA uptake by PPY/PANI was observed with increasing temperature, suggesting that the adsorption of BPA onto PPY/PANI was endothermic. This was attributed to that, an increase in solution temperature resulted in increased mobility of the BPA molecules thus resulting in an increased driving force towards the adsorption sites of PPY/PANI.
Furthermore, the relationship between the amount of BPA adsorbed and the respective equilibrium concentration of BPA molecules in the liquid phase was assessed by subjecting the experimental isotherm data to the linearized forms of the Langmuir and Freundlich isotherm models. The linearized Langmuir isotherm, which is based on the monolayer adsorption on the adsorbent surface with identical adsorption sites, is represented by eqn (6):
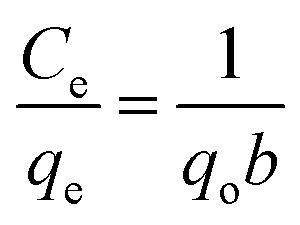 | (6) |
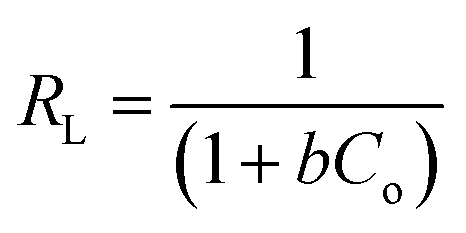
Moreover, an essential characteristic of the Langmuir model, a dimensionless separation factor (RL) used for defining the favourability of an adsorption process, was determined using eqn (7):
 | (7) |
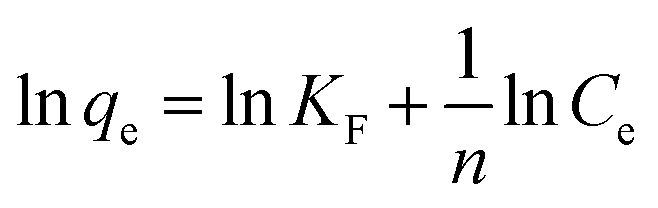 | (8) |
The Langmuir and Freundlich parameters were calculated from their respective linear plots, they were determined from the corresponding slopes and intercepts (Table 3). Higher correlation coefficients were observed when the adsorption data was fitted into the Langmuir model (Fig. 10) as opposed to when fitted into the Freundlich model (linear plot not shown). Moreover, the Langmuir maximum adsorption capacity, qo, corresponded adequately with the experimental adsorption capacities, qe, achieved for BPA adsorption onto PPY/PANI, for all the investigated temperatures. The values of RL at different temperatures were found to be in the 0–1 range, indicating that the adsorption process was favorable.
| T (K) | qo (mg g−1) | Langmuir isotherm | Freundlich isotherm | ||||
|---|---|---|---|---|---|---|---|
| b (L mg−1) | RL | R2 | KF (mg g−1) | 1/n | R2 | ||
| 298 | 400 | 0.012 | 0.27 | 0.998 | 13.3 | 0.570 | 0.954 |
| 308 | 455 | 0.021 | 0.16 | 0.999 | 23.4 | 0.536 | 0.948 |
| 318 | 526 | 0.026 | 0.10 | 0.999 | 56.4 | 0.396 | 0.964 |
 | (9) |
| ΔG° = ΔH° − TΔS° | (10) |
Kc versus 1/T plot (Fig. S6†). The Gibbs free energies (ΔG°) were calculated from eqn (10) and the results are given in Table S1.† The negative values of ΔG° at 35 °C and 45 °C temperatures studied are due to the fact that the adsorption process is spontaneous. The negative value of ΔH° suggests the exothermic nature of adsorption. The positive value of ΔS° suggests increased randomness at the solid/solution interface during the adsorption of BPA onto PPY/PANI-Fe0 composite.Adsorption mechanism
The adsorption mechanism between organic contaminants and carbon-based adsorbents usually involves electrostatic interactions.18,67 Electrostatic interactions can either be repellent or attractive and this depends mostly on the charge densities of both the adsorbate and the adsorbent, which is influenced by the solution pH. In this work, we reported that the adsorption of BPA onto PPY/PANI was influenced by pH. This was further demonstrated by studying the pzc of PPY/PANI. It was found that at high pH values the surface of the adsorbent accumulates a negative charge which is repellent to the negatively charged anions that BPA exist as at high pH values. Therefore, electrostatic interactions were part of the adsorption mechanism. The structure of BPA and that of both PPY and PANI consists of aromatic rings with delocalized π electrons; therefore π–π non-electrostatic interactions were also part of the adsorption mechanism. It was also found that PPY/PANI is a relatively hydrophobic material at pH 6.2 (contact angle of 77.3°, Fig. S8†) and BPA is also hydrophobic. This means that the hydrophobic non-electrostatic interactions were also responsible for the adsorption of BPA onto PPY/PANI.Degradation of BPA
Oxidative radicals, hydroxyl radicals, in particular, are the species responsible for the degradation of organic compounds in Fenton reactions. In order to investigate if HO˙ were responsible for the degradation of BPA using Fe0-PPY/PANI and H2O2 in this work, BPA degradation experiments were carried out in the presence and absence of methanol and iodide ions. Methanol is capable of neutralizing hydroxyl radicals by scavenging them. The rate constant of the reaction between methanol and hydroxyl radicals is high (eqn (11)).| CH3OH + HO˙ → CH3OH˙ + H2O, (k = 9.7 × 10⁸ M−1 s−1 | (11) |
Iodide ions also scavenge hydroxyl radicals. Furthermore, iodide anions get adsorbed onto the catalyst easier than methanol. Therefore, when comparing methanol scavenging and iodide scavenging, it is possible to differentiate if the reaction occurs mostly on the material surface or in solution.51 The rate constant for this reaction is defined as (eqn (12)):68
| HO˙ + I− → I˙ + OH−, (k = 1.02 × 10¹⁰ M−1 s−1) | (12) |
It was detected that the experiment conducted without a scavenger yielded high BPA removal efficiency as compared to the experiments conducted in the presence of methanol and potassium iodide (Fig. 11). This indicated that hydroxyl radicals were responsible for the degradation of BPA in these experiments. Furthermore, it also observed that iodide ions attenuated the removal of BPA more than methanol, indicating that hydroxyl radicals were primarily surface-bound.69,70
 | ||
| Fig. 11 Effect of methanol and potassium iodide on the removal of BPA. Experimental conditions: 200 ml of 50 ppm BPA at pH 6 with 100 mg Fe0-PPY/PANI and 5 mM KI or 350 mM methanol. | ||
In order to further investigate the mechanism at which BPA was removed, HPLC-MS analysis was conducted on aliquots sampled at 0 min, 30 min, and 180 min. This was from an experiment where BPA was degraded in the absence of any other additional contaminant or radical scavenger. It was observed that the BPA chromatogram consisted of only 1 peak at a retention time of 15.8 min and it was attributed to BPA (Fig. 12a).
 | ||
| Fig. 12 Chromatograms of the aliquots sampled at (a) 0 min, (b) 30 min, (c) 180 min and (d) is the MS spectrum of the aliquot sample at 180 min. Experimental conditions: 200 ml of 50 ppm BPA at pH 6 with 100 mg Fe0-PPY/PANI. | ||
 | ||
| Fig. 13 Advanced Fenton reaction mechanism for the degradation of BPA using Fe0-PPY/PANI. | ||
The chromatogram of the aliquot sampled at 30 min had 3 peaks, the original BPA peak, and two others at 6.22 and 9.69 min. The peak at 6.22 min was identified as 3-(4-hydroxyphenyl)-3-methyl-2-oxobutanoic acid (m/z 207 negative mode) whereas the peak at 9.69 was identified as 4-ethynylphenol (m/z 118 negative mode) (Fig. 12b). The intensity of BPA after 30 minutes was significantly smaller than that of BPA before the reaction commenced. This showed that BPA was removed from the sample and that smaller compounds were formed as a direct result of its degradation.
The chromatogram of the aliquot sampled at 180 min consisted of several peaks, including the 3 compounds identified above. The other compounds at 13.33 and 8.31 min were identified as 1-(-4-hydroxyphenyl)ethanone (m/z 135 negative mode and 4-(prop-1-en-2-yl)phenol (m/z 133), respectively (Fig. 12c). Furthermore, the mass spectrum of the aliquot sampled at 180 min was recorded (Fig. 11d). Here, the peaks representing peaks that were identified on the corresponding chromatogram (Fig. 11c) were observed and identified with asterisks on Fig. 11d. Unfortunately, the rest of the peaks, both on the chromatogram (Fig. 12c) and mass spectrum (Fig. 12d) were not identified. Nevertheless, it is clear that BPA was degraded and other compounds were formed as a result. The degradation by-products that were identified in this work were previously identified in other reports, were BPA was degraded using different techniques like the one reported in this work. For instance, in one article they reported the ultrasonic degradation of BPA and they identified compounds that were identified in this work.71 In another study by Fukahori et al. their BPA photodecomposition experiments also yielded compounds that were identified in this work.72 These reports also attributed the degradation of BPA and formation of these intermediates to the action of hydroxyl radicals, further supporting the postulation made in this report. Furthermore, it was found from TOC measurements that the amount of organic carbon had been reduced by 57%, showing that some of the BPA had been turned into possibly CO2. The possible degradation mechanism from looking at the paper holistically is as follows. The first step is that BPA gets adsorbed onto Fe0-PPY/PANI (see Fig. 5a, where it was shown that Fe0-PPY/PANI removed more than 50% of BPA by absorption). This is crucial as in advanced oxidation processes adsorbed pollutant molecules get degraded quicker than the pollutant molecules in solution. In the presence of H2O2 in an acidic medium, Fe0 immobilized on PPY/PANY was oxidized to Fe2+ on the surface of Fe0-PPY/PANI (eqn (13)). This is represented as Fe2+-PPY/PANI. Further evidence for that Fe0 was oxidized to Fe2+ on the surface of the composite was deduced from that iodide ions reduced the removal efficiency of BPA better than methanol.
| Fe0-PPY/PANI + H2O2 → Fe2+-PPY/PANI + 2OH− | (13) |
It was also shown by the use of methanol and potassium iodide as scavengers that hydroxyl radicals were responsible for the degradation of BPA. Therefore the next step after the oxidation of Fe0-surface to Fe2+-surface is the reaction between iron species and H2O2 to form the hydroxyl radicals. From here on, a series of chemical reactions occurred until BPA was degraded into smaller products and subsequently CO2. Some of the chemical reactions that occurred are represented by the following chemical equations. The general mechanism is conceptualized graphically in Fig. 13.
| Fe2+-surface + H2O2 → Fe3+-surface + 2HO˙ | (14) |
| Fe2+-surface + H2O2 → Fe3+-surface + HO− + HO˙ | (15) |
| HO˙ + BPA → degradation by-products → CO2 + H2O | (16) |
Conclusions
A series of polymeric and/or iron zero-based materials were synthesized and used as adsorbents and as Fenton catalysts along with H2O2 towards the removal of BPA in water. It was seen that polymeric materials were more potent at adsorption whereas materials that contained Fe0 were more active at Fenton reactions. The presence of other organic contaminants reduced the BPA in both adsorption and Fenton reactions, whereas increasing the ionic strength of the solution favored the removal of BPA in Fenton reactions. In these experiments, it was seen that PPY/PANI was the most potent adsorbent, while Fe0-PPY/PANI was found to be the best Fenton catalyst. Unfortunately, the adsorbents and Fenton catalysts were not as effective for removing BPA in the presence of sewage-water, even the TOC removal efficiency was low but it was shown that at the mass of catalyst or adsorbent and H2O2 concentration, the efficiencies could be increased. The adsorption of BPA onto PPY/PANI was characterized by the pseudo-second-order kinetics model whereas Fe0-PPY/PANI activated H2O2 to form hydroxyl radicals that were then responsible for the removal of BPA. This report demonstrates the synthesis of potent adsorbent and Fenton catalyst for the removal of BPA. The synthesis procedure is a relatively easy one and the materials are relatively eco-friendly.Conflicts of interest
The authors declare that there is no conflict of interest.Acknowledgements
The authors would like to express their gratitude to the Council of Scientific and Industrial Research for providing the facilities and resources under project number HP1312P. The University of Witwatersrand, the Microanalysis and Microscopy (MMU) in particular is acknowledged for their assistance with characterization. Prof. Ndinteh from the University of Johannesburg assisted with TOC measurements; his contribution is appreciated by the authors.Notes and references
- C. A. Staples, P. B. Dom, G. M. Klecka, T. O. Sandra and L. R. Harris, Chemosphere, 1998, 36, 2149–2173 CrossRef CAS PubMed.
- C. D. Kassotis, D. A. Alvarez, J. A. Taylor, S. Frederick, S. C. Nagel and D. E. Tillitt, Sci. Total Environ., 2015, 524–525, 384–393 CrossRef CAS PubMed.
- H. Fukazawa, K. Hoshino, T. Shiozawa, H. Matsushita and Y. Terao, Chemosphere, 2001, 44, 973–979 CrossRef CAS.
- G. Mezohegyi, B. Erjavec, R. Kaplan and A. Pintar, Ind. Eng. Chem. Res., 2013, 52, 9301–9307 CrossRef CAS.
- M. Boas, U. Feldt-Rasmussen and K. M. Main, Mol. Cell. Endocrinol., 2012, 355, 240–248 CrossRef CAS PubMed.
- J. A. Rogers, L. Metz and V. W. Yong, Mol. Immunol., 2013, 53, 421–430 CrossRef CAS PubMed.
- N. Casajuana and S. Lacorte, Chromatographia, 2003, 57, 649–655 CrossRef CAS.
- J. Muncke, J. Steroid Biochem. Mol. Biol., 2011, 127, 118–127 CrossRef CAS PubMed.
- D.-K. Li, Z. ZhiJun, M. Maohua, H. Yonghua, W. JinTao, J. Ferber, L. J. Herrinton, E. Gao and W. Yuan, Fertil. Steril., 2011, 95, 625–630 CrossRef CAS PubMed.
- T. Paulose, L. Speroni, C. Sonnenschein and A. M. Soto, Reprod. Toxicol., 2015, 54, 58–65 CrossRef CAS PubMed.
- K. L. Howdeshell, P. H. Peterman, B. M. Judy, J. A. Taylor, C. E. Orazio, R. L. Ruhlen, F. S. vom Saal and W. V. Welshons, Environ. Health Perspect., 2003, 111, 1180–1187 CrossRef CAS.
- T. A. Ternes, J. Stuber, N. Herrmann, D. Mcdowell, A. Ried, M. Kampmann and B. Teiser, Water Res., 2003, 37, 1976–1982 CrossRef CAS.
- J. Matos, J. Laine and J. Herrmann, Appl. Catal. B Environ., 1998, 18, 281–291 CrossRef CAS.
- L. Hlekelele, P. J. Franklyn, F. Dziike and S. H. Durbach, New J. Chem., 2018, 42, 4531–4542 RSC.
- M. Mezcua, M. A. Martínez-Uroz, M. M. Gómez-Ramos, M. J. Gómez, J. M. Navas and A. R. Fernández-Alba, Talanta, 2012, 100, 90–106 CrossRef CAS PubMed.
- E. Erdem, N. Karapinar and R. Donat, J. Colloid Interface Sci., 2004, 280, 309–314 CrossRef CAS PubMed.
- V. K. Gupta and I. Ali, Water Res., 2001, 35, 33–40 CrossRef CAS PubMed.
- C. Moreno-Castilla, Carbon, 2004, 42, 83–94 CrossRef CAS.
- V. C. Srivastava, M. M. Swamy, I. D. Mall, B. Prasad and I. M. Mishra, Colloids Surf., A, 2006, 272, 89–104 CrossRef CAS.
- A. Dabrowski, P. Podkosccielny, Z. Hubicki and M. Barczak, Chemotherapy, 2005, 58, 1049–1070 CAS.
- L. Hao, H. Song, L. Zhang, X. Wan, Y. Tang and Y. Lv, J. Colloid Interface Sci., 2012, 369, 381–387 CrossRef CAS.
- Y. Wang, H. Sun, X. Duan, H. M. Ang, M. O. Tadé and S. Wang, Appl. Catal., B, 2015, 172–173, 73–81 CrossRef CAS.
- D. O. Carroll, B. Sleep, M. Krol, H. Boparai and C. Kocur, Adv. Water Resour., 2013, 51, 104–122 CrossRef.
- F. V. Avelar Dutra, B. C. Pires, T. A. Nascimento, V. Mano and K. B. Borges, RSC Adv., 2017, 7, 12639–12649 RSC.
- F. V. A. Dutra, B. C. Pires, T. A. Nascimento and K. B. Borges, J. Environ. Manage., 2018, 221, 28–37 CrossRef CAS.
- T. A. Do Nascimento, F. V. A. Dutra, B. C. Pires and K. B. Borges, New J. Chem., 2018, 42, 7030–7042 RSC.
- B. C. Pires, F. V. A. Dutra, T. A. Nascimento and K. B. Borges, React. Funct. Polym., 2017, 113, 40–49 CrossRef CAS.
- H. Liu, H. Zhang and H. Yang, Chin. J. Catal., 2014, 35, 66–77 CrossRef CAS.
- A. T. Kuvarega, Photocatalytic performance of nitrogen-platinum group metal co-doped TiO2 supported on carbon nanotubes for visible-light degradation of organic pollutants in water, University of Johannesburg, 2012 Search PubMed.
- L. Hlekelele, P. J. Franklyn, P. K. Tripathi and S. H. Durbach, RSC Adv., 2016, 6, 76773–76779 RSC.
- W. Liu, H. Zhang, B. Cao, K. Lin and J. Gan, Water Res., 2010, 45, 1872–1878 CrossRef.
- P. Bautista, A. F. Mohedano, J. A. Casas, J. A. Zazo and J. J. Rodriguez, J. Chem. Technol. Biotechnol., 2008, 83, 1323–1338 CrossRef CAS.
- Y. Ohko, A. Isao, N. Chisa, T. Tetsu, Y. Tsuyoshi, N. Tetsuto, F. Yoshinobu, Y. Kubota and A. Fujishima, Environ. Sci. Technol., 2001, 35, 2365–2368 CrossRef CAS.
- F. Dziike, P. J. Franklyn, S. H. Durbach, M. Maubane and L. Hlekelele, Mater. Res. Bull., 2018, 104, 220–226 CrossRef CAS.
- C. Liao, Z. D. Wei, S. G. Chen, L. Li, M. B. Ji, Y. Tan and M. J. Liao, J. Phys. Chem. C, 2009, 113, 5705–5710 CrossRef CAS.
- R. Ahmad and R. Kumar, J. Chem. Eng. Data, 2010, 55, 3489–3493 CrossRef CAS.
- K. Zebedius, M. Bhaumik, S. Songwane, M. S. Onyango and A. Maity, Chem. Eng. J., 2013, 222, 186–197 CrossRef.
- J. Li, J. Feng and W. Yan, Appl. Surf. Sci., 2013, 279, 400–408 CrossRef CAS.
- M. Bhaumik, R. I. Mccrindle and A. Maity, Chem. Eng. J., 2015, 260, 716–729 CrossRef CAS.
- R. V. Kumar, A. K. Basumatary, A. K. Ghoshal and G. Pugazhenthi, RSC Adv., 2015, 5, 6246–6254 RSC.
- L. Hlekelele, P. J. Franklyn, F. Dziike and S. H. Durbach, New J. Chem., 2018, 42, 1902–1912 RSC.
- Y. Ma, S. Jiang, G. Jian, H. Tao, L. Yu and X. Wang, Energy Environ. Sci., 2009, 2, 224–229 RSC.
- X. Zhang, J. Zhang, W. Song and Z. Liu, J. Mater. Sci. Mater. Electron., 2006, 110, 1158–1165 CAS.
- T. Wu and Y. Lin, Polymer, 2006, 47, 3576–3582 CrossRef CAS.
- Y. Hwang, D. Kim and H. Shin, J. Hazard. Mater., 2011, 185, 1513–1521 CrossRef CAS PubMed.
- A. Rahy, T. Rguig, S. June, C. E. Bunker and D. Joo, Synth. Met., 2011, 161, 280–284 CrossRef CAS.
- M. A. Chougule, S. Sen and V. B. Patil, J. Appl. Polym. Sci., 2012, 125, 542–547 CrossRef.
- J. Heo, J. R. V. Flora, N. Her, Y. Park, J. Cho, A. Son and Y. Yoon, Sep. Purif. Technol., 2012, 90, 39–52 CrossRef CAS.
- S. Li, Y. Gong, Y. Yang, C. He, L. Hu, L. Zhu and L. Sun, Chem. Eng. J., 2015, 260, 231–239 CrossRef CAS.
- A. Shimizu, M. Tokumura, K. Nakajima and Y. Kawase, J. Hazard. Mater., 2012, 201–202, 60–67 CrossRef CAS PubMed.
- L. Gomathi Devi, S. Girish Kumar, K. Mohan Reddy and C. Munikrishnappa, J. Hazard. Mater., 2009, 164, 459–467 CrossRef CAS PubMed.
- E. Neyens and J. Baeyens, J. Hazard. Mater., 2003, 98, 33–50 CrossRef CAS PubMed.
- P. V. Nidheesh and R. Gandhimathi, Desalination, 2012, 299, 1–15 CrossRef CAS.
- F. Lücking, H. Köser, M. Jank and A. Ritter, Water Res., 1998, 32, 2607–2614 CrossRef.
- L. Joseph, J. Heo, Y. G. Park, J. R. V. Flora and Y. Yoon, Desalination, 2011, 281, 68–74 CrossRef CAS.
- J. J. Pignatello, S. Kwon and Y. Lu, Environ. Sci. Technol., 2006, 40, 7757–7763 CrossRef CAS PubMed.
- J. E. Kilduff and A. Wigton, Environ. Sci. Technol., 1999, 33, 250–256 CrossRef CAS.
- I. Bautista-Toledo, M. A. Ferro-García, J. Rivera-Utrilla, C. Moreno-Castilla and F. J. V. Fernández, Environ. Sci. Technol., 2005, 39, 6246–6250 CrossRef CAS PubMed.
- G. Liu, J. Ma, X. Li and Q. Qin, J. Hazard. Mater., 2009, 164, 1275–1280 CrossRef CAS PubMed.
- W. Ma, N. Wang, Y. Du, T. Tong, L. Zhang, K. Y. Andrew Lin and X. Han, Chem. Eng. J., 2019, 356, 1022–1031 CrossRef CAS.
- Y. Feng, P. Lee, D. Wu and K. Shih, Environ. Sci. Technol., 2017, 51, 2312–2320 CrossRef CAS PubMed.
- A. Enakpodia and E. Iyayi, J. Taiwan Inst. Chem. Eng., 2013, 44, 566–576 CrossRef.
- E. I. Unuabonah, G. U. Adie, L. O. Onah and O. G. Adeyemi, Chem. Eng. J., 2009, 155, 567–579 CrossRef CAS.
- H. K. Boparai, M. Joseph and D. M. O. Carroll, J. Hazard. Mater., 2011, 186, 458–465 CrossRef CAS.
- Y. S. Al-Degs, M. I. El-Barghouthi, A. H. El-Sheikh and G. M. Walker, Dyes Pigm., 2008, 77, 16–23 CrossRef CAS.
- I. Demiral, T. Fatma and B. Karabacako, Chem. Eng. J., 2008, 144, 188–196 CrossRef.
- W. Chen, L. Duan, D. Zhu, W. E. I. Chen and L. I. N. Duan, Environ. Sci. Technol., 2007, 41, 8295–8300 CrossRef CAS.
- J. K. Thomas, Trans. Faraday Soc., 1965, 61, 702–707 RSC.
- Z. Wan and J. Wang, J. Hazard. Mater., 2017, 324, 653–664 CrossRef CAS PubMed.
- W. Raza, S. M. Faisal, M. Owais, D. Bahnemann and M. Muneer, RSC Adv., 2016, 6, 78335–78350 RSC.
- R. A. Torres, C. Pétrier, E. Combet, M. Carrier and C. Pulgarin, Ultrason. Sonochem., 2008, 15, 605–611 CrossRef CAS.
- S. Fukahori, H. Ichiura, T. Kitaoka and H. Tanaka, Appl. Catal. B Environ., 2003, 46, 453–462 CrossRef CAS.
Footnote |
| † Electronic supplementary information (ESI) available. See DOI: 10.1039/c9ra01666j |
| This journal is © The Royal Society of Chemistry 2019 |