
 Open Access Article
 This Open Access Article is licensed under a Creative Commons Attribution-Non Commercial 3.0 Unported Licence
Microscopic measurements on the decomposition behaviour of methane hydrates formed in natural sands†
Long Wenabc,
Xuebing Zhouab and
Deqing Liang *ab
*ab
aCAS Key Laboratory of Gas Hydrate, Guangzhou Institute of Energy Conversion, Guangzhou Center for Gas Hydrate Research, Chinese Academy of Sciences, Guangzhou 510640, China. E-mail: liangdq@ms.giec.ac.cn
bGuangdong Provincial Key Laboratory of New and Renewable Energy Research and Development, Guangzhou 510640, China
cUniversity of Chinese Academy of Sciences, Beijing 100049, People's Republic of China
First published on 13th May 2019
Abstract
In this work, the decomposition behaviour of methane hydrate in porous media was investigated microscopically using powder X-ray diffraction, cryogenic scanning electron microscopy and in situ Raman spectroscopy. The effect of grain sizes on the decomposition of methane hydrate was measured. The results showed that bulk hydrates could exist stably at 223 K and atmospheric pressure because of the self-preservation effect. However, hydrate formed in sands was relatively easier to decompose because it had a higher equilibrium pressure compared with bulk hydrate at the same temperature. In this case, there would be a higher decomposition driving force. Interestingly, the complete decomposition time for hydrate formed in sands did not decrease with the decrease in particle size. The shortest decomposition time was observed for the sands with the particle size range of 38–55 μm, which was less than 30 minutes. Moreover methane hydrate was found to decompose faster in the porous medium containing 3.5 wt% NaCl, which suggested that there was almost no self-preservation effect. In situ Raman measurements showed that the integrated intensity ratio of methane in large and small cages (AL/AS) did not change during the decomposition process, suggesting that the methane hydrate crystal units decomposed as an entity in sands. This study provided important data as a basis for drilling fluid technology in hydrate mining.
1. Introduction
Natural gas hydrates, commonly known as “combustible ice”, are compounds with special cage structures that are widely distributed in deep seabed sediments and in permafrost.1 It has been estimated that the global reserves of natural gas hydrates are 2.1 × 10¹⁶ m3, which is double of the existing reserves of natural oil and gas.2 Due to their high combustion heat value and pollution-free characteristics, natural gas hydrates are considered to represent the world's largest hydrocarbon reservoir and are thus an important source of energy that could be exploited in the coming decades.3 In terms of exploiting this new energy source, the United States, Japan, Canada, Germany, Norway, South Korea, India, Singapore and other countries have conducted extensive research and made great progress.4–6 China started late in the field of natural gas hydrate research, but it has also achieved tremendous advances. In May 2017, China conducted the first trial production in the mud sediments of the Shenhu Sea Area in the South China Sea was achieved, with the total accumulated gas production exceeding 3 × 10⁵ m3, and a variety of porous medium argillaceous silt-type hydrate samples, such as layered, massive, nodular, vein-like, and dispersed samples, were acquired.7,8 Based on the destruction of the phase equilibrium of natural gas hydrates in porous media, the natural gas hydrate production process is actually a phase change process after solid hydrates absorb heat decomposition in sediments.9 Therefore, from a theoretical perspective, it is very important to study the decomposition of natural gas hydrates in muddy silty sediment for the commercialization of hydrate mining in the future.In addition to the pressure and temperature changes, factors such as sediment type,10,11 salinity,12–14 permeability,15 particle size,16–20 and pore effect.21 can also affect the kinetics of hydrates decomposition in porous media. Siangsai et al.,11 investigating hydrates decomposition in activated carbon with different particle sizes (250–420 μm, 420–841 μm, and 841–1680 μm), found that the highest methane recovery percentage was achieved at experimental pressures of 6 MPa and 4.5 MPa for 250–420 μm activated carbon decomposition and the methane production was in the range 79.2–99.1%. However, at the laboratory level, to more closely investigate the hydrate decomposition characteristics of sediments in the natural world, it is generally better to use natural sand or quartz as the porous medium.17 Liu et al. used a multistep decomposition method to study hydrate stability under different systems (aqueous solution, quartz sand, and marine sediment). They found that the capillary effect of pores in fine-grained (<35 μm) quartz sands was significant, and the stability temperature of methane hydrates was reduced by 1.5 K at the maximum.22 Sun et al. found that the pore effect of coarse-grained silica sand was negligible, ranging from 63 μm to 2000 μm, whereas the temperature of the equilibrium curve decreased in fine-grained silica sand (<4 to 250 μm).23,24 Chong et al. selected siliceous sand ranging from silt (0.063 mm) to granular pebbles (3 mm) to study changes in macro-basic parameters such as sand layer changes and gas production.17 Saw et al. found that sand size had no significant effect on hydrate enthalpy.19 The hydrate decomposition enthalpy was estimated from the measured phase equilibrium data using the Clausius–Clapeyron equation. However, compared with the study of hydrate decomposition kinetics in sediment, the decomposition mechanism in the microscopic range remains unclear. Various advanced experimental analysis techniques have been used to study hydrate decomposition in sediments, such as powder X-ray diffraction (PXRD),25 Raman spectroscopy,26,27 solid-state nuclear magnetic resonance (ssNMR),28 X-ray computed tomography (X-ray CT),29,30 magnetic resonance imaging (MRI),31 and cryogenic scanning electron microscopy (cryo-SEM).32 Using 13C magic-angle spinning nuclear magnetic resonance spectroscopy (13C MAS NMR), Gupta et al. studied the decomposition mechanism of I methane hydrate at the molecular scale level, and showed that the pure water methane hydrate-size cage did not preferentially decompose.33 Raman spectra indicated different displacements of C–H bond stretching vibration under different chemical environments, which could be used to analyze the physical properties of hydrate structure, size cage occupancy, and hydration number.3,27 Liu et al. used Raman spectroscopy to observe the decomposition of hydrates in four particle sizes of silica sand (53–75 μm, 90–106 μm, 106–150 μm, and 150–180 μm), and reported that the change in the average intensity ratio of large to small cages was basically consistent with the change in the average strength of the overall hydrate, but it dropped sharply after a period of time.34 This turning point seemed to be related to the particle size of the silica sand. Using cryo-SEM, the hydrate decomposition in sediments could be observed in real time. Stern and colleagues observed the morphological characteristics of NGHP-01 sample sediments and found that the hydrate decomposition gradually increased from a smooth surface to the appearance of a sponge-like or nanoporous surface, and the ice remained relatively stable and with little change.32,35,36
However, the effect of sand sediments with different particle sizes on the decomposition of hydrates has mainly been studied at the macroscopic level, and the microscopic kinetics of the decomposition process remain underexplored. In this paper, using cryo-SEM, PXRD, and Raman spectroscopy techniques, and taking into account the characteristics of sediments in the South China Sea,37 we investigated the microscopic decomposition kinetics of hydrates under different systems such as the crystal structure, cage occupancy, hydration number, and morphological changes. The data are expected to provide important theoretical support for commercial mining in the future.
2. Experimental methods
2.1. Experimental materials
Methane with a purity of >99.9% was supplied by Guangzhou Yuejia Gas Co., Ltd. Six sorts of fine-grained natural sand were screened by sieves of different grid sizes (100–150 mesh, 150–200 mesh, 200–300 mesh, 300–500 mesh, 500–1000 mesh, and 1000–2000 mesh) and washed. The corresponding median particle sizes of the six sorts of natural sands were 150, 87, 55, 38, 24 and 13 μm, respectively, which was determined by a laser particle size analyzer (nano ZS & Mastersizer 2000E, Malvern Instruments Ltd, Britain) as shown in Fig. 1.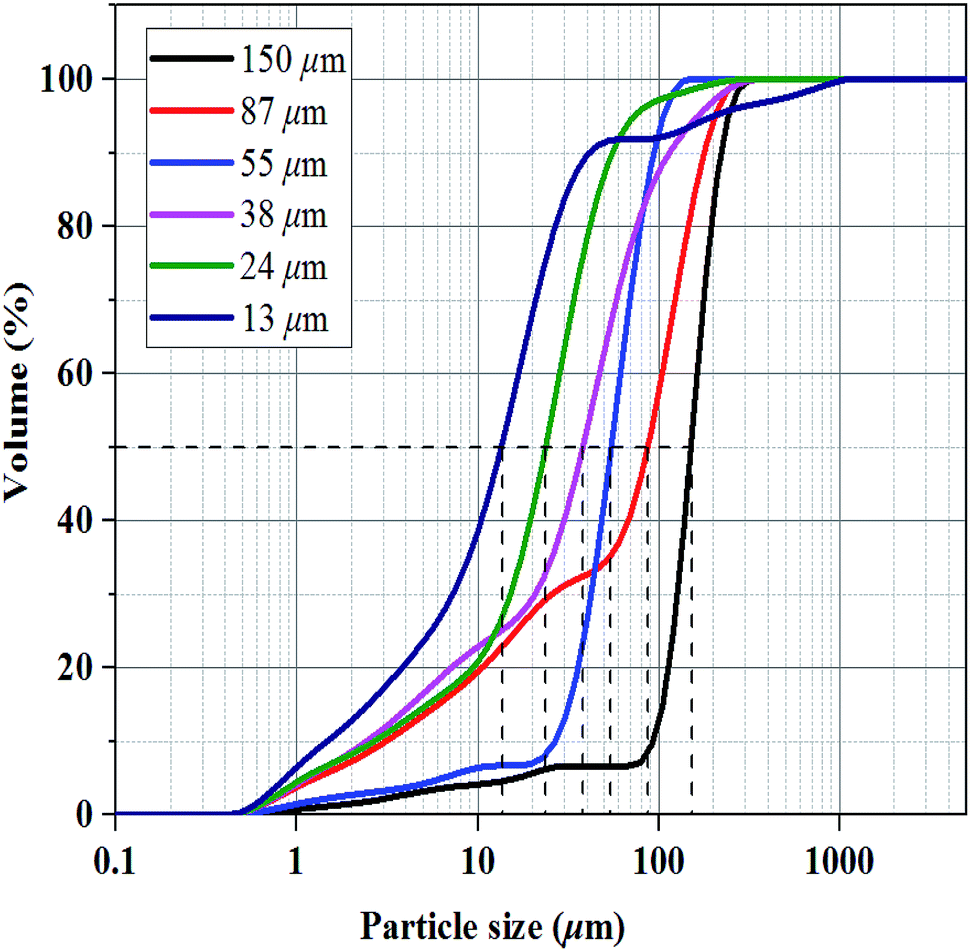 | ||
| Fig. 1 Particle size distribution of different sizes of natural sand. | ||
2.2. Sample preparation and microscopic test
The experimental procedures were similar to those described by Zhou et al.26 Firstly, the hydrate bearing sand were prepared in an autoclave with an internal volume of 100 mL. 5.5 mL deionized water and 20 mL of sand with a specific particle size were fully mixed in the autoclave, and shaped into a column. After being sealed, the autoclave was evacuated and immersed in a thermostatic bath precooled at 275 K. When the temperature reached stable, the autoclave was slowly pressurized to 11 MPa. After that, the temperature was set at 265 K and 278 K alternately and kept about 12 h for each. As the hydrate saturation reached certain values, the hydrate bearing sediments were thought to be well prepared. The autoclave was chilled down to about 200 K and opened. The formed hydrate bearing sediments were quickly shifted and preserved in liquid nitrogen. The calculation of the values of hydrate saturation was described by Chong et al.17 and Zhan et al.38 The initial saturation of hydrates in sediments was given in ESI (Table S1†).The sample was placed in the sample cell of the cryo-SEM (S-4800, Hitachi, Japan) and wrapped with tinfoil (in the sample process liquid nitrogen), then it was transferred to the sample preparation room at 133 K. After sublimation deicing, the sample was transferred to the electron microscope sample chamber 133 K cold plate so that we could observe the changes of the sample and shoot electronic images. The structural characterization of the hydrate sample at 223 K was measured by an PXRD (PANalytical, Netherlands) using CuK (λ = 1.5406 Å), with a scanning range of 2θ = 5–80°, a scan rate of 4° min−1, and a scan step size of 0.017. We used a Raman spectrometer (LabRAM HR Evolution, HORIBA, France) with temperature set at 223 K, an Ar+ laser as the excitation light source, selected wavelength of 523 nm, and under normal pressure and constant temperature conditions to determine the in situ decomposition of methane hydrate in sediments of different particle sizes, with a scanning range of 2500–4000 cm −1. The sample was quickly loaded into the sample chamber and the characteristic peak with strong signal was found by laser being focused on the spot of sample within about 10 min. In this case, the sample was thought to decompose from its initial state. The observation started by selecting the suitable scan interval according to the actual situation. The methane hydrates were thought to completely decompose when no obvious C–H signal was found. To ensure repeatability of the experiment, each experiment was carried out at least three times.
3. Results and discussion
3.1. Structural analysis of PXRD
Schicks et al. showed that structure I and structure II hydrate may coexist in the formation of methane hydrate under moderate conditions.39 To clarify the crystal structure of the hydrate, the characteristic PXRD patterns of porous media deposit samples of different particle sizes at 223 K are shown in Fig. 2. Due to the characteristic peaks corresponding to sand and impurities in samples, it would interfere with the hydrate spectrum causing minor deviation in degree. The reflections of the six sediment samples at 27–28° 2θ were assigned to the (320), (321) crystal planes of sI hydrate typically and the (101) crystal plane of ice reflects at ∼25.9°.25 The (440) crystal plane of sII hydrate reflecting at ∼29.3° had no corresponding characteristic peak in the spectrum, indicating that no sII hydrate was formed in the sediments. The crystal planes corresponding to these characteristic peaks were consistent with the literature data.26 The formed hydrate structure in the sediment was sI hydrate, indicating that the different particle sizes of sand had no effect on crystal structure and the corresponding characteristic peak intensity was related to the content of methane hydrate in samples.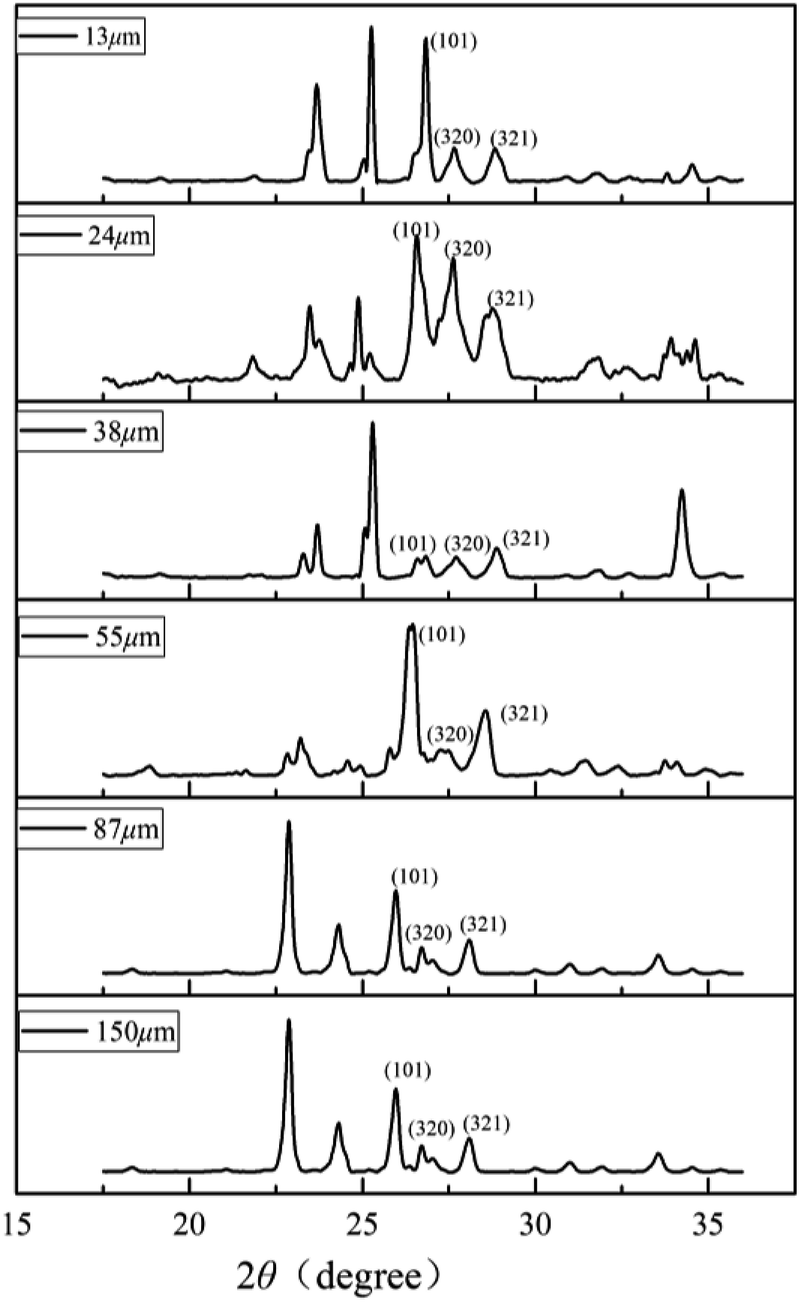 | ||
| Fig. 2 PXRD spectra of the six different particle size sediment samples containing hydrate. | ||
3.2. Analysis of Raman results
Raman spectroscopy is a very effective method to study the microstructure of hydrates. The basic principle is that molecular polarizability changes due to molecular vibration and the vibrational frequency difference of C–H bonds in different environments, resulting in a corresponding change in Raman shifts.40 Studies have shown that the Raman spectrum of pure methane gas is ∼2916 cm−1, and methane hydrates split double peaks in the stretching vibration. The interference of the free methane gas characteristic peak was eliminated by setting up a continuous twice laser scan in the LabSpec software. In the sI hydrate, the position of the Raman shift peak differed due to the different restrictions on the methane C–H bond by the hydrate cage and the small cage, whose stretching vibration peaks were ∼2905 cm−1 and 2915 cm−1, respectively.26,27As shown in Fig. 3, at the initial time, the vacancy size of the cage peaks of different size particles was basically the same as that of pure water. The peak displacements of the large cages and the small cages were ∼2902 cm−1 and 2912 cm−1, respectively. The Raman shift deviation of the measured peak spectrum was within the permissible range, which further proved that it only contained type I hydrate combining with the results from PXRD. The initial peak intensity was not related to the particle size, but the peak intensity of the pure methane hydrate system was significantly higher than the other samples. The integrated intensity of Raman peaks was directly proportional to the numbers of excited molecules within the analyzed volume. In the case of the sample containing sediments besides methane hydrate within the same volume, the number of methane molecules in the analyzed volume was clearly smaller comparing with the bulk hydrate phase without sediments, suggesting that sand and other impurities could affect the laser scanning hydrate. The ratio of integrated area of two characteristic peaks corresponding to large and small cages in hydrate (AL/AS) was calculated according to the deconvolution method. Then cage occupancy and the hydration number were calculated based on the relevant thermodynamic equations:41
| θL/θS = AL/3AS | (1) |
∇μ0w = −RT[3![[thin space (1/6-em)]](https://www.rsc.org/images/entities/char_2009.gif) ln(1 − θL) + ln(1 − θS)]/23 ln(1 − θL) + ln(1 − θS)]/23
| (2) |
| n = 23/(3θL + θS) | (3) |
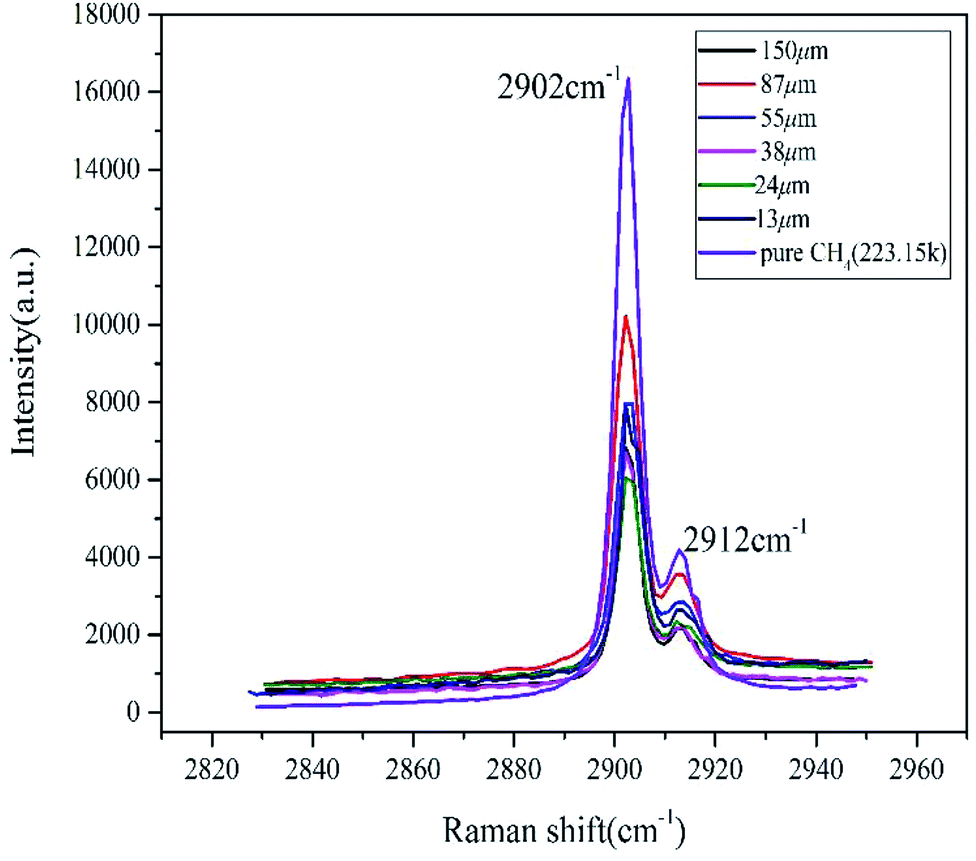 | ||
| Fig. 3 Raman spectra of initial decomposition of methane hydrate in natural sands with different particle sizes. | ||
Table 1 lists the cage occupancy of the large cages (51262) and small cages (512) and the hydration numbers at different initial time in the different systems. The hydration numbers in each system were found to be slightly higher than 6, but the bulk hydrate system was closer to stability, which is consistent with literature values.34,43 It should be noted that the cage occupancy of the methane hydrate was calculated by the Raman spectral characteristic peak area integral and fitting. It was found that the cage occupancy of small cages (512) was higher than that of large cages (51262) in the natural sand porous medium (θL < θS), which is opposite to that of bulk hydrate. For example, the cage occupancy of small and large cages was 0.9912 and 0.8995, respectively, in hydrate-bearing sediment with a median particle size of 87 μm, but 0.9228 and 0.9695, respectively, in bulk hydrate at 223 K. In related studies, the average cavity radius of 512 and 51262 was 3.95 Å and 4.33 Å, respectively, in sI hydrate.3,44 Although the amount of methane molecules, with a diameter of 4.36 Å,4 entering the 512 cavity was less than the number in the 51262 cavity, crystal defects were assumed to exist in the 51262 cavity, resulting in fewer methane molecules entering the cage than in bulk hydrate. This phenomenon might be related to the influence of silica itself on its crystal structure. Unfortunately, there are very few studies of how SiO2 affects the sI hydrate crystal structure using molecular dynamics simulation.
| System | Cage occupancy | Hydration | |
|---|---|---|---|
| Small cage | Large cage | Number | |
| 150 μm | 0.989 ± 0.0058 | 0.933 ± 0.0156 | 6.073 ± 0.0678 |
| 87 μm | 0.991 ± 0.0094 | 0.899 ± 0.0440 | 6.046 ± 0.0810 |
| 55 μm | 0.964 ± 0.0269 | 0.952 ± 0.0153 | 6.021 ± 0.0300 |
| 38 μm | 0.994 ± 0.0060 | 0.896 ± 0.0340 | 6.254 ± 0.1616 |
| 24 μm | 0.991 ± 0.0115 | 0.871 ± 0.0569 | 6.399 ± 0.2754 |
| 13 μm | 0.985 ± 0.0094 | 0.917 ± 0.0484 | 6.164 ± 0.2289 |
| 87μm + 3.5% NaCl | 0.995 ± 0.0034 | 0.909 ± 0.0201 | 6.179 ± 0.0973 |
| 24μm + 3.5% NaCl | 0.996 ± 0.0019 | 0.912 ± 0.0190 | 6.163 ± 0.0962 |
| Bulk hydrate | 0.923 ± 0.0051 | 0.969 ± 0.0007 | 6.003 ± 0.0047 |
Sample characteristic peak signal intensity changes with time are shown in Fig. 4, which represent the kinetic characteristics of hydrate decomposition in the six particle size deposits and bulk hydrate, respectively. We can clearly observe the Raman peak of the water molecules in the main structure of the hydrate caused by vibration of the H–O bond and distributed in the Raman shift range of 2830–3600 cm−1, which is also observed by Zhou et al.45 and Schicks et al.46
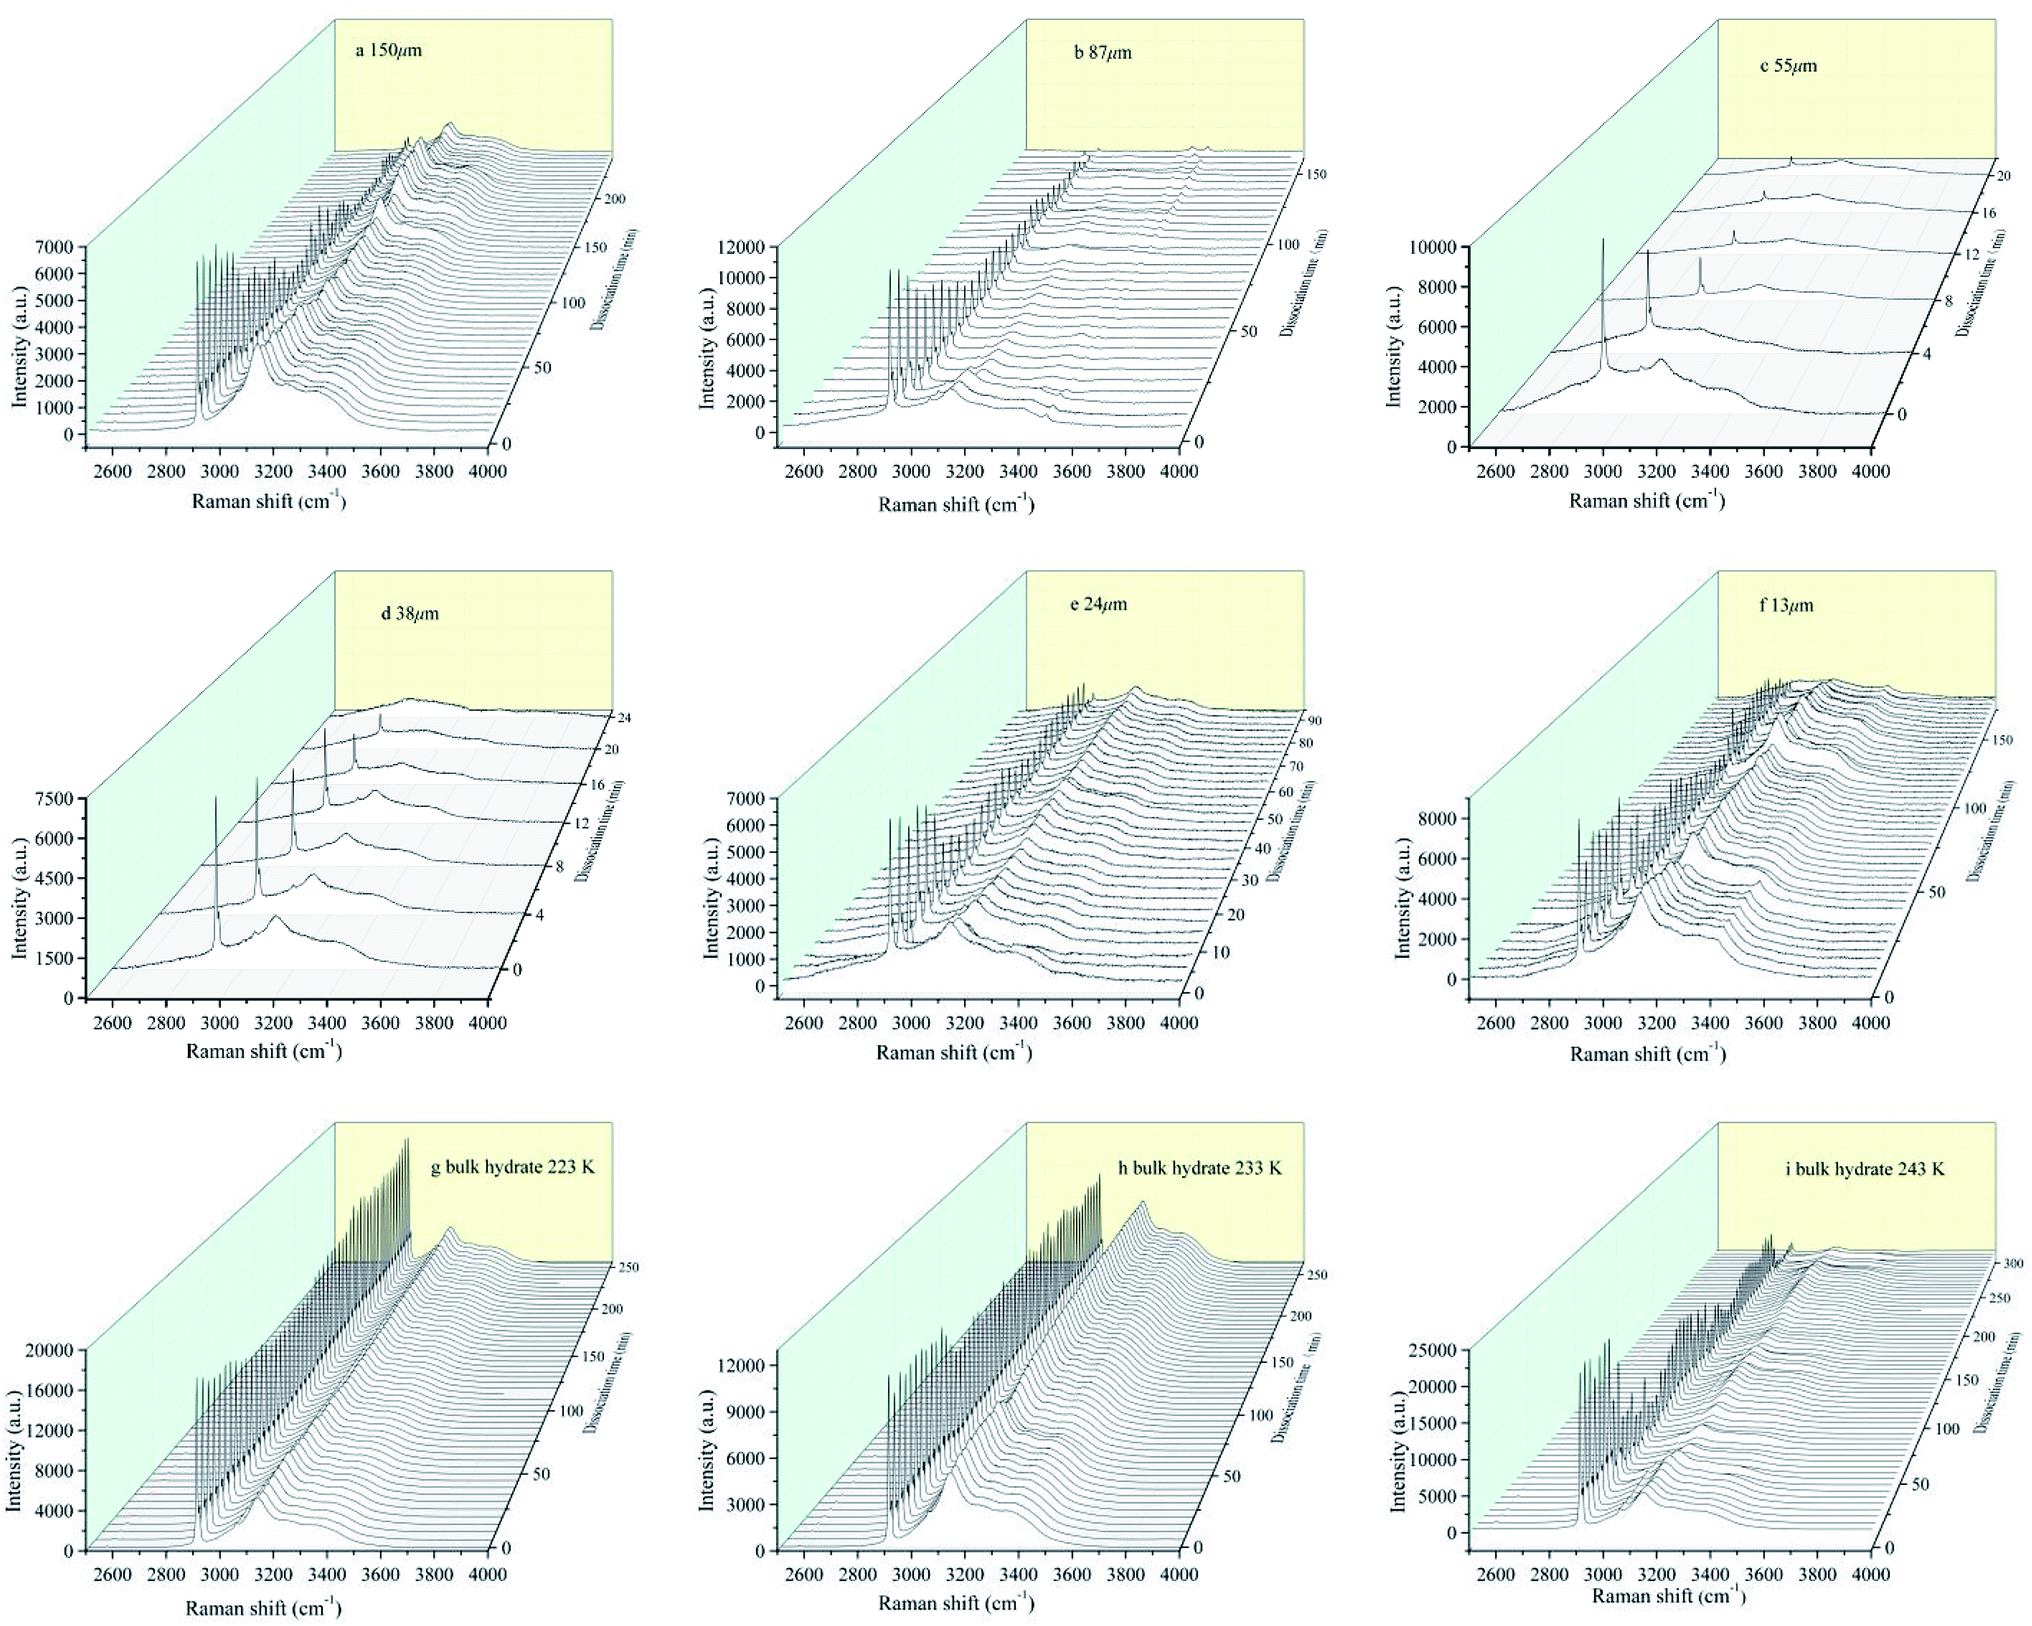 | ||
| Fig. 4 In situ Raman spectroscopic observations on the dissociations of hydrate formed from different grain sizes of natural sands and bulk hydrate at different temperature. | ||
Compared with the bulk hydrate decomposition process, it was found that the behavior of the hydrate formed in sediment was significantly different. As shown in Fig. 5, the intensity integral of the CH4 Raman peak of the large cage at the initial moment was used as the initial value to perform dimensionless calculation on the subsequent CH4 peak intensity integral (R0L/RiL). The phase equilibrium temperature of hydrate at normal pressure was 213 K calculated by CSMGem hydrate phase equilibrium software. Therefore, there was enough driving force to have the hydrate decompose in situ under this experimental condition. However, we found that Raman integral intensities did not show a monotonous decrease with time until there was no significant characteristic peak intensity in Fig. 6. Interestingly, the intensity integral gradually decreased from the initial time to 75 min at 223 K. Then the peak intensity rose slowly and the final R0L/RiL was 1.1, slightly higher than the initial moment. According to Zhou et al.26 and Myshakin et al.,47 the self-preservation effect caused the formation of an ice film on the surface of the hydrate after the partial decomposition of methane hydrate, inhibiting the further decomposition of the hydrate. At the same time, water molecules and surrounding CH4 molecules would form hydrate clusters again. Zhong et al. also revealed the apparent self-preservation of the sI methane hydrate phenomenon at low temperatures.48 Thus, it can be assumed that the bulk hydrate undergoes reverse growth during the decomposition process. When the bulk hydrate decomposes, it absorbs heat and the ambient temperature decreases. However, the heat transfer effect on hydrate gradually increases with the increase of temperature and the final R0L/RiL was 0.76 after 265 min even if the hydrate regenerated due to the self-preservation effect at 233 K. Different from bulk hydrates remaining stable at 223 K and finally 233 K, the hydrate dramatically changed at 243 K and R0L/RiL was 0.09 after 300 min, which can be considered completely decomposed hydrate. It is clear that when the hydrate began to decompose, R0L/RiL would increase to 1.6, suggesting that the escaped CH4 would rapidly combine with the surrounding free water molecules to cause reverse growth. However, the hydrate in sediment would not keep undecomposed at 223 K; it was also verified from a microscopic perspective that the hydrate phase equilibrium conditions in fine-porous porous media were more stringent, which is consistent with macroscopic experiments by Sun et al.23 The hydrated Raman decomposition data of the natural sands with median particle size of 150 μm, 87 μm, 24 μm, and 13 μm were processed similarly to bulk hydrates (Fig. S1†). Because the hydrate decomposed faster in natural sands with median particle size of 55 μm, 38 μm, no similar treatment was carried out in these cases. No obvious self-preservation effect occurred in natural sands with median particle size of 150 μm and 87 μm, compared sands with median particle size of 55 μm and 38 μm. In the sands with median particle size of 24 μm and 13 μm, this behaved like a bulk hydrate at 243 K but self-preservation effect was obviously weak, which denoted that in the small particle porous medium, the hydrate was more likely to block the heat transfer after being converted into an ice film when the CH4 escaped, effectively preventing the free CH4 molecules from diffusing into the gas phase and the self-preservation effect occurred.
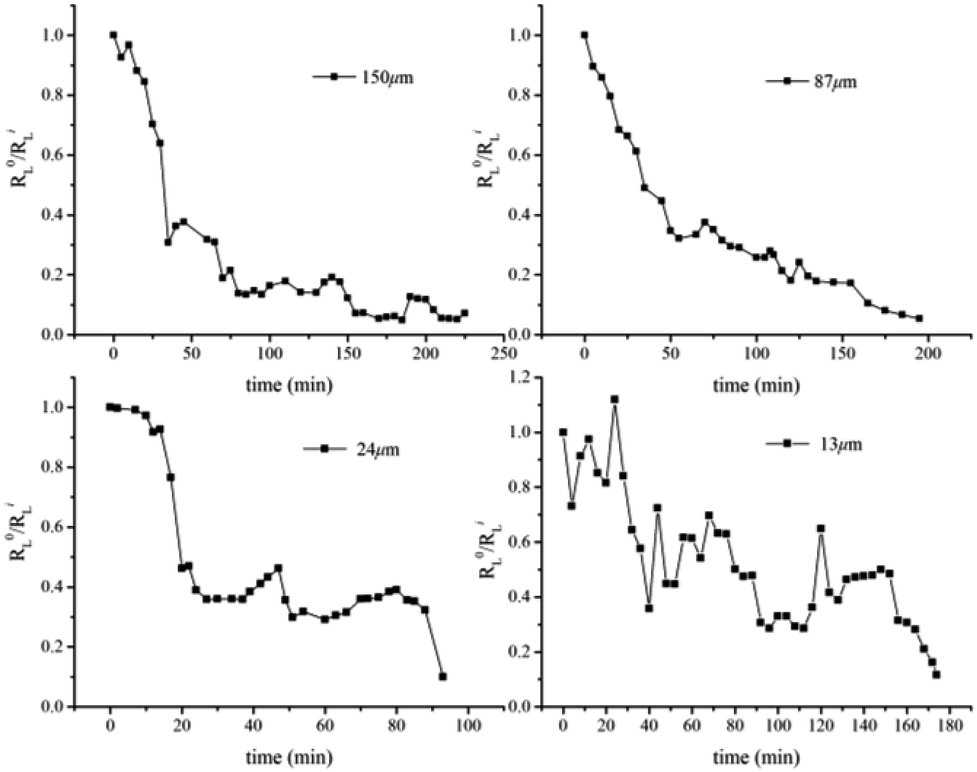 | ||
| Fig. 5 Time-resolved integrated Raman intensity for the C–H stretching mode of CH4 in large cages (2902 cm−1) in hydrate-bearing natural sands with median particle size of 150 μm, 87 μm, 24 μm, and 13 μm. | ||
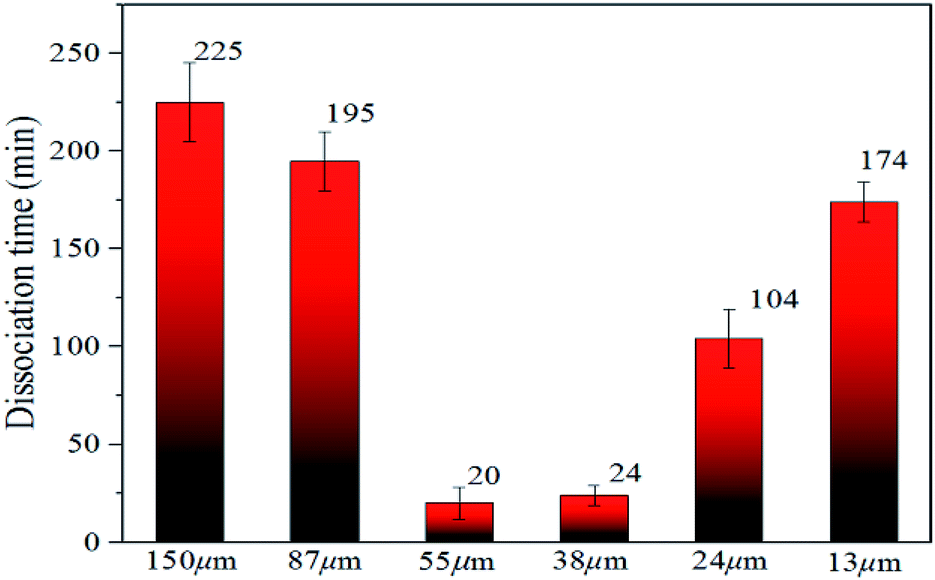 | ||
| Fig. 6 Time required for decomposition of methane hydrate in natural sands of different particle sizes. | ||
In Fig. 6, the time required for complete decomposition in the six granular natural sands did not exceed 250 min at 223 K, while the bulk hydrate required at least 300 min at 243 K. These findings are consistent with the results from Bagherzadeh et al. who found that the dissociation rate in the silica surface was faster than unrestricted water–methane hydrate simulation by constant energy, constant volume (NVE) molecular dynamics simulations.49 Ideally, sI hydrate was body-centered cubic structure and had space group Pm3n the lattice parameter a = 11.8875 ± 0.0075 Å, But Liang et al. found there was a middle half-cage structure during the nucleation of the surface of the silica to form a hydrate by molecular simulation,50 which might cause surface defects that affect the stability of hydrate. Table 2 showed the experimental thermal properties of hydrate-bearing sediments used in this work. The thermal conductivity λ and the thermal diffusivity κ of silica sand were far greater than the other sediments, meaning that supplement the external heat in time provided a greater heat transfer decomposition driving force compared with bulk hydrate.
| Material | λ (W m−1 K−1) | κ (W m−1 K−1) | cp (J kg−1 K−1) | ρ (kg m−3) |
|---|---|---|---|---|
| a λ, κ, cp, and ρ are the thermal conductivity, thermal diffusivity, specific heat, and density, respectively. (Values from ref. 51). | ||||
| Water | 0.56 | 1.33 × 10⁻⁷ | 4218 | 999.9 |
| Ice Ih | 2.21 | 11.7 × 10⁻⁷ | 2052 | 917 |
| Methane hydrate | 0.57 | 3.35 × 10⁻⁷ | 2031 | 929 |
| Silica sand | 7.7–8.4 | 41 × 10−7 | 730 | 2650 |
Significantly, it was found that the time required for complete decomposition of the hydrate did not always decrease as the particle size of the deposit decreased. The hydrate in sediments with a median particle size of 55–150 μm decomposed faster with particle reduction, which is in agreement with the findings of Liu et al.34 and this was closely related to the thermal conductivity and thermal diffusion of porous media. Ahn et al. found that the greater the thermal conductivity tended to be, the lower were the porosity and the larger the proportion of fine particles in silica sand.52 Askari et al. argued that the thermal conductivity of the medium was strongly influenced by the porosity, which was a decreasing function of the roughness deformation.53 Wang et al. noted that the effective thermal conductivity increased slightly with the decomposition of the hydrate and the heat transfer capacity increased.54 These reports indicate that external heat could be better transmitted through the silica sand medium to have the heat absorbed by the hydrate decomposition in this experiment.
However, the decomposition time required for hydrate increased with the decrease in sediment particle size (the median particle size was 13–38 μm). Excluding artificial interference factors such as the slight adjustment of the laser focus, the peak intensity integral of the hydrate in the natural sand porous medium with a median particle size of 55 μm and 38 μm was reduced by 95% and 91%, respectively, within 30 min in Fig. 6, which can be considered the end of the decomposition because of the lack of obvious characteristic peak at 2902 cm−1 Raman shift. This illustrated that the decomposition of hydrate in sediments was not only related to the effective thermal conductivity of silica sand. Permeability is also an important factor, which affects the decomposition of hydrates. Combining related research from Yin et al.55 and Wu et al.,56 the median particle size contains more clay in the 13–24 micron sediment in this experiment, the formation of the bound water and swelling of clay might blocks the airflow path. As shown in Fig. 7A–F showed the surface topology of natural sands at 2.0 kv × 250 multiples by SEM. Using the cryo-SEM technology can help us to understand more intuitively the decomposition process of hydrates in sediments. Comparing with porous media such as glass beads and silica gel, the surface of the selected sand is rough and irregular, which resembled the sediment characteristics in sea bed. Due to the high vacuum of the electron microscope sample chamber and the electron beam irradiation, the energy transferring to accelerate decomposition. As shown in Fig. 7(b4), the gas flow in the porous channel observed at a high magnification of 20k during the decomposition process particle size of 24 μm in Fig. 7(c). The smooth surface gradually deteriorated from the initial stage to the complete decomposition of sand and ice, which shows that its hydrate and ice were inlaid and wrapped on the surface of the sand. Fig. 7(c4) illustrates the characteristics of sand and ice particles after the final decomposition was complete. The size of the ice particles differed and the distribution was not uniform, as was the case with the natural gas hydrate sample NGHP-01 HYD82 in the Indian Peninsula and the Andaman concentration edge studied by Stern et al.32 This suggested that, due to the small particle size and specific surface area, the gas–water growth cluster nucleus was more likely to form while the hydrate and ice might wrap the sand. The hydrate absorbed heat when it decomposed, but the heat was not directly transmitted from the gravel, which implies the hydrate took a longer time to break down. Therefore, the decomposition of hydrates from sediments with a median particle size <55 μm might depend more on the distribution characteristics of the hydrates after formation. Verification requires molecular dynamics simulations in future work. However, this new discovery can help address the problem of mud drilling fluid in actual hydrate mining.
 | ||
| Fig. 7 SEM images of the six different granular natural sands as porous media in this study: (A) 150 μm, (B) 87 μm, (C) 55 μm, (D) 38 μm, (E) 24 μm, and (F) 13 μm & cryo-SEM images of decomposition of hydrates in hydrate-bearing sediments with a median particle size of (a) 55 μm, (b) 38 μm, and (c) 24 μm. | ||
We also calculated the ratio of the peak intensity integral of CH4 in the I hydrate size cage over time (Fig. S2†). The ratio of the integrated intensity of the large to the small cages for CH4 in bulk hydrate (AL/AS) was more stable at 223 K, with a trend of <3 with the increase of temperature, although the fluctuation was not large. This could be substantially considered that large cage did not preferentially decompose in the unit cell of sI methane hydrate, which is consistent with the findings by Gupta et al. on methane hydrate dissociation at the microscopic scale using NMR spectroscopy.57 However, it is worth noting that AL/AS was basically <3 in porous media and the amplitude of the fluctuation was 2.14 to 3.08, which is larger than that of the bulk hydrate. The ratio of AL/AS did not drop dramatically in fine sands during decomposition at 223 K, indicating that the guest methane molecules in the large and small cages simultaneously escaped. However, there are few reports on the mechanism of action of silica in the occupancy of valence molecules in the decomposition of hydrate unit cells in terms of molecular dynamics simulations.
We further selected sand with a median particle size of 87 μm and 24 μm, and a 3.5 wt% NaCl solution as seawater to investigate the decomposition of hydrates in salty porous media at 223 K and atmospheric pressure (Fig. S3†). Compared with the time required for the hydrate decomposition in the NaCl-free median particle sizes of 87 μm and 24 μm about 190 min and 95 min, respectively, it just took 70 min and 40 min, respectively, in the porous medium containing 3.5 wt% NaCl. Mekala et al. also found in the macro-reactor that the hydrate decomposition time in seawater was shorter.20 Salt ions acted as hydrate inhibitors to reduce the heat transfer resistance between sand and ice. Through molecular dynamics simulations, Yi et al. found that when the Na+ and Cl− ions moved at the CH4 hydrate interface, because of the strong electrostatic Coulomb force between the ions and the water molecules, the arrangement of some water molecules in the cage at the interface would be changed and formed a hole.58 Therefore, the effect of adding salt to the drilling fluid on the hydrate mining process from a microscopic point of view was also analyzed. Due to the presence of Na+ and Cl− in the porous medium, the phase equilibrium conditions for the stable presence of the hydrate were higher. Correspondingly, we observed that R0L/RiL was gradually reduced in the natural sand with median particle sizes of 87 μm and 24 μm. Until completely decomposed, there was no apparent self-preservation effect throughout the process. The integrated intensity ratio of large to small cages for methane hydrate revealed the same variation in characteristics in the absence of Na+ and Cl− deposits. In other words, AL/AS basically fluctuated by <3 and there was no significant drop, indicating that Na+ and Cl− did not enter the hydrate unit cell to affect its structure, but accelerated the overall decomposition of the unit cell.
4. Conclusion
In this work, PXRD was used to determine the structure of hydrates formed in six natural sands with median particle sizes of 150, 87, 55, 38, 24, and 13 μm. The hydrate decomposition was examined at 223 K and atmospheric pressure by Raman spectroscopy. We found that the hydrate decomposed in the six sands because of the water activity reduction caused by the hydrophilicity and negatively charged properties of the silica particles and capillary pressure,23 while the bulk hydrate remained stable and began to decompose slowly until that the temperature reached 243 K, taking about 300 minutes. The decomposition time of hydrate in sand did not decrease with the decrease of particle size. The most unstable region of hydrate was in the median particle sizes of 38–55 μm, as analyzed by cryo-SEM. However, molecular dynamics simulations are needed for further analysis in the future. The self-preservation effect for hydrate in sands was significantly weakened during the decomposition process. In the two natural sands with a median particle size of 87 μm and 24 μm, with the addition of 3.5 wt% NaCl, the hydrates showed no obvious self-preservation effect. The hydrate in sands containing salt decomposed faster. Regardless of whether there was salt in the sediment, the integrated intensity ratio of large to small cages for methane hydrate fluctuated until the hydrate decomposed completely, which can be seen as the simultaneous decomposition of the large cage and the small cage of the hydrate.Conflicts of interest
There are no conflicts to declare.Acknowledgements
This work was supported by the National Natural Science Foundation of China (41603062), and the National Key Research and Development Plan of China (2016YFC0304002).References
- A. Demirbas, M. Rehan, B. O. Al-Sasi and A. S. Nizami, Pet. Sci. Technol., 2016, 34(13), 1204–1210 CrossRef CAS.
- J. Liu, J. X. Ding and D. Q. Liang, Energy, 2018, 157, 54–64 CrossRef CAS.
- E. D. Sloan Jr and C. A. Koh, Clathrate Hydrates of Natural Gases, CRC Press, 2007 Search PubMed.
- R. B. Hunter, T. S. Collett, R. Boswell, B. J. Anderson, S. A. Digert, G. Pospisil, R. Baker and M. Weeks, Mar. Pet. Geol., 2011, 28(2), 295–310 CrossRef.
- D. Schoderbek, H. Farrell, J. Howard, K. Raterman, S. Silpngarmlert, K. Martin, B. Smith and P. Klein, ConocoPhillips Gas Hydrate Production Test, 2013 Search PubMed.
- L. Wang, S. Fu, J. Liang, J. Shang and J. Wang, J. Genet. Genomics, 2017, 44(3), 439–448 Search PubMed.
- W. Wei, J. Zhang, R. Yu, B. Lin, L. Chen, Y. Peng and H. Xiao, Sci. Technol. Guide, 2018, 36(1), 83–90 Search PubMed.
- L. Chen, Y. C. Feng, J. Okajima, A. Komiya and S. Maruyama, J. Nat. Gas Sci. Eng., 2018, 53, 55–66 CrossRef.
- G. Li, D. M. Wu, X. S. Li, Q. N. Lv, C. Li and Y. Zhang, Appl. Energy, 2017, 202, 282–292 CrossRef CAS.
- T. Uchida, S. Takeya, E. M. Chuvilin, R. Ohmura, J. Nagao, V. S. Yakushev, V. A. Istomin, H. Minagawa, T. Ebinuma and H. Narita, J. Geophys. Res.: Solid Earth, 2004, 109(B5), B05206 Search PubMed.
- A. Siangsai, P. Rangsunvigit, B. Kitiyanan, S. Kulprathipanja and P. Linga, Chem. Eng. Sci., 2015, 126, 383–389 CrossRef CAS.
- M. Chen, Y. Ye and W. Lu, Methane hydrate formation and dissociation in porous media formed in a synthetic capillary tube, Geosciences, 2010, 24(3), 632–637 CAS.
- Z. R. Chong, A. H. M. Chan, P. Babu, M. Yang and P. Linga, J. Nat. Gas Sci. Eng., 2015, 27, 178–189 CrossRef CAS.
- K. K. Ostergaard, R. Anderson, M. Llamedo and B. Tohidi, Terra. Nova, 2002, 14(5), 307–312 CrossRef CAS.
- B. Han, G. Y. Lu, H. Cao and L. Zhang, Environ. Earth Sci., 2017, 76(14), 13 Search PubMed.
- D. Y. Wang, X. J. Ma and J. Qiao, Adv. Mater. Res., 2014, 868, 564–567 Search PubMed.
- Z. R. Chong, M. Yang, B. C. Khoo and P. Linga, Ind. Eng. Chem. Res., 2016, 55(29), 7981–7991 CrossRef CAS.
- Y. Zhang, X.-S. Li, Y. Wang, Z.-Y. Chen and K.-F. Yan, Fluid Phase Equilib., 2016, 413, 110–115 CrossRef CAS.
- V. K. Saw, G. Udayabhanu, A. Mandal and S. Laik, Oil Gas Sci. Technol., 2015, 70(6), 1087–1099 CrossRef CAS.
- P. Mekala, P. Babu, J. S. Sangwai and P. Linga, Energy Fuels, 2014, 28(4), 2708–2716 CrossRef CAS.
- T. Uchida, T. Ebinuma, S. Takeya, J. Nagao and H. Narita, J. Phys. Chem. B, 2002, 106(4), 820–826 CrossRef CAS.
- C. L. Liu, Y. G. Ye, S. C. Sun, Q. Chen, Q. G. Meng and G. W. Hu, Sci. China: Earth Sci., 2013, 56(4), 594–600 CrossRef CAS.
- S. C. Sun, C. L. Liu, Y. G. Ye and Y. F. Liu, J. Chem. Thermodyn., 2014, 69, 118–124 CrossRef CAS.
- S. Sun, Y. Ye, C. Liu, Y. Tan, F. Xiang and Y. Ma, Acta Chim. Sin., 2011, 69(9), 1135–1140 CAS.
- M. Yousuf, S. B. Qadri, D. L. Knies, K. S. Grabowski, R. B. Coffin and J. W. Pohlman, Appl. Phys. A, 2004, 78(6), 925–939 CrossRef CAS.
- X. Zhou, Z. Long, S. Liang, Y. He, L. Yi, D. Li and D. Liang, Energy Fuels, 2016, 30(2), 1279–1286 CAS.
- N. Xia, C. Liu, Y. Ye, Q. Meng, X. Lin and X. He, Rock. Miner. Anal., 2011, 30(4), 416–422 CAS.
- C. Liu, Q. Meng and Y. Ye, Chin. J. Magn. Reson., 2012, 29(3), 465–474 CAS.
- T. J. Kneafsey and G. J. Moridis, Mar. Pet. Geol., 2014, 58, 526–539 CrossRef.
- T. J. Kneafsey, L. Tomutsa, G. J. Moridis, Y. Seol, B. M. Freifeld, C. E. Taylor and A. Gupta, J. Pet. Sci. Eng., 2007, 56(1–3), 108–126 CrossRef CAS.
- J. F. Zhao, L. Yao, Y. C. Song, K. H. Xue, C. X. Cheng, Y. Liu and Y. Zhang, Magn. Reson. Imag., 2011, 29(2), 281–288 CrossRef CAS PubMed.
- L. A. Stern and T. D. Lorenson, Mar. Pet. Geol., 2014, 58, 206–222 CrossRef CAS.
- A. Gupta, S. F. Dec, C. A. Koh and E. D. Sloan, J. Phys. Chem. C, 2007, 111(5), 2341–2346 CrossRef CAS.
- C. Liu, H. Lu, Y. Ye, J. A. Ripmeester and X. Zhang, Energy Fuels, 2008, 22(6), 3986–3988 CrossRef CAS.
- L. A. Stern and S. H. Kirby, in Proceedings of the 6th International Conference on Gas Hydrates (ICGH 2008), Vancouver, Canada, July 2008, Paper 5330 Search PubMed.
- L. A. Stern, T. D. Lorenson and J. C. Pinkston, Mar. Pet. Geol., 2011, 28(2), 394–403 CrossRef CAS.
- C. Liu, Q. Meng, C. Li, J. Sun, X. He, S. Yang and J. Liang, Front. Earth Sci., 2017, 24(4), 041–050 Search PubMed.
- L. Zhan, Y. Wang and X. S. Li, Fuel, 2018, 230, 37–44 CrossRef CAS.
- J. M. Schicks and J. A. Ripmeester, Angew. Chem., Int. Ed., 2004, 43(25), 3310–3313 CrossRef CAS PubMed.
- S. Subramanian and E. D. Sloan, J. Phys. Chem. B, 2002, 106(17), 4348–4355 CrossRef CAS.
- H. Lu, I. Moudrakovski, M. Riedel, G. Spence, R. Dutrisac, J. Ripmeester, F. Wright and S. Dallimore, J. Geophys. Res.: Solid Earth, 2005, 110(B10), B10204 CrossRef.
- D. W. Davidson, Y. P. Handa and J. A. Ripmeester, J. Phys. Chem., 1986, 90(24), 6549–6552 CrossRef CAS.
- T. Uchida, T. Hirano, T. Ebinuma, H. Narita, K. Gohara and S. Mae, AIChE J., 1999, 45(12), 2641–2645 CrossRef CAS.
- D. W. Davidson, Y. P. Handa, C. I. Ratcliffe, J. A. Ripmeester, J. S. Tse, J. R. Dahn, F. Lee and L. D. Calvert, Mol. Cryst., 1986, 141(1–2), 141–149 CrossRef CAS.
- X. B. Zhou, F. H. Lin and D. Q. Liang, J. Phys. Chem. C, 2016, 120(45), 25668–25677 CrossRef CAS.
- J. M. Schicks, M. A. Ziemann, H. Lu and J. A. Ripmeester, Spectrochim. Acta, Part A, 2010, 77(5), 973–977 CrossRef CAS PubMed.
- E. M. Myshakin, W. A. Saidi, V. N. Romanov, R. T. Cygan and K. D. Jordan, J. Phys. Chem. C, 2013, 117(21), 11028–11039 CrossRef CAS.
- J.-R. Zhong, X.-Y. Zeng, F.-H. Zhou, Q.-D. Ran, C.-Y. Sun, R.-Q. Zhong, L.-Y. Yang, G.-J. Chen and C. A. Koh, Sci. Rep., 2016, 6, 38855 CrossRef CAS PubMed.
- S. A. Bagherzadeh, P. Englezos, S. Alavi and J. A. Ripmeester, J. Phys. Chem. B, 2012, 116(10), 3188–3197 CrossRef CAS PubMed.
- S. Liang and P. G. Kusalik, Can. J. Chem., 2015, 93(8), 791–798 CrossRef CAS.
- W. F. Waite, J. C. Santamarina, D. D. Cortes, B. Dugan, D. N. Espinoza, J. Germaine, J. Jang, J. W. Jung, T. J. Kneafsey and H. Shin, Rev. Geophys., 2009, 47(4), 465–484 CrossRef.
- J. Ahn and J. Jung, Appl. Sci., 2017, 7(7), 650 CrossRef.
- R. Askari, S. H. Hejazi and M. Sahimi, Transport Porous Media, 2018, 124(1), 221–236 CrossRef CAS.
- B. Wang, Z. Fan, P. F. Lv, J. F. Zhao and Y. C. Song, Int. J. Heat Mass Transfer, 2017, 110, 142–150 CrossRef CAS.
- Z. Y. Yin, G. Moridis, Z. R. Chong, H. K. Tan and P. Linga, Ind. Eng. Chem. Res., 2018, 57(17), 5776–5791 CrossRef CAS.
- Z. R. Wu, Y. H. Li, X. Sun, P. Wu and J. A. Zheng, Appl. Energy, 2018, 230, 1304–1310 CrossRef CAS.
- A. Gupta, S. F. Dec, C. A. Koh and E. D. Sloan, J. Phys. Chem. C, 2007, 111(5), 2341–2346 CrossRef CAS.
- L. Yi, D. Liang, X. Zhou, D. Li and J. Wang, Mol. Phys., 2014, 112(24), 3127–3137 CrossRef CAS.
Footnote |
| † Electronic supplementary information (ESI) available. See DOI: 10.1039/c9ra01611b |
| This journal is © The Royal Society of Chemistry 2019 |