 Open Access Article
Bio-based, biodegradable and amorphous polyurethanes with shape memory behavior at body temperature
Hui-Min Douab,
Ji-Heng Ding *b,
Hao Chenb,
Zhen Wangb,
A.-Fang Zhang
 a and
Hai-Bin Yu*b
aCollege of Materials Science and Engineering, Shanghai University, Shanghai 200072, China
bNingbo Institute of Materials Technology and Engineering, Chinese Academy of Sciences, Ningbo 315201, China. E-mail: dingjh@nimte.ac.cn; haibinyu@nimte.ac.cn
First published on 29th April 2019
Abstract
In this work, a series of bio-based, biodegradable and amorphous shape memory polyurethanes were synthesized by a two-step pre-polymerization process from polylactide (PLA) diol, polycaprolactone (PCL) diol and diphenylmethane diisocyanate-50 (MDI-50). The ratio of PLA diol to PCL diol was adjusted to investigate their thermal and mechanical properties. These bio-based shape memory polyurethanes (bio-PUs) showed a glass transition temperature (Tg) value in the range of −10.7–32.5 °C, which can be adjusted to be close to body temperature. The tensile strength and elongation of the bio-PUs could be tuned in the range from 1.7 MPa to 12.9 MPa and from 767.5% to 1345.7%, respectively. Through a series of shape memory tests, these bio-PUs exhibited good shape memory behavior at body temperature. Among them, PU with 2![[thin space (1/6-em)]](https://www.rsc.org/images/entities/char_2009.gif) :
:![[thin space (1/6-em)]](https://www.rsc.org/images/entities/char_2009.gif) 1 as the PLA/PCL ratio showed the best shape recovery behavior with a shape recovery rate higher than 98% and could fully reach the original shape state in 15 s at 37 °C. Therefore, these shape memory bio-PUs are promising for applications in smart biomedical devices.
1 as the PLA/PCL ratio showed the best shape recovery behavior with a shape recovery rate higher than 98% and could fully reach the original shape state in 15 s at 37 °C. Therefore, these shape memory bio-PUs are promising for applications in smart biomedical devices.
1. Introduction
Shape memory materials have attracted much attention due to their superior properties and wide potential applications in sensors,1,2 actuators,3,4 medical devices,5,6 shrinkable packages,7,8 etc. Shape memory materials refer to materials that are able to adjust their mechanical parameters (such as deformation, position and strain) to return to the original state by responding to environmental changes (such as temperature, force, electricity, magnetism, solvent and humidity).9–12 Over the past decades, shape memory materials have been newly explored including alloys, ceramics and polymers.13 Compared with shape memory alloys and ceramics, shape memory polymers (SMPs) exhibit better chemical structure versatility, easier processing, lower manufacturing costs and greater recoverable deformation.14,15 Among these polymers, shape memory polyurethanes (SMPUs) received more attention because of their easily controlled structure, wide transition temperature range, biodegradability and biocompatibility.16–18Generally, thermo-responsive SMPUs are the most extensively studied.19 The switching temperature (Ttrans) can be Tg (in amorphous segments), melting temperature (Tm, in semicrystalline segments) or liquid crystalline clearing temperature (Tcl, in liquid crystalline segments).20 Synthesized SMPUs exhibit different Tgs, Tms or Tcls, thus they can show shape memory behavior in various temperature ranges, meeting variable requirements of practical applications.21 For medical implant materials, thermo-responsive SMPUs have been expected to exhibit good biodegradability, biocompatibility and relatively excellent recoverable properties.22–24 P. Singhal et al. synthesized novel SMP foams for embolic biomedical applications aimed at further expanding the utility of these biomaterials by introducing controlled biodegradability.25 However, in such semicrystalline SMPUs, biodegradability is heterogeneous and preferentially occurs in the amorphous phase.26 In comparison, completely amorphous SMPUs are expected for a more homogeneous degradation behavior.27 P. Singhal et al. also synthesized highly chemically crosslinked, ultra low density (∼0.015 g cm−3) polyurethane shape memory foams.28 The corresponding handling of these amorphous SMPUs will be much difficult in medical applications because their Ttrans are higher than the body temperature.29 While the Ttrans is equal or lower than the body temperature, the body temperature will promote the shape recovery. In addition, if the Ttrans is much lower than the body temperature, it is inconvenient that the device should be stored at a temperature lower than room temperature. Therefore, it is desirable to prepare biodegradability, amorphous polyurethane materials with Ttrans near the body temperature.
Polylactide (PLA) and polycaprolactone (PCL) are the most extensively reached, bio-based and degradable polyesters.30 Furthermore, they have FDA approval in various devices for medical applications.31,32 The biodegradable SMPUs reported recently mostly are based on PCL, co-oligoesters of (rac-) lactide and glycolide, or others.33,34 They all exhibit good shape memory properties, but their weak points are obvious at the same time. Either they have poor processing properties because of their chemical crosslinking structure. Bin Cui et al. synthesized a series of bio-PUs from PLA-based diols, different diisocyanates (TDI, MDI, HDI, IPDI) and chain extender 1,4-butanediol.35 Among them, linear MDI-based PUs demonstrates better mechanical properties. And it is relatively easy to prepare amorphous polyurethanes from MDI-50 because of its composition with half 2,4-MDI and half 4,4-MDI.
In this work, a series of shape memory polyurethanes were synthesized using polylactide (PLA) diol as the soft segment, diphenylmethane diisocyanate-50 (MDI-50) as the hard segment, and polycaprolactone (PCL) diol as chain extender. They all displayed good shape memory behaviors. Therefore, they are expected to have wide applications in implantable medical devices.
2. Materials and methods
2.1 Materials
Diphenylmethane diisocyanate-50 (MDI-50) was purchased from Wanhua Chemical Group Co., Ltd. Polylactide (PLA) diol (Mn = 1000) and polycaprolactone (PCL) diol (Mn = 1000) were provided from Shenzhen Guanghua Weiye Co., Ltd. Stannous octoate (Sn(oct)2) was purchased from Aladdin Industrial Corporation (Shanghai, China). Toluene and tetrahydrofuran (THF) are analytically pure and were obtained from Sinopharm Chemical Reagent Co., Ltd (Shanghai, China).2.2 Synthesis of bio-based polyurethanes
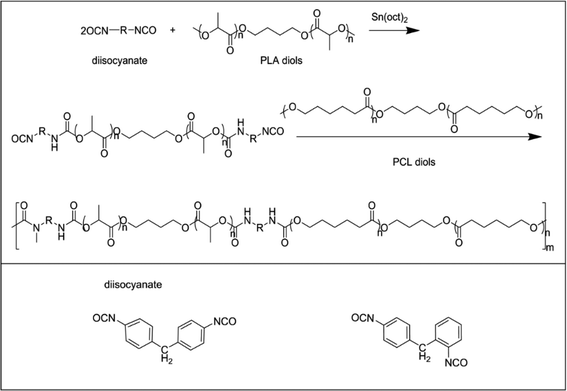
The bio-based polyurethanes were synthesized by a two-step polymerization process, as shown in Scheme 1. PLA diol was dissolved in toluene and heated to 65 °C. Sn(oct)2 and an appropriate amount of MDI-50 (molar ratio of total OH in diols to N![[double bond, length as m-dash]](https://www.rsc.org/images/entities/char_e001.gif) C
C![[double bond, length as m-dash]](https://www.rsc.org/images/entities/char_e001.gif) O was 1
O was 1![[thin space (1/6-em)]](https://www.rsc.org/images/entities/char_2009.gif) :
:![[thin space (1/6-em)]](https://www.rsc.org/images/entities/char_2009.gif) 1) were added to the solution and stirred for 2 h at 75 °C. Then polycaprolactone diol was poured into the mixture and stirred at 80 °C for 6 h. The synthesis process was carried out in a nitrogen atmosphere. The obtained bio-PU solution was poured into Teflon molds and evaporated at 60 °C for 48 h. The synthesized bio-PUs were nominated as PU-xx, in which xx indicates the ratio of PLA diol to PCL diol. The detailed information of the bio-PUs is summarized in Table 1.
1) were added to the solution and stirred for 2 h at 75 °C. Then polycaprolactone diol was poured into the mixture and stirred at 80 °C for 6 h. The synthesis process was carried out in a nitrogen atmosphere. The obtained bio-PU solution was poured into Teflon molds and evaporated at 60 °C for 48 h. The synthesized bio-PUs were nominated as PU-xx, in which xx indicates the ratio of PLA diol to PCL diol. The detailed information of the bio-PUs is summarized in Table 1.
| Sample | Mw (104) | Mn (104) | Mw/Mn |
|---|---|---|---|
| PU-12 | 7.5 | 3.8 | 2.0 |
| PU-11 | 6.5 | 3.3 | 1.9 |
| PU-21 | 3.9 | 2.2 | 1.8 |
| PU-31 | 4.6 | 2.6 | 1.8 |
| PU-41 | 5.0 | 2.8 | 1.8 |
| PU-51 | 4.4 | 2.5 | 1.7 |
2.3 Materials characterization
The number-average molecular weight (Mn) and weight-average molecular weight (Mw) of each polymer were determined by gel permeation chromatography (GPC; HLC-8320) using polyisobutylene (PIB) as the standard and THF as the eluent. Fourier Transform Infrared (FTIR) spectra were obtained on an Agilent Cary660 + 620 spectrometer using the attenuated total reflection (ATR) mode.Differential scanning calorimetry (DSC) analysis was performed on a Polyma 214 (Netisch) instrument under N2 atmosphere. The samples were initially heated from 20 °C to 180 °C and kept at 180 °C for 2 min. Then the specimens were cooled down to −40 °C. After being kept at −40 °C for 2 min, the specimens were reheated to 180 °C. The rate of heating and cooling was 10 °C min−1. The glass transition temperature (Tg) was determined from the second heating cure to eliminate the thermal history. Thermo gravimetric analysis (TGA) was performed on a PerkinElmer Pyris Diamond thermal analyzer at a heating rate of 10 °C min−1 from 30 °C to 600 °C under a N2 atmosphere.
Tensile properties were carried out on a universal testing machine (WDW-05) with a crosshead speed of 100 mm min−1 at room temperature (25 °C). Five replicated measurements were taken for each sample to obtain the mean value. The cyclic tensile tests of bio-PUs was performed on the same machine as follows according to other previous article.36 First, the dumbbell shaped sample (50 mm × 4 mm × 1 mm) was stretched to εm, 200% elongation at room temperature (25 °C) at a speed of 100 mm min−1. Then the clamps began to return at a speed of 20 mm min−1 until the force on the sample reached 0. After the two steps above, a cycle is competed. A total of five cycles was performed on each same specimen. The shape recovery rate (Rr) was calculated by the following eqn (1).
 | (1) |
The macroscopic shape memory test of bio-PUs was performed as follows: first, the samples were bent to a given angle at 37 °C, and then they were quenched below Tg using liquid nitrogen. At last, the samples were allowed for free recovery at 37 °C.
Atomic force microscopy (AFM) was conducted on a scanning tunneling microscope using the tapping mode on an Agilent 5500 Instrument. The AFM sample was prepared by casting bio-PU solution (5 wt%) on a silicon wafer. All images are shown without any image processing except in some cases where horizontal leveling and contrast enhancement were used.
3. Results and discussion
3.1 Synthesis and characterization of bio-PU
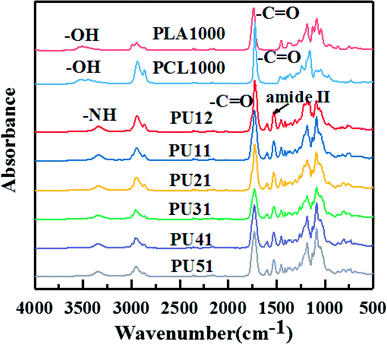
Fig. 1 shows the FTIR spectra of PLA diol, PCL diol and the obtained PUs. The PLA diol shows two characteristic peaks at 3508 cm−1 (OH stretching) and 1738 cm−1 (C![[double bond, length as m-dash]](https://www.rsc.org/images/entities/char_e001.gif) O stretching), while the PCL diol shows two characteristic peaks at 3445 cm−1 (OH stretching) and 1723 cm−1 (C
O stretching), while the PCL diol shows two characteristic peaks at 3445 cm−1 (OH stretching) and 1723 cm−1 (C![[double bond, length as m-dash]](https://www.rsc.org/images/entities/char_e001.gif) O stretching). The FTIR spectra of bio-PUs are very similar. The two characteristic peaks (OH stretching and C
O stretching). The FTIR spectra of bio-PUs are very similar. The two characteristic peaks (OH stretching and C![[double bond, length as m-dash]](https://www.rsc.org/images/entities/char_e001.gif) O stretching) are replaced by the peaks at 3345 cm−1 (NH stretching) and 1727 cm−1 (C
O stretching) are replaced by the peaks at 3345 cm−1 (NH stretching) and 1727 cm−1 (C![[double bond, length as m-dash]](https://www.rsc.org/images/entities/char_e001.gif) O stretching). They exhibit amide II absorption bands at 1530 cm−1 characteristic of urethane groups, while the stretching vibration band of N
O stretching). They exhibit amide II absorption bands at 1530 cm−1 characteristic of urethane groups, while the stretching vibration band of N![[double bond, length as m-dash]](https://www.rsc.org/images/entities/char_e001.gif) C
C![[double bond, length as m-dash]](https://www.rsc.org/images/entities/char_e001.gif) O at 2160 cm−1 disappears. This result indicates that the end hydroxyl groups of the PLA diol and PCL diol are converted into the urethane groups after the reaction with the diisocyanates. The above results demonstrate that bio-PUs were successfully prepared. The thermal, mechanical and shape memory properties of the synthesized bio-PUs are discussed below.
O at 2160 cm−1 disappears. This result indicates that the end hydroxyl groups of the PLA diol and PCL diol are converted into the urethane groups after the reaction with the diisocyanates. The above results demonstrate that bio-PUs were successfully prepared. The thermal, mechanical and shape memory properties of the synthesized bio-PUs are discussed below.
3.2 Thermal property of bio-SMPUs
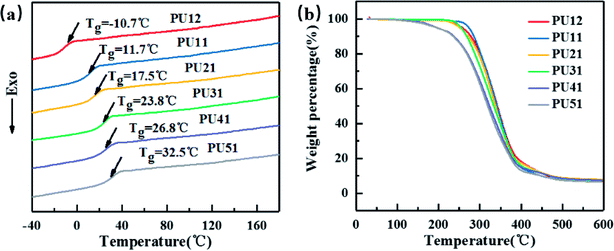
Fig. 2a displays the second heating curves of the bio-PUs. The detailed data are listed in Table 2. They exhibit only one Tg and no melting peaks at all, suggesting that the obtained bio-PUs were amorphous. On one hand, this is attributed to the low molecular weight of PLA diol. When it becomes a soft segment of bio-PUs, it can no longer crystallize due to the limitation from the hard segment. On the other hand, the diisocyanates (MDI-50) is a mixture of 2,4- and 4,4-MDI. 2,4-MDI is not a symmetric structure. Its urethane hard segments possessing less symmetry is less likely crystalize. The amorphous nature of bio-PUs is expected to be advantageous to shape memory behavior.37,38 As the ratio of PLA diol to PCL diol increased from 1![[thin space (1/6-em)]](https://www.rsc.org/images/entities/char_2009.gif) :
:![[thin space (1/6-em)]](https://www.rsc.org/images/entities/char_2009.gif) 2 to 5
2 to 5![[thin space (1/6-em)]](https://www.rsc.org/images/entities/char_2009.gif) :
:![[thin space (1/6-em)]](https://www.rsc.org/images/entities/char_2009.gif) 1, the Tg values increased from −10.7 °C to 32.5 °C. Thus, Tg can be adjusted by the ratio. For amorphous PUs, Tg serves as the shape transition temperature (Ttrans).39 Moreover, the Tg values of PU-51 is 32.5 °C, very close to the body temperature. These bio-based PUs are expected be applicable in medical devices.
1, the Tg values increased from −10.7 °C to 32.5 °C. Thus, Tg can be adjusted by the ratio. For amorphous PUs, Tg serves as the shape transition temperature (Ttrans).39 Moreover, the Tg values of PU-51 is 32.5 °C, very close to the body temperature. These bio-based PUs are expected be applicable in medical devices.
| Sample | Tg (°C) | T5% a (°C) | Tmaxb (°C) |
|---|---|---|---|
| a T5% is the 5% weight-loss temperature of the samples.b Tmax is the temperature of the maximum rate of weight-loss of the samples. | |||
| PU12 | −10.7 | 257.1 | 344.8 |
| PU11 | 11.7 | 273.1 | 340.9 |
| PU21 | 17.5 | 250.9 | 339.8 |
| PU31 | 23.8 | 254.83 | 341.26 |
| PU41 | 26.8 | 195.89 | 319.71 |
| PU51 | 32.5 | 196.45 | 314.81 |
As shown in Fig. 2b, the effect of different ratio of PLA diol to PCL diol on the thermal stability of the bio-PUs was investigated by TGA. The weight loss temperatures (T5%, Tmax) are summarized in Table 2. The weight loss of bio-PUs is very similar: the T5% and Tmax of all PUs are above 195 °C and 314 °C, respectively, showing good thermal stability.
3.3 Mechanical property of PUs
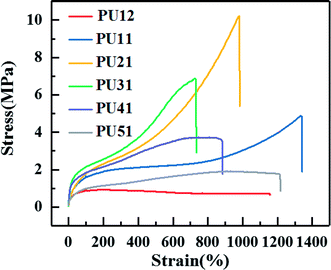
Fig. 3 shows the typical stress–strain curves of the synthesized PUs with different ratio of PLA diol to PCL diol, and specific tensile strength, elongation and Young's modulus of each PU are summarized in Table 3. A yielding is obviously observed before break. As shown in Table 3, as the ratio of PLA diol to PCL diol increases, the tensile strength increases from 1.7 MPa to 12.9 MPa and then decreases to 2.0 MPa, the elongation decreases from 1165.0% to 767.5% and then increases to 1176.0%, the Young's modulus decreases from 0.77 MPa to 0.58 MPa and then increases to 1.53 MPa, respectively. It is ascribed to that as the PLA diol content increases, the proportion of long flexible PCL segments decreases, which might induce enhancement in the chain flexibility of the PUs chains. However, the further increase of the content of PLA diol results in the increase of soft segment content, and thus leads to the increase of the elongation.| Sample | Tensile strength (MPa) | Elongation (%) | Young's modulus (MPa) |
|---|---|---|---|
| PU12 | 1.7 ± 0.3 | 1165.0 ± 30.0 | 0.77 ± 0.06 |
| PU11 | 4.8 ± 0.4 | 1345.7 ± 64.3 | 0.63 ± 0.07 |
| PU21 | 10.2 ± 0.5 | 937.0 ± 43.0 | 0.58 ± 0.06 |
| PU31 | 12.9 ± 0.7 | 767.5 ± 57.5 | 0.84 ± 0.04 |
| PU41 | 3.9 ± 0.7 | 829.3 ± 55.7 | 1.22 ± 0.07 |
| PU51 | 2.0 ± 0.4 | 1176.0 ± 49.0 | 1.53 ± 0.05 |
3.4 Different intercalation effect
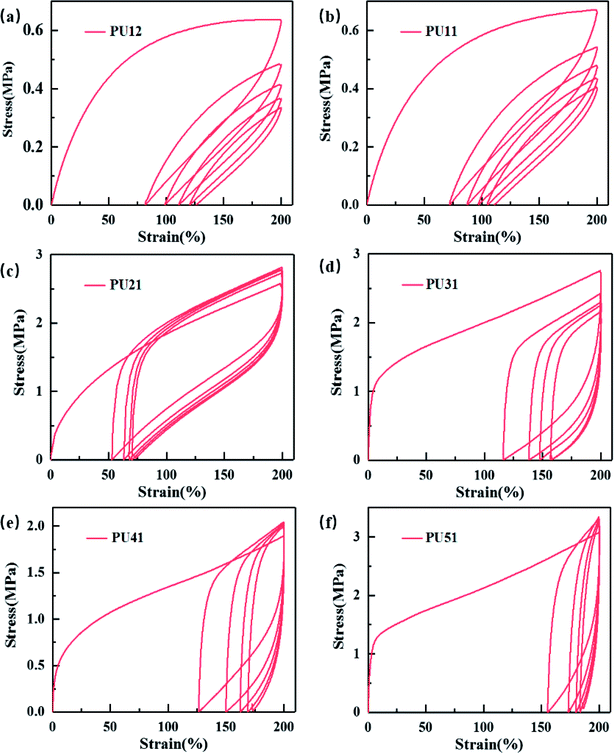
Cyclic tensile testing was used to evaluate the shape recovery property of the obtained bio-PUs. Fig. 4 exhibits the cyclic tensile curves of the bio-PUs with a 200% strain, and their recovery rates (Rr) of each cycle are listed in Table 4. It can be found that the recovery rates of all samples increase with cyclic number and almost keep constant after the second cycle, which has been reported.40,41 It is due to that the PUs almost formed an ideal elastomeric network after the first cycle in which weak physical cross-linking were destructed.42 Thus, these PUs show higher recovery rate after the following cycles. Compared with other bio-PUs, PU21 exhibit a higher than 98% recovery rate after the fourth cycles, including the excellent shape recovery property. With the ratio of the PLA diol to PCL diol increasing from 3![[thin space (1/6-em)]](https://www.rsc.org/images/entities/char_2009.gif) :
:![[thin space (1/6-em)]](https://www.rsc.org/images/entities/char_2009.gif) 1 to 5
1 to 5![[thin space (1/6-em)]](https://www.rsc.org/images/entities/char_2009.gif) :
:![[thin space (1/6-em)]](https://www.rsc.org/images/entities/char_2009.gif) 1, the recovery rate of the first cycle decreases, this is due to that the bio-PUs from the chain extender with long carbon chain diol show lower Tg resulting in lower permanent deformation. While the Tg of PUs from PU31 to PU51 are near or higher than the testing temperature (25 °C), leading to relatively high permanent deformation and low recovery rate of the first cycle.
1, the recovery rate of the first cycle decreases, this is due to that the bio-PUs from the chain extender with long carbon chain diol show lower Tg resulting in lower permanent deformation. While the Tg of PUs from PU31 to PU51 are near or higher than the testing temperature (25 °C), leading to relatively high permanent deformation and low recovery rate of the first cycle.
| Sample | Rr (1) | Rr (2) | Rr (3) | Rr (4) | Rr (5) |
|---|---|---|---|---|---|
| PU12 | 60.8 ± 2.6 | 83.8 ± 1.8 | 87.5 ± 0.4 | 89.4 ± 0.4 | 91.1 ± 0.6 |
| PU11 | 62.2 ± 2.1 | 86.2 ± 1.8 | 89.7 ± 1.6 | 91.5 ± 1.0 | 92.7 ± 1.0 |
| PU21 | 68.6 ± 2.4 | 92.4 ± 1.2 | 97.1 ± 0.7 | 97.8 ± 0.9 | 98.2 ± 1.0 |
| PU31 | 38.2 ± 2.7 | 75.4 ± 2.7 | 85.5 ± 2.2 | 86.4 ± 2.4 | 91.2 ± 2.1 |
| PU41 | 36.1 ± 0.7 | 67.7 ± 0.4 | 80.1 ± 1.0 | 83.6 ± 1.0 | 86.9 ± 1.1 |
| PU51 | 20.2 ± 0.7 | 61.8 ± 1.1 | 76.6 ± 1.4 | 84.2 ± 1.1 | 86.3 ± 0.5 |
It has been reported that the micro-phase structure in PUs is related to the shape memory property.43,44 Fig. 5 shows the phase morphology of the obtained bio-PUs from tapping mode AFM. From the images, when the ratio of PLA diol and PCL diol increases from 1![[thin space (1/6-em)]](https://www.rsc.org/images/entities/char_2009.gif) :
:![[thin space (1/6-em)]](https://www.rsc.org/images/entities/char_2009.gif) 2 to 5
2 to 5![[thin space (1/6-em)]](https://www.rsc.org/images/entities/char_2009.gif) :
:![[thin space (1/6-em)]](https://www.rsc.org/images/entities/char_2009.gif) 1, the white spots in phase images reduce first and then increase, which means the part of the high phase shift changes. The reason of phase shift is the interaction force between the sample and the tip.45 When the interaction force is elastic, the phase shift is positive. The greater the force, the larger the value.46 Thus, phase images indicated the change of elastic part of the sample. The shape memory property becomes stronger while the elastic part of the sample increases. However, when there is too much elastic part in the sample, the recovery rate reduces. This demonstrates that the suitable ratio of PLA diol and PCL diol shows better shape memory property.
1, the white spots in phase images reduce first and then increase, which means the part of the high phase shift changes. The reason of phase shift is the interaction force between the sample and the tip.45 When the interaction force is elastic, the phase shift is positive. The greater the force, the larger the value.46 Thus, phase images indicated the change of elastic part of the sample. The shape memory property becomes stronger while the elastic part of the sample increases. However, when there is too much elastic part in the sample, the recovery rate reduces. This demonstrates that the suitable ratio of PLA diol and PCL diol shows better shape memory property.
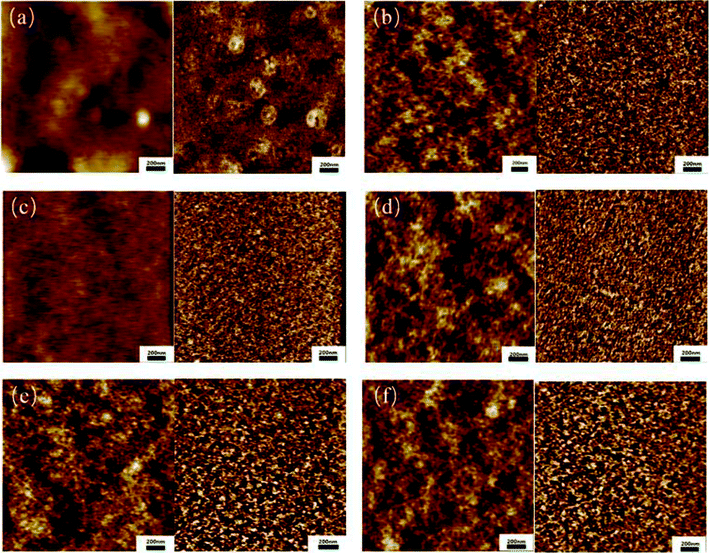 | ||
| Fig. 5 AFM height and phase images of the bio-PUs: (a) PU12; (b) PU11; (c) PU21; (d) PU31; (e) PU41; (f) PU51. | ||
For a more direct observation of shape memory behavior of the obtained bio-PUs, the macroscopic behavior of these samples was also investigated at body temperature. Fig. 6a shows the shape recovery process of PU21 at body temperature (37 °C). The PU21 was bent to a given angle at 37 °C and then cooled rapidly with liquid N2 and it reached the original shape state in 15 s at 37 °C. Similarly, the recovery time of other bio-PUs is no more than 32 s, as summarized in Fig. 6b. The result of macroscopic behavior tests is consistent with cyclic tensile tests.
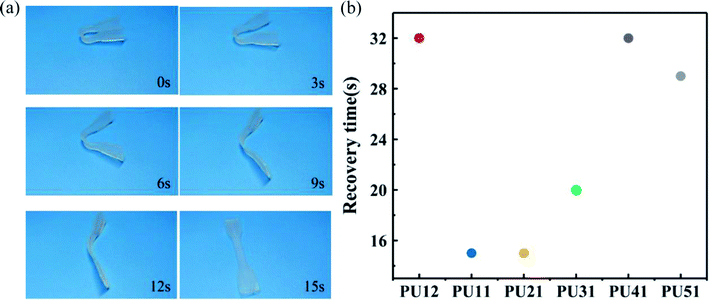 | ||
| Fig. 6 (a) Recovery process of shape memory PU21 at 37 °C (b) shape recovery time of the bio-PUs at 37 °C. | ||
Based on the above thermal, mechanical and shape memory properties of bio-PUs, we compare the data of T5%, Tmax, tensile strength, shape recovery rate and time of various bio-SMPUs, as shown in Table 5. The bio-SMPUs chosen in the table have similar test methods about shape memory properties. It can be found that the sample PU21 exhibits a good balance among the thermal properties, mechanical and shape memory properties. Especially, the PU21 shows best shape recovery rate.
| Sample | T5% (°C) | Tmax (°C) | Tensile strength (MPa) | Elongation (%) | Shape recovery rate | Macroscopic shape recovery time (s) |
|---|---|---|---|---|---|---|
| co-I2K35 | 261.9 | 306.4 | 3.5 | 350 | — | 135 |
| Bio-PU-CHDM36 | 255.6 | 306.3 | 2.4 ± 0.1 | 417.0 ± 20 | 92 ± 0.1 | 60 |
| N-coPLA-1000 (ref. 47) | 242.0 | 319.2 | 21.3 ± 0.4 | 88.4 ± 10 | 93.2 | 101 |
| PU132 (ref. 40) | — | — | 27.2 ± 3.6 | 880 ± 60 | 91.0 ± 2.2 | — |
| PU-21, this work | 250.9 | 339.8 | 10.2 ± 0.5 | 937.0 ± 43.0 | 98.2 ± 1.0 | 15 |
4. Conclusions
A series of amorphous and biodegradable bio-based polyurethane elastomers from PLA diol, PCL diol and MDI-50 were successfully prepared and characterized. The thermal and mechanical properties could be controlled by adjusting the ratio of the two diols to meet different practical demands. The Tg value of the obtained PUs can be adjusted in the range of −10.7–32.5 °C. The bio-PUs have low tensile strength (1.7–12.9 MPa) and high elongation (767.5–1345.7%). The suitable content of elastic part by adjusting the PLA/PCL ratio in the samples leads to the improvement of the shape memory properties. Among them, PU21 exhibits better shape recovery behavior, which is beneficial for applications in biomedical devices.Conflicts of interest
The authors declare that they have no competing interests.Acknowledgements
The research is financially supported by Zhejiang Key Research and Development Project (Grant No. 2019C02073).References
- J. Ban, L. Zhu, S. Chen and Y. Wang, Materials, 2016, 9, 792 CrossRef PubMed.
- X. Li and M. J. Serpe, Adv. Funct. Mater., 2016, 26, 3282–3290 CrossRef CAS.
- L. Sun, W. M. Huang, C. C. Wang, Z. Ding, Y. Zhao, C. Tang and X. Y. Gao, Liq. Cryst., 2014, 41, 277–289 CrossRef CAS.
- C. Renata, W. M. Huang, L. W. He and J. J. Yang, Journal of Mechanical Science and Technology, 2017, 31, 4863–4873 CrossRef.
- M. Zarek, M. Layani, I. Cooperstein, E. Sachyani, D. Cohn and S. Magdassi, Adv. Mater., 2016, 28, 4166 CrossRef CAS PubMed.
- A. C. Weems, A. J. Boyle and D. J. Maitland, Smart Mater. Struct., 2017, 26, 035054 CrossRef PubMed.
- J. Morshedian, H. A. Khonakdar and S. Rasouli, Macromol. Theory Simul., 2010, 14, 428–434 CrossRef.
- S. Lin, E. K. Lee, N. Nguyen and M. Khine, Lab Chip, 2014, 14, 3475–3488 RSC.
- W. M. Huang, Z. Ding, C. C. Wang, J. Wei, Y. Zhao and H. Purnawali, Mater. Today, 2010, 13, 54–61 CrossRef CAS.
- T. Todaka, D. Yamamichi and M. Enokizono, IEEE Trans. Magn., 2011, 47, 926–929 Search PubMed.
- H. Lu, W. M. Huang, F. Liang and K. Yu, Materials, 2013, 6, 3742–3754 CrossRef CAS PubMed.
- A. Lendlein, S. Kelch, K. Kratz and J. Schulte, E. Mater. Sci. Tech., 2010, 33, 251 Search PubMed.
- C. Liang and C. Rogers, J. Intell. Mater. Syst. Struct., 2013, 1, 207–234 CrossRef.
- C. Liu, H. Qin and P. T. Mather, J. Mater. Chem., 2007, 17, 1543–1558 RSC.
- D. Ratna and J. Karger-Kocsis, J. Mater. Sci., 2008, 43, 254–269 CrossRef CAS.
- X. Fan, B. H. Tan, Z. Li and J. L. Xian, ACS Sustainable Chem. Eng., 2017, 5, 1217–1227 CrossRef CAS.
- M. A. Kazemilari, M. H. Malakooti and H. A. Sodano, Smart Mater. Struct., 2017, 26, 055003 CrossRef.
- S. J. Hong, H. Y. Ji and W. R. Yu, Fibers Polym., 2010, 11, 749–756 CrossRef CAS.
- J. H. Kim and T. W. Kang, J. Biomech. Eng., 2009, 43, 632–643 Search PubMed.
- T. Wu, K. O'Kelly and B. Chen, Eur. Polym. J., 2014, 53, 230–237 CrossRef CAS.
- C. Azra, Y. Ding, C. J. G. Plummer and J. A. E. Månson, Eur. Polym. J., 2013, 49, 184–193 CrossRef CAS.
- N. Zheng, Z. Fang, W. Zou, Q. Zhao and T. Xie, Angew. Chem., Int. Ed., 2016, 55, 11421–11425 CrossRef CAS PubMed.
- D. Kai, M. P. Prabhakaran, B. Q. Chan, S. S. Liow, S. Ramakrishna, F. Xu and X. J. Loh, Biomed. Mater., 2016, 11, 015007 CrossRef PubMed.
- S. Chen, Z. Mei, H. Ren, H. Zhuo, J. Liu and Z. Ge, Polym. Chem., 2016, 7, 5773–5782 RSC.
- P. Singhal, W. Small, E. Cosgriffhernandez, D. J. Maitland and T. S. Wilson, Acta Biomater., 2014, 10, 67–76 CrossRef CAS PubMed.
- M. S. Reeve, S. P. Mccarthy, M. J. Downey and R. A. Gross, Macromolecules, 1994, 27, 825–831 CrossRef CAS.
- A. Lendlein, J. Zotzmann, Y. Feng, A. Alteheld and S. Kelch, Biomacromolecules, 2009, 10, 975–982 CrossRef CAS PubMed.
- P. Singhal, J. N. Rodriguez, W. Small, S. Eagleston, V. D. W. Judy, D. J. Maitland and T. S. Wilson, J. Polym. Sci., Part B: Polym. Phys., 2012, 50, 724–737 CrossRef CAS PubMed.
- Z. Deng, Y. Guo, X. Zhao, L. Li, R. Dong, B. Guo and P. X. Ma, Acta Biomater., 2016, 46, 234–244 CrossRef CAS PubMed.
- P. Sarazin, G. Li, W. J. Orts and B. D. Favis, Polymer, 2008, 49, 599–609 CrossRef CAS.
- H. T. Saşmazel, M. Gümüşderelioğlu, A. Gürpinar and M. A. Onur, Biomed. Mater. Eng., 2008, 18, 119–128 Search PubMed.
- J. K. Oh, Soft Matter, 2011, 7, 5096–5108 RSC.
- J. Brzeska, M. Morawska, W. Sikorska, A. Tercjak, M. Kowalczuk and M. Rutkowska, Chem. Pap., 2017, 71, 2243–2251 CrossRef CAS PubMed.
- S. Y. Gu and X. F. Gao, RSC Adv., 2015, 5, 90209–90216 RSC.
- B. Cui, Q. Y. Wu, G. Lin, S. Liang and H. B. Yu, Chin. J. Polym. Sci., 2016, 34, 901–909 CrossRef CAS.
- L. Gu, B. Cui, Q. Y. Wu and H. Yu, RSC Adv., 2016, 6, 17888–17895 RSC.
- B. K. Kim, Y. J. Shin, S. M. Cho and H. M. Jeong, J. Polym. Sci., Part B: Polym. Phys., 2015, 38, 2652–2657 CrossRef.
- H. M. Jeong, B. K. Ahn, S. M. Cho and B. K. Kim, J. Polym. Sci., Part B: Polym. Phys., 2015, 38, 3009–3017 CrossRef.
- W. Wang, P. Peng, X. Chen and X. Jing, Polym. Int., 2010, 56, 840–846 CrossRef.
- L. Zhang, M. Huang, R. Yu, J. Huang, X. Dong, R. Zhang and J. Zhu, J. Mater. Chem. A, 2014, 2, 11490–11498 RSC.
- P. Peng, W. Wang, X. Chen and X. Jing, J. Polym. Sci., Part B: Polym. Phys., 2010, 45, 557–570 CrossRef.
- R. Dargazany, V. N. Khiêm and M. Itskov, Int. J. Plast., 2014, 63, 94–109 CrossRef.
- S. Chen, C. Qi, J. Bo, Y. Cai, P. Liu and J. Hu, J. Appl. Polym. Sci., 2010, 102, 5224–5231 CrossRef.
- S. A. Abdullah, A. Jumahat, N. R. Abdullah and L. Frormann, Procedia Eng., 2012, 41, 1641–1646 CrossRef CAS.
- Á. S. Paulo and R. García, Phys. Rev. B: Condens. Matter Mater. Phys., 2001, 64, 193411 CrossRef.
- R. García, J. Tamayo, M. Calleja and F. García, Appl. Phys. A, 1998, 66, S309–S312 CrossRef.
- S. Shi, Q.-Y. Wu, L. Gu, K. Zhang and H. Yu, RSC Adv., 2016, 6, 79268–79274 RSC.
| This journal is © The Royal Society of Chemistry 2019 |

