
 Open Access Article
 This Open Access Article is licensed under a Creative Commons Attribution-Non Commercial 3.0 Unported Licence
Computational analysis of hot spots and binding mechanism in the PD-1/PD-L1 interaction†
Dading Huanga,
Wei Wena,
Xiao Liua,
Yang Lia and
John Z. H. Zhang *abcd
*abcd
aState Key Laboratory for Precision Spectroscopy, Shanghai Engineering Research Center of Molecular Therapeutics & New Drug Development, School of Chemistry and Molecular Engineering, East China Normal University, Shanghai 200062, China. E-mail: john.zhang@nyu.edu
bNYU-ECNU Center for Computational Chemistry at NYU Shanghai, Shanghai 200062, China
cDepartment of Chemistry, New York University, NY, NY 10003, USA
dCollaborative Innovation Center of Extreme Optics, Shanxi University, Taiyuan, Shanxi 030006, China
First published on 14th May 2019
Abstract
Programmed cell death protein-1 (PD-1) is an important immunological checkpoint and plays a vital role in maintaining the peripheral tolerance of the human body by interacting with its ligand PD-L1. The overexpression of PD-L1 in tumor cells induces local immune suppression and helps the tumor cells to evade the endogenous anti-tumor immunity. Developing monoclonal antibodies against the PD-1/PD-L1 protein–protein interaction to block the PD-1/PD-L1 signaling pathway has demonstrated superior anti-tumor efficacy in a variety of solid tumors and has made a profound impact on the field of cancer immunotherapy in recent years. Although the X-ray crystal structure of the PD-1/PD-L1 complex has been solved, the detailed binding mechanism of the PD-1/PD-L1 interaction is not fully understood from a theoretical point of view. In this study, we performed computational alanine scanning on the PD-1/PD-L1 complex to quantitatively identify the hot spots in the PD-1/PD-L1 interaction and characterize its binding mechanisms at the atomic level. To the best of our knowledge, this is the first time that theoretical calculations have been used to systematically and quantitatively predict the hot spots in the PD-1/PD-L1 interaction. We hope that the predicted hot spots and the energy profile of the PD-1/PD-L1 interaction presented in this work can provide guidance for the design of peptide and small molecule drugs targeting PD-1 or PD-L1.
1. Introduction
Protein–protein interactions (PPIs) play vital roles in many biological processes, including gene expression control, signal transduction and immunoregulation.1–3 Thus they are associated with many human diseases including cancer.4–6 By studying the detailed and specific interactions of PPIs at the atomic level, we can understand their fundamental binding mechanisms and develop effective therapeutic treatments to control and cure related diseases.7 Generally, only a fraction of PPI interface residues, called “hot spots”, contribute significantly to the binding free energy of PPI while the area of the contact surface can be relatively large.8–10 Mutation of the hot spots in PPI could dramatically decrease their binding affinity or even disrupt the protein–protein association directly. For many diseases caused by disordered PPIs (e.g. overexpression of proteins and gain-of-function mutations), pocket or part of the surface composed of hot spots could be targeted to regulate the abnormal PPIs in drug design.11 Therefore, predicting the hot spots in PPIs becomes an important step in the many designs of drugs that block abnormal PPIs.Experimentally, alanine scanning mutagenesis is widely used to identify hot spots in PPIs.12 This method comprises multiple steps involving expressing the corresponding wild-type and alanine mutant proteins, measuring their binding affinities, and calculating their binding energy differences. Generally, if the binding free energy difference of the alanine mutation of a residue is greater than 2 kcal mol−1, the residue is then identified as a hot spot.10 Although this technique is well-developed, large-scale experimental alanine scanning is still costly and time-consuming.13 Thus, the available experimental data are fairly limited and diverse efficient computational hot spot detection methods have been developed. Currently, various theoretical hot spot detection methods can be roughly classified into molecular dynamics simulation-based methods (MD-based methods),14–21 knowledge-based methods,22–29 empirical formula-based methods,30–34 and network topology-based methods.35–38 Among them, the MD-based computational alanine scanning is more quantitative and its result can be compared with experimental data directly.14,15,17–19
Immunologic checkpoint receptors, such as the cytotoxic T-lymphocyte-associated protein 4 (CTLA-4) and programmed cell death protein 1 (PD-1), are brakes of the human immune system that prevent the over-activation of T cells which could cause autoimmunity such as inflammation.39–42 Some tumor cells utilize this characteristic of the immune system through the expression of immune checkpoint ligands to induce local immune suppression. By attenuating and exhausting the activity of T cells, tumor cell can evade the endogenous anti-tumor immunity.43–45 For example, programmed cell death 1 ligand 1 (PD-L1), a member of the B7 family, is widely overexpressed in many types of tumors such as lung cancer, breast cancer, glioblastoma, ovarian, and bladder cancers.46,47 The engagement of PD-1 and PD-L1 results in the activation of the inhibitory function of PD-1 in T cells.48
Some antibodies have been developed to block the PD-1/PD-L1 signaling pathway by targeting PD-1 (nivolumab, pembrolizumab, etc.) or PD-L1 (atezolizumab, avelumab, durvalumab, etc.) and yield unprecedented efficacy for some types of cancer (melanoma, non-small cell lung cancer, renal cell cancer, etc.) in clinical trials.49–53 By inhibiting the activity of inhibitory molecules in the PD-1/PD-L1 axis, immune checkpoint inhibitors release the immune brake of T cells in the tumor microenvironment, thereby achieve anti-tumor effects.54,55 Small-molecule inhibitors that target PD-1 or PD-L1 are also feasible and some have been applied for patents.56–59
Recently, the crystal structure of the extracellular part of the human PD-1/PD-L1 complex has been solved by Zak et al. and it provides valuable information about the binding mechanism of the PD-1/PD-L1 interaction (Fig. 1).60 According to the crystal structure, PD-1 and PD-L1 primarily interact through a large interface formed by the β-sheets of PD-1 and PD-L1. Comparing to the crystal structures of apo-proteins (apo-PD-1 and apo-PD-L1), the CC′ loop of PD-1 is relatively flexible and shows significant conformational changes along with the PD-L1 binding, while PD-L1 is more rigid and shows less conformational differences.61–63
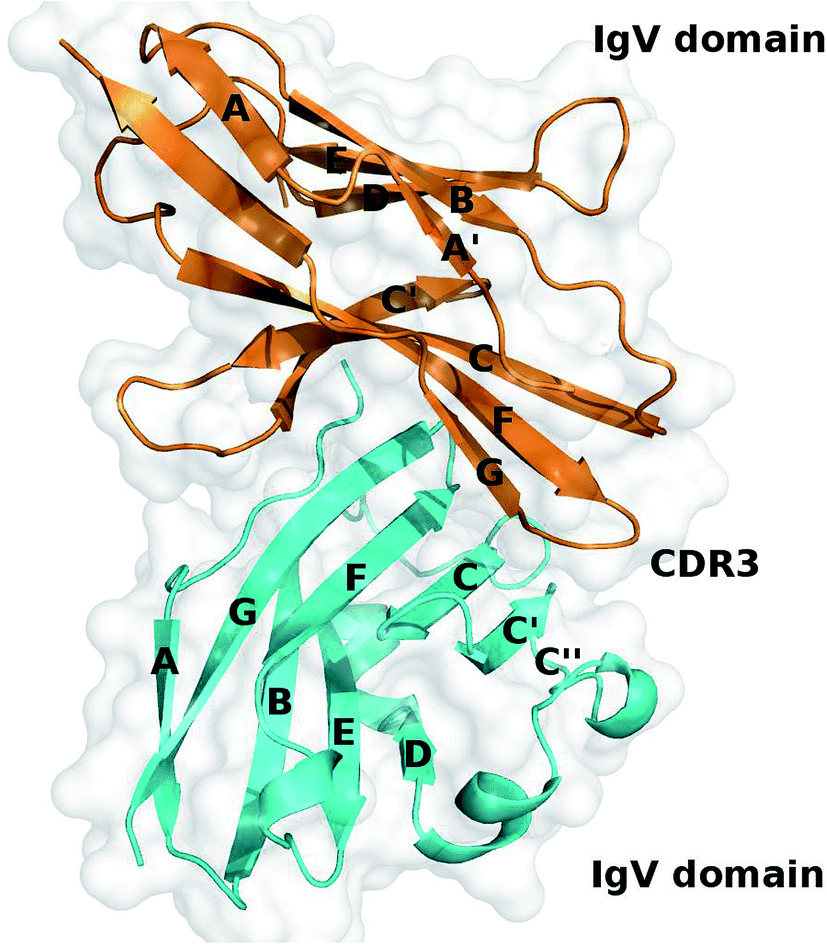 | ||
| Fig. 1 Crystal structure of the PD-1/PD-L1 complex (PDB ID: 4ZQK). PD-1 and PD-L1 are shown in cartoon and colored in orange and cyan, respectively. | ||
However, it is still unclear which interfacial residues on PD-1 and PD-L1 are hot spots that are critical for their binding even if the crystal structure of the complex has been revealed. In this study, we use the recently developed MM/GBSA/IE method to quantitatively identify the hot spots in the PD-1/PD-L1 interaction.64–67 Our result shows that a hydrophobic core and a surrounding hydrogen bond network formed by the hot spots of PD-1 and PD-L1 dominate their binding. These predicted hot spots and their energy information should be helpful to the rational design of inhibitors targeting the PD-1/PD-L1 signal pathway.
2. Theoretical methods
2.1. Molecular dynamics simulation of the PD-1/PD-L1 complex
The X-ray crystal structure of the PD-1/PD-L1 complex (PDB ID: 4ZQK) was downloaded from the Protein Data Bank (PDB) database and the missing residues (residues 85–92) of PD-1 were modeled by the SWISS-MODEL server.60,68 The tleap module in the AMBER14 suite was used to add hydrogen atoms to the complex and solvate the complex by the TIP3P water in a truncated octahedral box with a buffer distance of 12.0 Å.69,70 Chlorine and sodium counter ions were added to the box to neutralize the charge of the system. The system was parameterized using the AMBER ff14SB force field.71 Periodic boundary condition (PBC) was imposed on the system to eliminate the boundary effect. A cutoff distance of 10.0 Å was set for non-bonded interactions and the long-range electrostatic interactions were treated by the Particle Mesh Ewald (PME) method.72 SHAKE algorithm was used to constrain the covalent bonds involving hydrogen atoms and the time step was set to 2 fs.73 The temperature was controlled by the Langevin thermostat with a collision frequency of 5.0 ps−1 and the Berendsen barostat was used to control the pressure at 1.0 atm.74,75 Pmemd.cuda implemented in AMBER14 was used to perform MD simulations.In the energy minimization step, the system was firstly minimized with the PD-1/PD-L1 complex constrained, then minimized with the backbone of the PD-1/PD-L1 complex constrained and lastly without any constraints. After the energy minimization, the system was heated to 300 K with harmonic constraints on the backbone atoms of the PD-1/PD-L1 complex within 200 ps and equilibrated in NVT and NPT ensembles at 300 K for 25 ns. The RMSD of the backbone atoms of the PD-1/PD-L1 complex was monitored until it reached a steady state in the equilibration stage. Finally, we performed 5 independent 2 ns production runs (trajectories) to generate ensembles for further analysis. A total of 10![[thin space (1/6-em)]](https://www.rsc.org/images/entities/char_2009.gif) 000 configurations with an interval of 0.2 ps were extracted from each production MD trajectory and used for computational alanine scanning.
000 configurations with an interval of 0.2 ps were extracted from each production MD trajectory and used for computational alanine scanning.
2.2. Computational alanine scanning
There are basically two approaches to generating the alanine mutant trajectory, single- and multiple-trajectory approaches, in the MD-based computational alanine scanning.14 In the single-trajectory approach, the alanine mutant trajectory is simply generated from the wild-type trajectory by truncating the side chain of the residue to be mutated while the Cβ atom and its linking hydrogen atoms are retained. The truncated X atom(s) is replaced by a hydrogen atom in the same direction as that of the Cβ–X bond and the length of the new Cβ–H bond is set to the default value according to the molecular model that used. The single-trajectory approach benefits from error cancellation and can partially offset the problem of insufficient sampling of conformational space. Previous studies have shown that the single-trajectory approach is more efficient and accurate than the multiple-trajectory approach.14,15,17,18 In this work, we chose the single-trajectory approach to generate the alanine mutant trajectory for the above reasons.2.3. Binding free energy difference
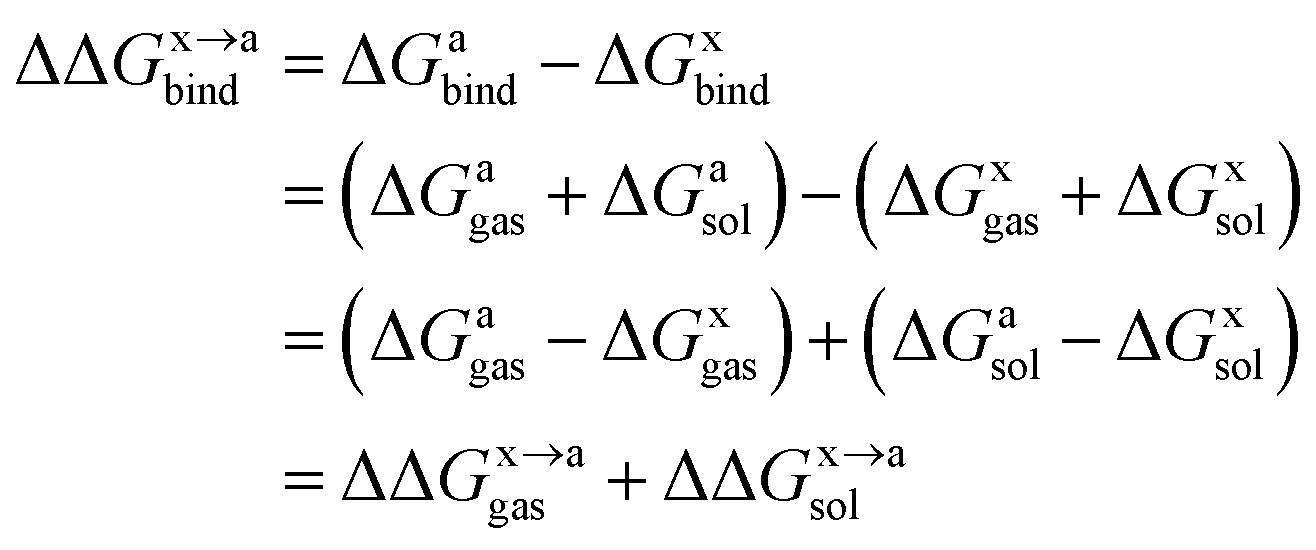
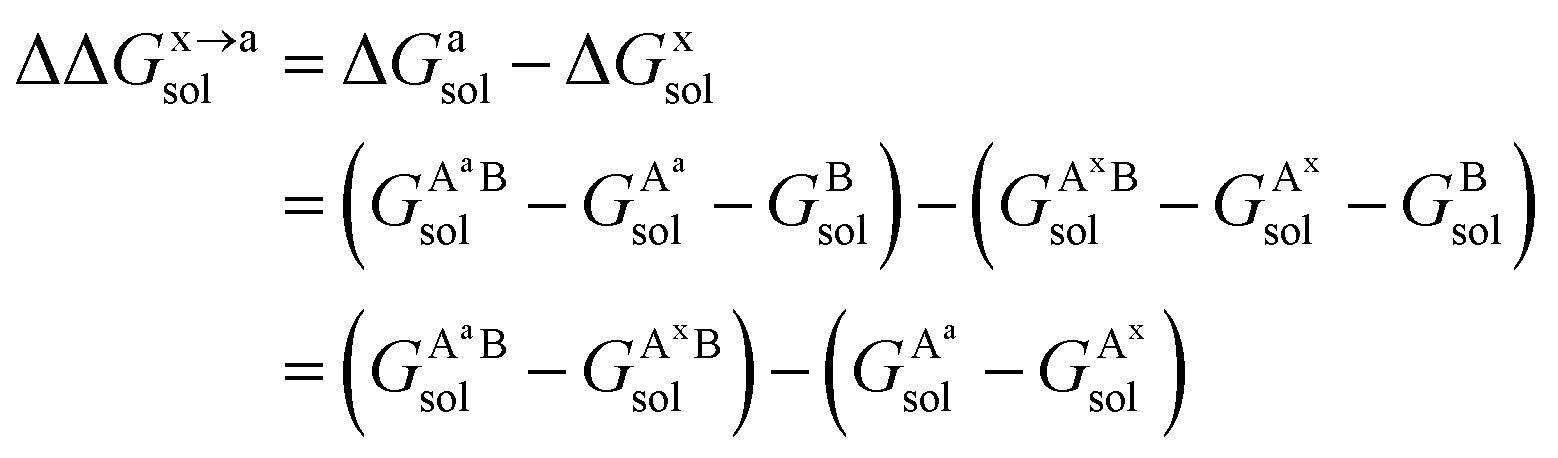
In order to calculate the binding free energy difference ( ) between the wild-type and alanine mutant PPI complexes, we need to calculate the binding free energies of the wild-type (ΔGxbind) and alanine mutant (ΔGabind), and then obtain their difference:64,65,76,77
 | (1) |
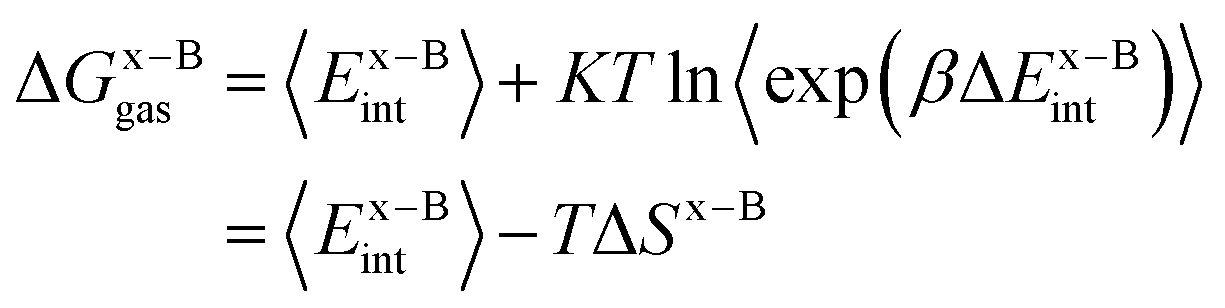
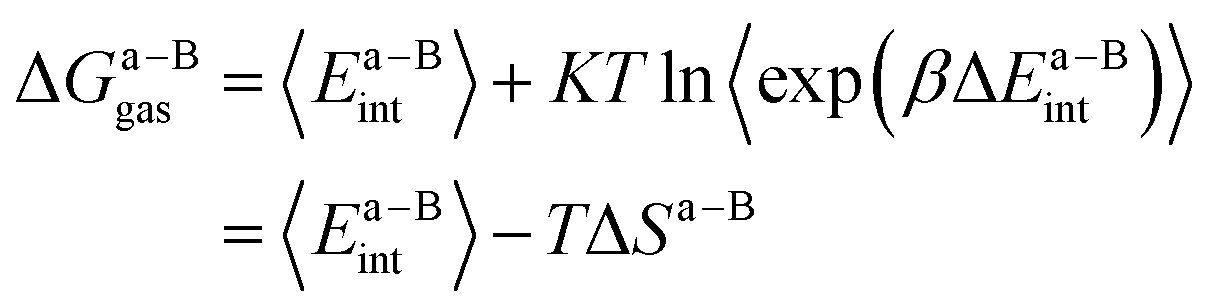
Here, ΔGbind, ΔGgas and ΔGsol represent the total binding free energy, the gas-phase component and the solvation free energy component of the total binding free energy, respectively. The superscript “x → a” represents that a specific residue “x” of the Ax protein mutates to alanine “a”, and the superscripts “x” and “a” denote the wild-type (Ax–B) and the mutant (Aa–B), respectively.
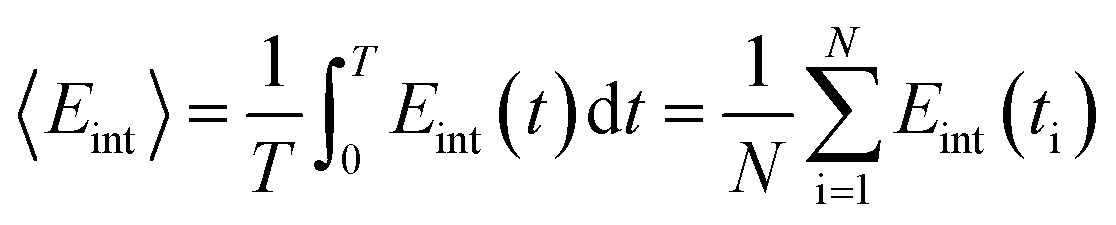
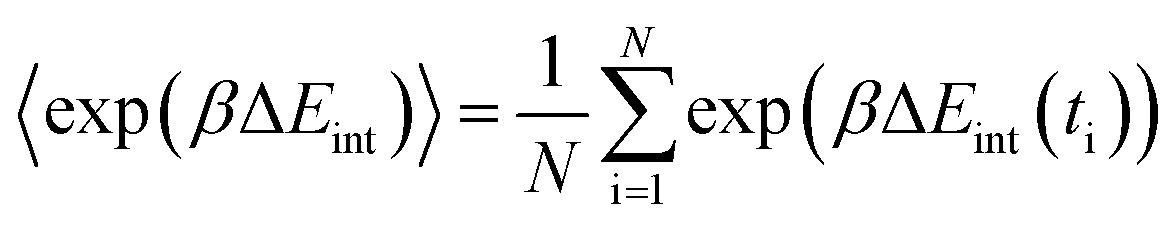
In this work, we use the recently developed MM/GBSA/IE method which combines the MM/GBSA and IE methods to calculate the gas-phase and the solvation components in eqn (1). In the MM/GBSA/IE method, the gas-phase component is calculated as follows:64,65
 | (2) |
 | (3) |
 | (4) |
|
−TΔS = KTln〈exp(βΔEint)〉,
| (5) |
 | (6) |
 | (7) |
For the solvation component  , it can be expanded as follows
 | (8) |
 ,
,  , GBsol,
  and
and  are the solvation free energies of the Ax protein, the Aa protein, the B protein, the AxB protein–protein complex, and the AaB protein–protein complex, respectively. Thus the solvation free energy of B (ΔGBsol) is canceled and the last four solvation free energy terms need to be calculated to obtain
  . In the MM/GBSA approach, the solvation free energy of a system is defined as the sum of two terms:
| Gsol = Ggb + Gnp, | (9) |
| Gnp = γSASA + β | (10) |
The γ and β values we used here are the standard values of 0.00542 kcal (mol−1 Å2) and 0.92 kcal mol−1.
In this work, we run 5 trajectories for statistical averaging. For each trajectory, an interval of 10 ps was used to calculate the average of the interaction energy and the corresponding energy fluctuations. A total of 10000 configurations with an interval of 0.2 ps were extracted from each 2 ns production trajectory for the IE calculation. This results in calculating a total of 2000 averages with 50 energy points for every average in the calculation of the fluctuation of the interaction energy for each trajectory. For MM/GBSA, a total of 100 frames equally distributed among the 10000 configurations are used. The MM/PB(GB)SA method implemented in the AMBER14 package is applied for the MM/GBSA calculations.69 Other detailed settings for the MM/GBSA/IE calculations are the same as in ref. 64.
3. Results and discussion
3.1. Stability of the PD-1/PD-L1complex in MD simulations
The root mean square deviation (RMSD) of the atomic positions from that of the crystal structure is usually considered to be an indicator of the stability of the system during MD simulations. Thus, we calculated the RMSDs of the heavy and Cα atoms of the complex with reference to the initial crystal structure and plotted them in Fig. 2. The RMSDs shown in Fig. 2 indicate that the complex is relatively stable with nominal fluctuations near the equilibrium state during the last 20 ns MD simulation. The average values of the RMSDs of the heavy atoms and Cα atoms are 2.11 and 1.59 Å with the standard deviations of 0.13 and 0.16 Å, respectively. This result shows the complex is similar to the crystal structure and does not have large deviations during the MD simulation.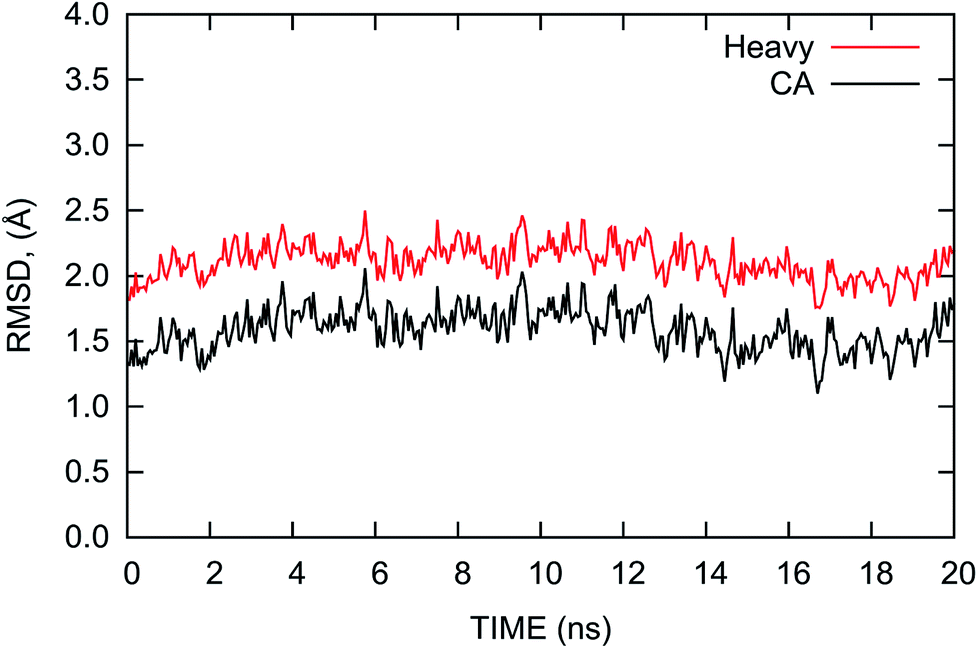 | ||
| Fig. 2 RMSDs of the heavy atoms (red) and Cα atoms (black) of the PD-1/PD-L1 complex relative to the initial crystal structure as a function of time during the last 20 ns MD simulation. | ||
The root mean square fluctuations (RMSFs) of the residues in the PD-1/PD-L1 complex are also calculated and plotted in Fig. 3. The RMSF curve of PD-1 shown in Fig. 3 is similar to that obtained from a 200 ns MD simulation by Shi et al.78 The C’D loop (residues 85–95), which was not determined in the crystal structure and was model by the SWISS-MODEL server in this work, is the most flexible region of the liganded PD-1. Other regions of PD-1 are relatively rigid while some loops (such as BC and CC′ loops) show relatively minor fluctuations. For PD-L1 in the complex, the most flexible region is the BC loop (residues 41–54). This is consistent with the recent finding of the principal component analysis (PCA) of all the crystal structures that contain the IgV domain of PD-L1.79 The PD-1/PD-L1 complex structure obtained from the PDB database with missing residues added by the SWISS-MODEL server is stable during the MD simulations and should be reliable for further analysis.
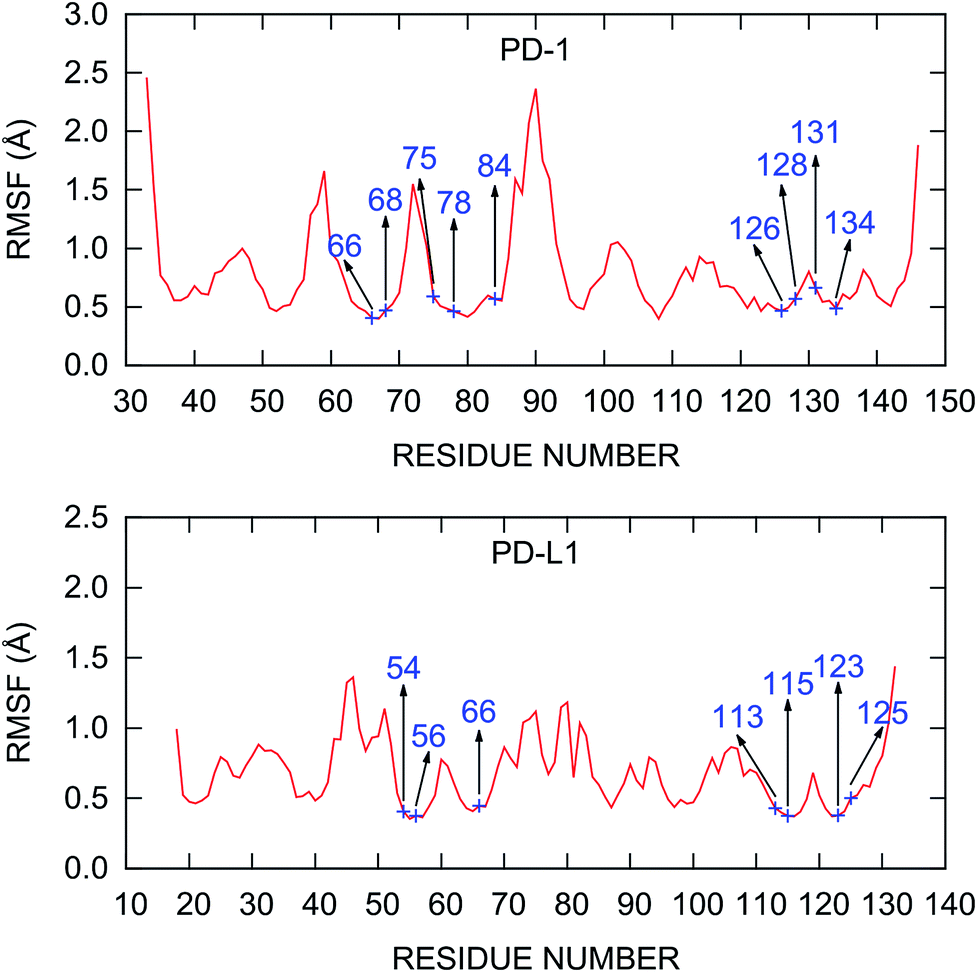 | ||
| Fig. 3 RMSF of the Cα atoms calculated from the last 20 ns MD trajectory. The hot and warm spots predicted by the MM/GBSA/IE method are labeled. | ||
3.2. Quantitative prediction of residue-specific binding energies
The recently developed computational alanine scanning approach based on the MM/GBSA/IE method is used to identify the hot spots in the interface of the PD-1/PD-1 interaction. The interface residues of PD-1 and PD-L1 are scanned if their nearest atom-pair distance is less than 5.0 Å. A total of 22 and 20 interfacial residues of PD-1 and PD-L1 are scanned and the detailed results are ranked according to the computed ΔΔG values (Table S1†). Examination of the residue types of the hot spots in the PD-1/PD-L1 interaction shows that the hot spots are primarily formed by nonpolar and polar residues while some basic residues are also hot spots (Table 1). This means that both nonpolar and polar interactions are important for the PD-1/PD-L1 binding.| Protein | Nonpolar | Polar | Basic | Acidic |
|---|---|---|---|---|
| Hot spots | ||||
| PD-1 | PD-1I134 | PD-1Q75 | PD-1K78 | PD-1E84 |
| PD-1I126 | PD-1Y68 | |||
| PD-1L128 | PD-1N66 | |||
| PD-L1 | PD-L1M115 | PD-L1Y123 | PD-L1R125 | |
| PD-L1Y56 | PD-L1R113 | |||
| PD-L1Q66 | ||||
|
||||
| Warm spots | ||||
| PD-1 | PD-L1I54 | PD-1K131 | ||
| PD-L1 | PD-L1K124 | |||
For PD-1, there are 8 hot spots (PD-1Q75, PD-1I134, PD-1I126, PD-1E84, PD-1K78, PD-1Y68, PD-1L128, and PD-1N66) with the ΔΔG values greater than 2 kcal mol−1 and 1 warm spot (PD-1K131) with the ΔΔG between 1-2 kcal mol−1 (Fig. 4). For PD-L1, there are 6 hot spots (PD-L1Y123, PD-L1Y56, PD-L1R125, PD-L1M115, PD-L1R113, and PD-L1Q66) and 2 warm spots (PD-L1I54 and PD-L1K124) (Fig. 4). Hence the number of the hot and warm spots on PD-L1 is close to that on PD-1. The energy components of the hot and warm spots on PD-1 and PD-L1 are shown in Table 2 and plotted in Fig. S2.† As shown in Fig. S2,† the hot spots on PD-1 and PD-L1 are mostly dominated by van der Waals (VDW) interactions except for PD-1E84, PD-1Y68, and PD-1N66 which are dominated by polar and nonpolar interactions.
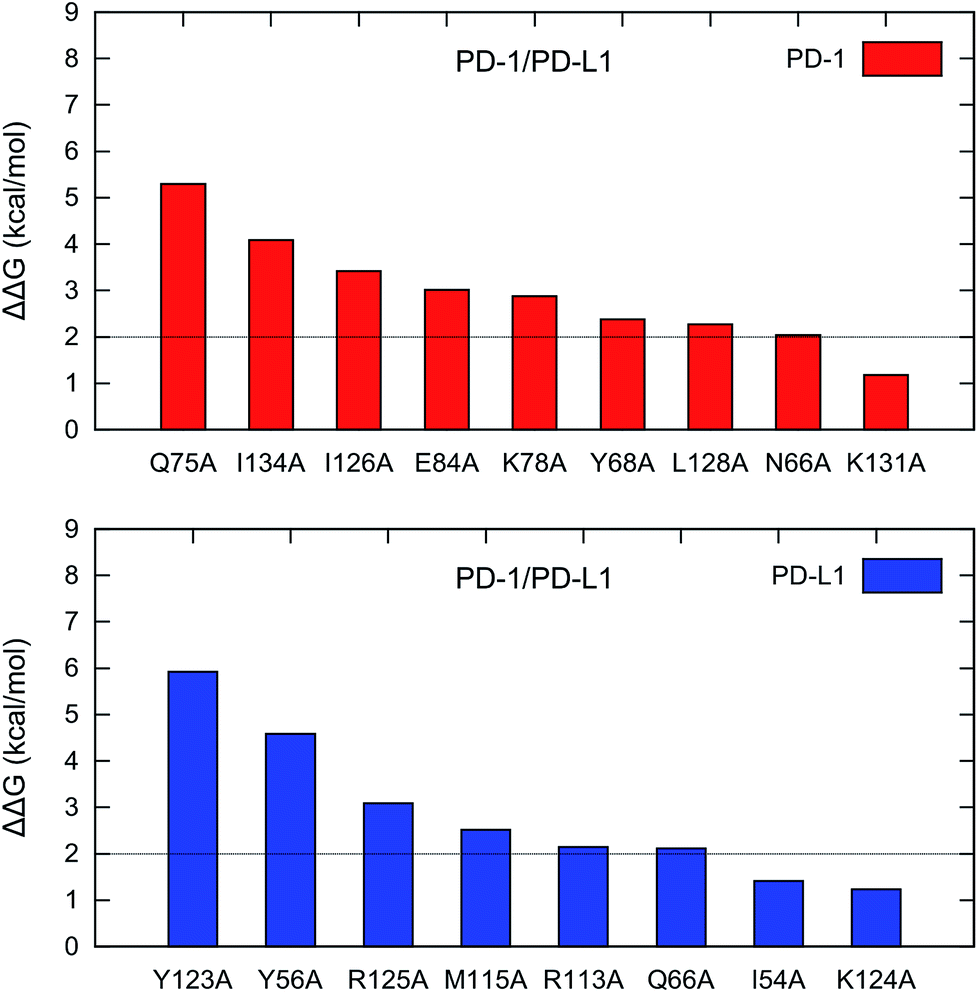 | ||
| Fig. 4 Hot and warm spots in the PD-1/PD-L1 interaction predicted by the MM/GBSA/IE method. | ||
| Mutation | ΔΔEvdW | ΔΔEele | ΔΔGgb | ΔΔGnp | ΔΔH | SD1a | ΔΔIE | SD2b | ΔΔG | SDc |
|---|---|---|---|---|---|---|---|---|---|---|
| a Standard deviation of ΔΔH.b Standard deviation of ΔΔIE.c Standard deviation of ΔΔG. | ||||||||||
| (A) PD-1 | ||||||||||
| Q75A | 4.14 | 10.77 | −8.48 | 0.34 | 6.78 | 0.27 | −1.48 | 0.28 | 5.30 | 0.54 |
| I134A | 5.91 | −0.29 | −0.80 | 0.12 | 4.95 | 0.22 | −0.87 | 0.26 | 4.09 | 0.46 |
| I126A | 4.53 | −0.01 | −0.41 | −0.08 | 4.03 | 0.12 | −0.60 | 0.03 | 3.42 | 0.10 |
| E84A | 2.03 | 11.58 | −8.62 | 0.09 | 5.08 | 0.14 | −2.08 | 0.18 | 3.01 | 0.24 |
| K78A | 2.98 | 4.33 | −2.93 | 0.07 | 4.46 | 0.17 | −1.58 | 0.07 | 2.88 | 0.21 |
| Y68A | 1.80 | 5.23 | −3.74 | −0.08 | 3.22 | 0.23 | −0.84 | 0.07 | 2.38 | 0.27 |
| L128A | 3.56 | −0.38 | −0.67 | 0.14 | 2.65 | 0.10 | −0.38 | 0.03 | 2.27 | 0.12 |
| N66A | 1.39 | 3.15 | −2.06 | −0.06 | 2.42 | 0.04 | −0.38 | 0.03 | 2.04 | 0.07 |
| K131A | 1.69 | 7.31 | −7.43 | 0.19 | 1.76 | 0.08 | −0.58 | 0.06 | 1.18 | 0.09 |
|
||||||||||
| (B) PD-L1 | ||||||||||
| Y123A | 7.14 | 3.96 | −3.98 | 0.49 | 7.60 | 0.50 | −1.69 | 0.11 | 5.92 | 0.46 |
| Y56A | 5.24 | 0.50 | −0.68 | 0.04 | 5.10 | 0.28 | −0.52 | 0.04 | 4.59 | 0.27 |
| R125A | 4.64 | −2.21 | 1.50 | 0.55 | 4.48 | 0.38 | −1.39 | 0.10 | 3.09 | 0.41 |
| M115A | 3.93 | −0.96 | −0.03 | 0.06 | 2.99 | 0.12 | −0.47 | 0.04 | 2.52 | 0.10 |
| R113A | 2.59 | 0.48 | 0.62 | 0.30 | 3.99 | 0.72 | −1.84 | 0.10 | 2.15 | 0.65 |
| Q66A | 2.25 | 3.16 | −2.92 | 0.04 | 2.53 | 0.03 | −0.43 | 0.04 | 2.11 | 0.04 |
| I54A | 1.88 | −0.08 | −0.38 | 0.13 | 1.55 | 0.05 | −0.14 | 0.00 | 1.41 | 0.04 |
| K124A | 3.02 | 3.21 | −3.56 | 0.34 | 3.01 | 0.11 | −1.78 | 0.52 | 1.23 | 0.59 |
A close-up analysis of the predicted hot spots in the interface of the complex indicates a hydrophobic core formed by PD-1I134, PD-1I126, and PD-1L128 of PD-1 and PD-L1Y123, PD-L1Y56, PD-L1M115, PD-L1R113, and PD-L1I54 of PD-L1 (Fig. 5 and 6). The hot spot PD-1I134 is an important residue of PD-1, its side chain interacts directly with the side chains of PD-L1Y123, PD-L1R113, PD-L1M115, and PD-L1Y56 by van der Waals interactions (Fig. S2†). The PD-1I134A mutation leads to the loss of about 4 kcal mol−1 of the binding free energy (Table 2A), highlighting the importance of these hydrophobic interactions. The hot spots PD-1I126, PD-1L128, and PD-1I134, together with PD-1A132, form a hydrophobic pocket to accommodate PD-L1M115 (named M115 pocket) (Fig. 6A). The PD-1I126A and PD-1L128A mutations lead to a decrease of about 3 kcal mol−1 and 2 kcal mol−1 of the binding free energy, respectively. Indicating that PD-1I126 and PD-1L128 contribute less than PD-1I134 for the PD-1/PD-L1 binding. For PD-L1, the hot spot PD-L1M115 binds to the center of the hydrophobic pocket that formed by the hot spots on PD-1 (Fig. 5). Our calculation shows that the PD-L1M115A mutation leads to a decrease of over 2 kcal mol−1 of the binding free energy (Table 2B). This's less than the binding free energy differences of the PD-L1Y123A, PD-L1Y56A, and PD-L1R125A mutations. The PD-L1Y123A mutation results in a loss of ΔΔG greater than 5 kcal mol−1. The side chain of PD-L1Y123 interacts with the side chain of PD-1I134 and forms a π–π interaction with PD-1Y68 (Fig. 5). Moreover, the hydroxyl group of the side chain of PD-L1Y123 forms a stable hydrogen bond with the side chain of PD-1E136 (see below). These various interactions formed by the side chain of PD-L1Y123 and the high ΔΔG value of the PD-L1Y123A mutation demonstrate that PD-L1Y123 is a significant residue in the PD-1/PD-L1 interaction.
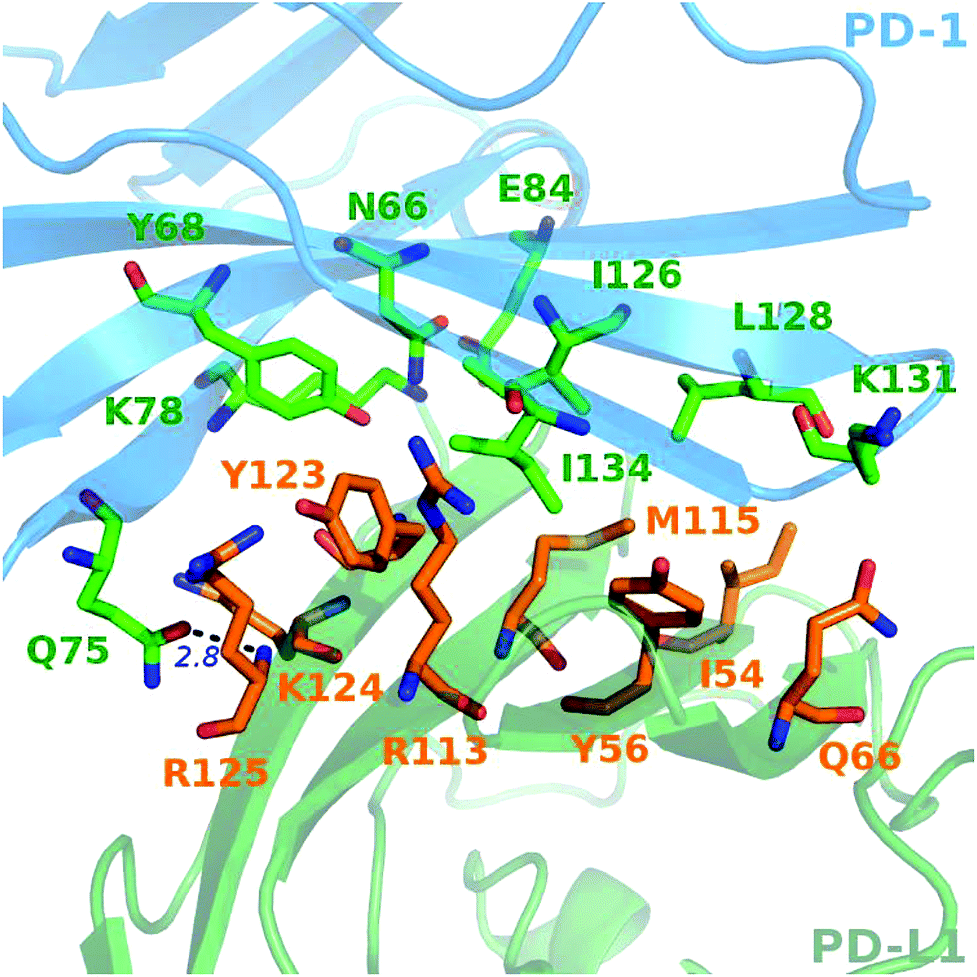 | ||
| Fig. 5 Close-up view of the hot and warm spots in the PD-1/PD-L1 interaction that predicted by the MM/GBSA/IE method. The hot spots of PD-1 (blue cartoon) and PD-L1 (green cartoon) are shown in sticks with carbon atoms colored in green and orange, respectively. | ||
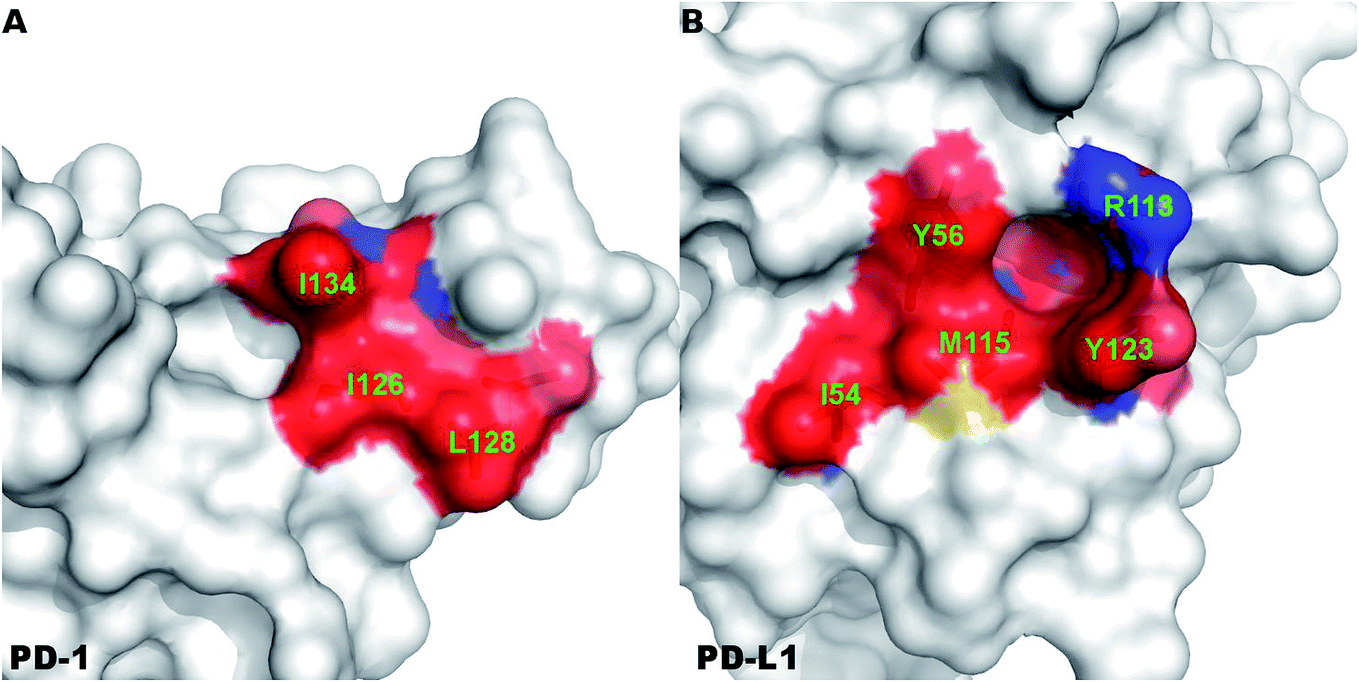 | ||
| Fig. 6 Surface representation of the hydrophobic core that formed by the hot and warm spots in the PD-1/PD-L1 interaction. The hot and warm spots that compose the hydrophobic core are colored surface and labeled in green font. | ||
The PD-L1Y56A mutation also leads to a large decrease of the binding free energy (over 4 kcal mol−1) since PD-L1Y56 interacts with PD-1I134 and PD-1A132 through the van der Waals interactions of its side chain (Fig. S2†). Therefore, PD-L1Y123, PD-L1Y56, and PD-L1M115 are the most important hot spots that constitute the hydrophobic pocket on PD-L1 to accommodate PD-1I134 (named I134 pocket) (Fig. 6B). In addition, the hot spot PD-L1R113 and warm spot PD-L1I54 interact directly with PD-1I134 and PD-1L128, respectively (Fig. 5). The computational alanine scanning shows the PD-L1R113A and PD-L1I54A mutations lead to smaller losses of the binding free energy (2.15 kcal mol−1 and 1.41 kcal mol−1). The warm spot PD-L1I54 is located at the edge of the hydrophobic region of PD-L1 and interacts with the side chain of PD-1L128 only (Fig. 5 and 6B). This can explain why the PD-L1I54A mutation causes a less loss of the binding free energy.
Besides the hydrophobic core hot spots, PD-1Q75 and PD-L1R125 interact through hydrogen bonds and side-chain van der Waals interactions (Fig. 7A). The energy components of the PD-1Q75A mutation indicate that both polar and nonpolar interactions are significant for its interaction with PD-L1 while the energy components of the PD-L1R125A mutation indicate that PD-L1R125 is dominated by nonpolar interactions (Fig. S2†). Hydrogen bond analysis shows that the side chain amine of PD-1Q75 forms a strong hydrogen bond with the backbone oxygen atom of PD-L1R125 with an occupancy of 90% and the side-chain carbonyl group of PD-1Q75 forms a relatively weaker hydrogen bond with the backbone nitrogen atom of PD-L1R125 with an occupancy of 51% (Table 3A). This can explain why the polar energy component is significant in the PD-1Q75A mutation. These two hydrogen bonds that formed by the two hot spots are stable during the MD simulations and the energy components of their alanine mutations show that the van der Waals interactions between their side chains are also significant. These results highlight the importance of PD-1Q75/PD-L1R125 interaction for the PD-1/PD-L1 binding.
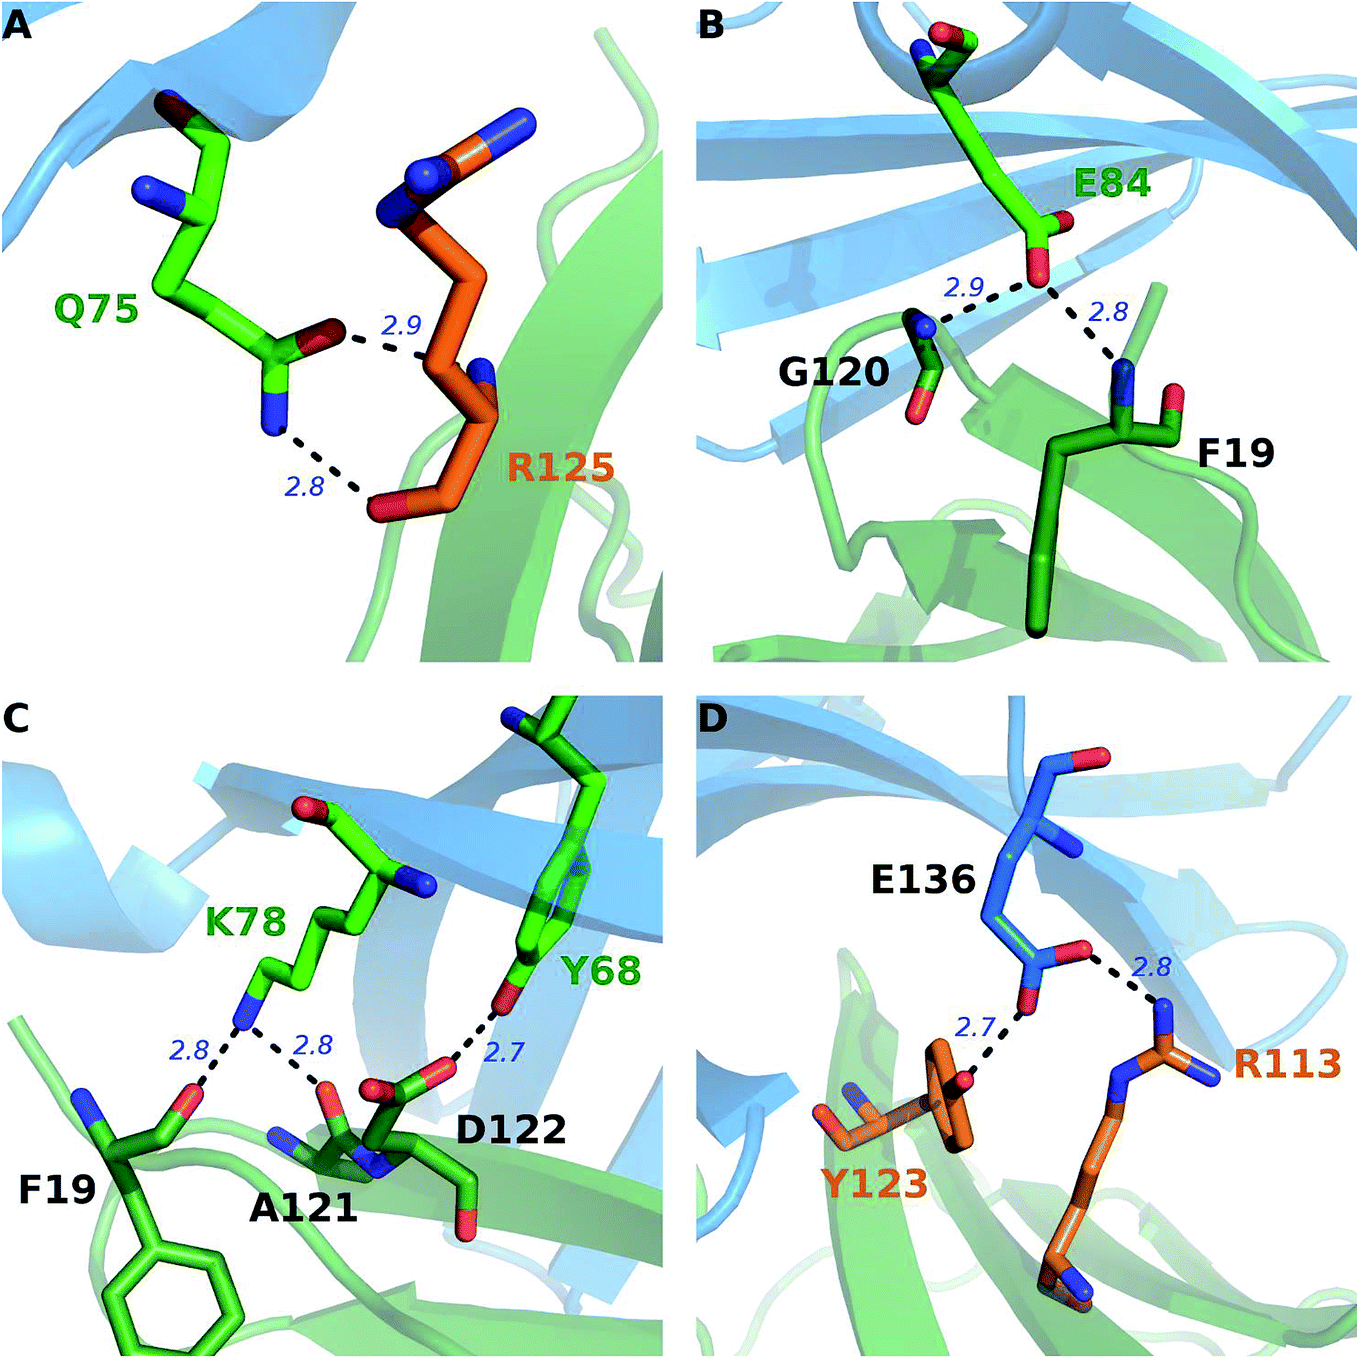 | ||
| Fig. 7 Stable hydrogen bonds in the interface of the PD-1/PD-L1 complex during the MD simulations. The hot spots of PD-1 (blue cartoon) and PD-L1 (green cartoon) are shown in sticks with carbon atoms colored in green and orange, respectively. | ||
| Acceptora | Donor | Occupancyb |
|---|---|---|
| a The salt bridge is labeled with *.b The hydrogen bonds are determined by the default criteria (angle of acceptor hydrogen donor atoms greater than 135° and distance of acceptor donor atoms less than 3.0 Å) in the CPPTRAJ module of the AMBER14 package. Only hydrogen bonds with occupancy ≥ 0.50 are listed. | ||
| (A) H–H | ||
| PD-L1R125@O | PD-1Q75@NE2 | 0.90 |
| PD-1Q75@OE1 | PD-L1R125@N | 0.51 |
|
||
| (B) H–NH | ||
| PD-1E84@OE | PD-L1F19@N | 0.69 |
| PD-1E84@OE | PD-L1G120@N | 0.64 |
|
||
| (C) NH–H | ||
| PD-L1D122@OD | PD-1Y68@OH | 0.98 |
| *PD-1E136@OE | PD-L1R113@NH | 0.94 |
| PD-L1F19@O | PD-1K78@NZ | 0.87 |
| PD-L1A121@O | PD-1K78@NZ | 0.80 |
| PD-1E136@OE | PD-L1Y123@OH | 0.79 |
| PD-L1D26@OD | PD-1Q75@NE2 | 0.78 |
| PD-L1A121@O | PD-1N66@ND2 | 0.68 |
|
||
| (D) NH–NH | ||
| PD-L1D26@OD | PD-1S73@OG | 0.57 |
Recently, Liu et al. studied the binding mechanism of the PD-1/PD-L1 interaction based on MD simulations.80 They found that both the open and closed conformations exist in apo-PD-1, and PD-L1 stabilizes the CC′ loop of PD-1 in the closed conformation and induces the structural rearrangement of the CC′ loop after binding. These results suggest a binding mechanism that involves both conformational selection and induced fit. Here, we can see that this binding mechanism is mainly controlled by the interaction between PD-1Q75 and PD-L1R125 because PD-1Q75 is located in the CC′ loop of PD-1 and is the most important hot spot in PD-1 (Fig. 4). In addition, it's evident that hot spots usually have smaller RMSF values (Fig. 3), meaning they are more stable residues in the PD-1/PD-L1 interaction.
3.3. Hydrogen bond analysis
Except for the hot spots (hydrophobic core hot spots, PD-1Q75, and PD-L1R125) that have been mentioned in the above section, our alanine scanning calculation predicts that some other polar and charged residues are also hot spots (PD-1E84, PD-1K78, PD-1N66, and PD-L1Q66) (Fig. 4 and 5). In order to obtain more information about their interactions, we performed an exhaustive hydrogen bond analysis between PD-1 and PD-L1 (Table 3). As shown in Table 3 and Fig. 5, the most important hydrogen bonds between PD-1 and PD-L1 are mainly formed by the polar and charged hot spots that around the hydrophobic core and some backbone atoms of null spots (ΔΔG less than 1.00 kcal mol−1) are also involved in the hydrogen bonds formation.For PD-1, the side-chain carboxyl group of the hot spot PD-1E84 forms two hydrogen bonds with the backbone nitrogen atoms of PD-L1F19 and PD-L1G120 (PD-1E84@OE⋯PD-L1F19@N; PD-1E84@OE⋯PD-L1G120@N) (Fig. 7B), and the side-chain amine group of the hot spot PD-1K78 forms two hydrogen bonds with the backbone carbonyl oxygen atom of PD-L1F19 and PD-L1A121 (PD-L1F19@O⋯PD-1K78@NZ; PD-L1A121@O⋯PD-1K78@NZ) (Fig. 7C). Additionally, the side-chain amine group of the hot spot PD-1N66 forms a hydrogen bond with the backbone carbonyl oxygen of PD-L1A121 (PD-L1A121@O⋯PD-1N66@ND2) (Table 3C). These five hydrogen bonds that formed by the side chains of the hot spots of PD-1 and the backbones of the null spots of PD-L1 are stable during the MD simulations (Table 3B and C). Indicating the side chain of these hot spots (PD-1E84, PD-1K78, and PD-1N66) are important for the stabilization of the PD-1/PD-L1 interaction. Moreover, the side-chain hydroxyl group of the hot spot PD-1Y68 forms a hydrogen bond with the side-chain carboxyl group of PD-L1D122 (PD-L1D122@OD⋯PD-1Y68@OH) (Fig. 7C and Table 3C). This hydrogen bond can stabilize the orientation of the side chain of PD-1Y68 while PD-1Y68 additionally takes part in a π–π interaction with PD-L1Y123 (Fig. 5). Although the side chain of PD-L1D122 participates in this hydrogen bond, it is a null spot and the ΔΔG value of its alanine mutation is 0.53 kcal mol−1 (Table S1†).
For PD-L1, the side chain guanidino group of the hot spot PD-L1R113 forms a stable salt bridge with the side-chain carboxyl group of PD-1E136 (*PD-1E136@OE⋯PD-L1R113@NH) (Fig. 7D and Table 3C). Besides this salt bridge, the hot spot PD-L1Y123 forms a relatively weak hydrogen bond with PD-1E136 (PD-1E136@OE⋯PD-L1Y123@OH) (Fig. 7D and Table 3C). Interestingly, PD-1E136 is a null spot although its side-chain atoms form a salt bridge and a hydrogen bond with the side chains of PD-L1R113 and PD-L1Y123, respectively (Table S1†). This is validated by some other hot spot detection methods (see below). The computational alanine scanning result shows the PD-1E136A mutation is favorable for the PD-1/PD-L1 interaction due to the benefits of van der Waals interactions and entropy contribution (Table S1†). Except these stable salt bridge and hydrogen bond interactions, many weaker hydrogen bonds and salt bridges (such as PD-1E84@OE⋯PD-L1A18@N; *PD-1E136@OE⋯PD-L1R113@NE; PD-L1Q66@OE1⋯PD-1A132@N; PD-1T76@O⋯PD-L1K124@NZ and PD-L1Y123@O⋯PD-1T76@OG1) (data not shown) that formed by the interface residues of PD-1 and PD-L1 should also contribute to the stabilization of the PD-1/PD-L1 interaction.
The hydrogen bond analysis shows that the polar and charged hot spots play an important role in the PD-1/PD-L1 interaction. The hydrogen bonds and salt bridges between the side chains of the hot spots and the backbones of the null spots form a stable hydrogen bond network around the hydrophobic core between PD-1 and PD-L1. These interactions, together with the hydrophobic interactions of the hydrophobic core, are responsible for the stable PD-1/PD-L1 interaction.
3.4. Hot spot detection using different methods
We have identified the hot spots in the PD-1/PD-L1 complex by using the computational alanine scanning and obtained some valuable information about their interactions. However, in silico alanine scanning approaches for hot spot detections are not perfect and false predictions may exist. To the best of our knowledge, the experimental alanine scanning of the PD-1/PD-L1 interaction has not been studied so far. Thus, there are no systemic experimental results that can be used to compare with our calculated results.In order to validate our hot spot predictions, we compared our predictions to those from some other hot spot detection methods. Up to now, a number of in silico methods have been developed and widely used to detect the hot spots in PPI interface.16–18,21–28,31–35 In this work, we used three knowledge-based methods (Robetta server, KFC server, and HotRegion database) for comparison.16,23,28,29 These methods are generally accurate for hot spot identification and relatively fast because they use simple scoring functions and a single protein–protein complex structure for hot spot prediction. However, they usually do not predict the binding free energy difference quantitatively like the MD-based computational alanine scanning methods.
The hot spots predicted by the four different methods are summarized in Table 4. As shown in Table 4, there are 7 (PD-1Y68, PD-1K78, PD-1I126, PD-1A132, PD-1I134, PD-1Q75, and PD-1L128) and 5 (PD-L1M115, PD-1A121, PD-L1Y56, PD-L1Y123, and PD-L1R113) hot spots on PD-1 and PD-L1, respectively, if we use the percentage value greater than 50% as the criterion of a hot spot. All these hot spots are correctly predicted by the MM/GBSA/IE method except the two alanine hot spots (PD-1A132 and PD-L1A121) which are not calculated by the MM/GBSA/IE method.
| Residue | Robetta servera | KFC server | HotRegion database | MM/GBSA/IE | Percentageb |
|---|---|---|---|---|---|
| a For the Robetta server, the residue is a hot spot if ΔΔG ≥ 1.0 kcal mol−1.b Percentage of hot spot predictions (%). Percentage = HP/NP, where HP is the number of hot spot predictions and NP is the number of predictions. Residues with the percentage greater than 0 are shown. | |||||
| (A) PD-1 | |||||
| Y68 | 1 | 1 | 1 | 1 | 100 |
| K78 | 1 | 1 | 1 | 1 | 100 |
| I126 | 1 | 1 | 1 | 1 | 100 |
| A132 | x | 1 | 1 | x | 100 |
| I134 | 1 | 1 | 1 | 1 | 100 |
| Q75 | 1 | 1 | 0 | 1 | 75 |
| L128 | 1 | 0 | 1 | 1 | 75 |
| N66 | 1 | 0 | 0 | 1 | 50 |
| T76 | 0 | 1 | 1 | 0 | 50 |
| G124 | x | 0 | 1 | x | 50 |
| E84 | 0 | 0 | x | 1 | 33 |
| V64 | 0 | 0 | 1 | 0 | 25 |
|
|||||
| (B) PD-L1 | |||||
| M115 | 1 | 1 | 1 | 1 | 100 |
| A121 | x | 1 | 1 | x | 100 |
| Y123 | 1 | 1 | 1 | 1 | 100 |
| Y56 | 1 | 1 | 0 | 1 | 75 |
| R113 | 1 | 0 | 1 | 1 | 75 |
| Q66 | 1 | 0 | 0 | 1 | 50 |
| D122 | 0 | 1 | 1 | 0 | 50 |
| K124 | 1 | 1 | 0 | 0 | 50 |
| R125 | 0 | 0 | 1 | 1 | 50 |
| E58 | 1 | 0 | x | 0 | 33 |
| N63 | 1 | 0 | x | 0 | 33 |
| F19 | 0 | 0 | 1 | 0 | 25 |
| V23 | 0 | 0 | 1 | 0 | 25 |
| I54 | 0 | 0 | 1 | 0 | 25 |
The percentage value of PD-1N66 is 50%, both the Robetta server and the MM/GBSA/IE method predict that it is a hot spot, but the KFC server and the HotRegion database predict that it is a null spot (Table 4). Thus, the status of PD-1N66 can't be determined currently. The percentage value of PD-1E84 is 33%, only the MM/GBSA/IE method predicts that it is a hot spot and the HotRegion database doesn't give a prediction for this residue. Actually, the distance of the two hydrogen bonds that formed by the side chain of PD-1E84 and the residues of PD-L1 (PD-L1G120 and PD-L1F19) is smaller than that in the crystal structure during the MD simulations (Fig. 8). This can explain the different results between the MM/GBSA/IE method and the other three methods because the MM/GBSA/IE method calculates ΔΔG according to the snapshots of MD trajectories and the other three methods identify hot spots based on a single X-ray crystal structure. For PD-L1, the result of PD-L1Q66 is the same as that of PD-1N66 (Table 4). Both the Robetta server and the MM/GBSA/IE method predict that it is a hot spot while the KFC server and the HotRegion database predict that it is a null spot. For PD-L1R125, both the Hotregion database and the MM/GBSA/IE method predict that it is a hot spot. But the Robetta server and the KFC server predict that it is a null spot. However, the guanidino group of the side chain of PD-L1R125 is missing in the X-ray crystal structure. Thus, the predictions of this residue that based on the crystal structure should be less reliable.
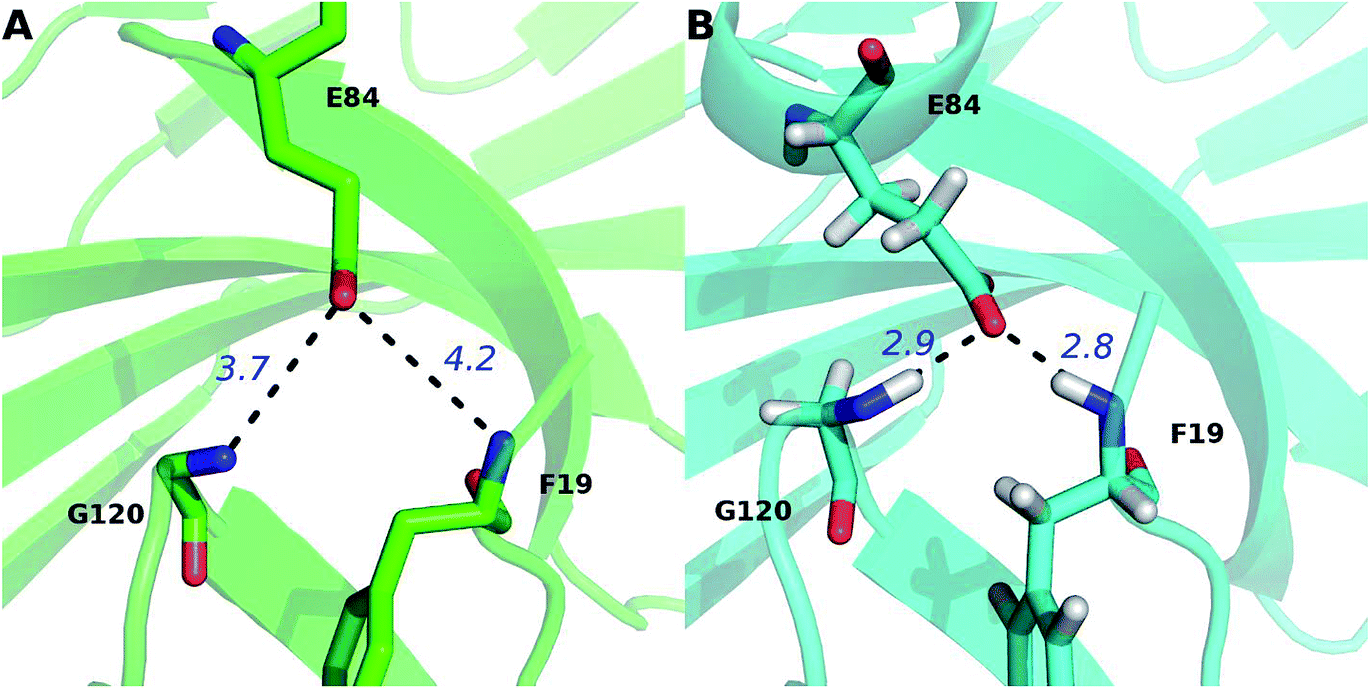 | ||
| Fig. 8 Comparison of the hydrogen bonds of PD-1E84 in the PDB (A) and MD equilibrated (B) structures. The hydrogen bonds between PD-1E84 and the two residues of PD-L1 (PD-L1G120 and PD-L1F19) are shown in dotted lines and their distances are labeled in blue font. | ||
Hydrogen bond analysis in the above section identified multiple hydrogen bonds stably formed by the side chain of PD-1E136 and the residues on PD-L1, but the computational alanine scanning based on the MM/GBSA/IE method identified PD-1E136 as a null spot. Here, the other three methods also predict that it is a null spot (it is not listed in Table 4 since its percentage value equals to zero). The hot spots predicted by the MM/GBSA/IE method are basically consistent with the other three methods. Combining with the predicted results of the other methods, we identified two additional hot spots (PD-1A132 and PD-L1A121) which could not be calculated by computational alanine scanning approaches (Fig. S3†). Fig. 9 is added for a direct comparison of the hot spots that predicted by these four methods.
 | ||
| Fig. 9 Comparison of the hot spots on PD-1 and PD-L1 that predicted by the four different methods. The hot spots that predicted by the Robetta server, KFC server, HotRegion database, and MM/GBSA/IE methods are shown in red, yellow, green, and blue bars, respectively. | ||
4. Conclusions
By using the MM/GBSA/IE method-based computational alanine scanning, we have quantitatively identified the hot spots in the PD-1/PD-L1 interaction. Briefly, the results of the computational alanine scanning revealed a shallow hydrophobic pocket on the surfaces of PD-1 and PD-L1, respectively. The hydrophobic pocket on PD-1 (M115 pocket) is formed by the hot spots PD-1I134, PD-1I126, and PD-1L128 which accommodates the hot spot PD-L1M115. And the hydrophobic pocket on PD-L1 (I134 pocket) is composed of the hot spots PD-L1Y123, PD-L1Y56, PD-L1M115, and PD-L1R113 which accommodates the hot spot PD-1I134. The residues of the two pockets, together with PD-1A132, PD-L1I54, and PD-L1A121, are tightly compacted to form a hydrophobic core in the interface of the PD-1/PD-L1 complex. The energy component analysis of the computational alanine scanning shows the PD-1/PD-L1 interaction is dominated by the van der Waals interactions of these hydrophobic hot spots. Thus, these hydrophobic residues are potential targets for designing inhibitors that disrupt the PD-1/PD-L1 interaction. Moreover, our result shows PD-1Q75 and PD-L1R125 are hot spots that have direct and stable hydrogen bonds and van der Waals interactions, which means their interactions are important for the PD-1/PD-L1 recognition and binding. This finding is consistent with some recent works.78,80In addition, the hydrogen bond analysis revealed a stable hydrogen bond network between PD-1 and PD-L1. This unique hydrogen bond network around the hydrophobic core is formed by the side chains of polar and charged hot spots and the backbone atoms of null spots. Rational design of inhibitors that targeting both the hydrophobic and hydrophilic hot spots could maximize the specificity and affinity to PD-1 or PD-L1. One interesting thing that we have found is PD-1E136 is a null spot even if its side chain forms multiple hydrogen bonds with PD-L1.
Moreover, we compared the hot spots identified by the MM/GBSA/IE method with other three hot spot detection methods. The hot spots predicted by the four methods are basically in agreement while some minor differences are discovered. Specifically, the different predictions of PD-1E84 between the MM/GBSA/IE method and the other three methods reveal a gap between the MD-based and crystal structure-based methods. One should keep in mind that the MD-based methods are not always more reliable. Because there are still many defects in the present mainstream force fields, especially for polar and charged residues which usually have significant polarization effects. By combing the results of different methods, we predicted the hot spots in the PD-1/PD-L1 interaction with more confidence and detected the alanine hot spots in the PD-1/PD-L1 interaction.
In a word, the hot spots determined in this study help us understand the complex binding mechanism of the PD-1/PD-L1 interaction. We hope that the current study provides useful guidance for the rational design of novel drugs for immune regulation.
Conflicts of interest
There are no conflicts of interest to declare.Acknowledgements
This work was supported by National Key R&D Program of China (Grant No. 2016YFA0501700), National Natural Science Foundation of China (Grant No. 21433004, 91753103), Shanghai Putuo District (Grant 2014-A-02), Innovation Program of Shanghai Municipal Education Commission (201701070005E00020), and NYU Global Seed Grant. JZ acknowledges the support of NYU-ECNU Center for Computational Chemistry at NYU Shanghai. We also thank the ECNU Public Platform for Innovation 001 for providing supercomputer time.References
- G. Sowmya, E. J. Breen and S. Ranganathan, Linking structural features of protein complexes and biological function, Protein Sci., 2015, 24(9), 1486–1494 CrossRef CAS PubMed.
- S. H. Yook, Z. N. Oltvai and A. L. Barabasi, Functional and topological characterization of protein interaction networks, Proteomics, 2004, 4(4), 928–942 CrossRef CAS PubMed.
- D. Eisenberg, E. M. Marcotte, I. Xenarios and T. O. Yeates, Protein function in the post-genomic era, Nature, 2000, 405(6788), 823–826 CrossRef CAS PubMed.
- A. A. Ivanov, F. R. Khuri and H. A. Fu, Targeting protein-protein interactions as an anticancer strategy, Trends Pharmacol. Sci., 2013, 34(7), 393–400 CrossRef CAS PubMed.
- D. P. Ryan and J. M. Matthews, Protein-protein interactions in human disease, Curr. Opin. Struct. Biol., 2005, 15(4), 441–446 CrossRef CAS PubMed.
- M. W. Gonzalez and M. G. Kann, Chapter 4: Protein Interactions and Disease, PLoS Comput. Biol., 2012, 8(12) CrossRef CAS PubMed.
- R. R. Halehalli and H. A. Nagarajaram, Molecular principles of human virus protein-protein interactions, Bioinformatics, 2015, 31(7), 1025–1033 CrossRef CAS PubMed.
- O. Keskin, B. Ma and R. Nussinov, Hot regions in protein--protein interactions: the organization and contribution of structurally conserved hot spot residues, J. Mol. Biol., 2005, 345(5), 1281–1294 CrossRef CAS PubMed.
- T. Clackson and J. A. Wells, A Hot-Spot of Binding-Energy in a Hormone-Receptor Interface, Science, 1995, 267(5196), 383–386 CrossRef CAS PubMed.
- A. A. Bogan and K. S. Thorn, Anatomy of hot spots in protein interfaces, J. Mol. Biol., 1998, 280(1), 1–9 CrossRef CAS PubMed.
- X. Li, O. Keskin, B. Y. Ma, R. Nussinov and J. Liang, Protein-protein interactions: hot spots and structurally conserved residues often locate in complemented pockets that pre-organized in the unbound states: implications for docking, J. Mol. Biol., 2004, 344(3), 781–795 CrossRef CAS PubMed.
- K. L. Morrison and G. A. Weiss, Combinatorial alanine-scanning, Curr. Opin. Chem. Biol., 2001, 5(3), 302–307 CrossRef CAS PubMed.
- I. S. Moreira, P. A. Fernandes and M. J. Ramos, Hot spots-a review of the protein-protein interface determinant amino-acid residues, Proteins, 2007, 68(4), 803–812 CrossRef CAS PubMed.
- I. Massova and P. A. Kollman, Computational alanine scanning to probe protein-protein interactions: a novel approach to evaluate binding free energies, J. Am. Chem. Soc., 1999, 121(36), 8133–8143 CrossRef CAS.
- S. Huo, I. Massova and P. A. Kollman, Computational alanine scanning of the 1:1 human growth hormone-receptor complex, J. Comput. Chem., 2002, 23(1), 15–27 CrossRef CAS PubMed.
- T. Kortemme, D. E. Kim and D. Baker, Computational alanine scanning of protein-protein interfaces, Sci. STKE, 2004, 2004(219), pl2 Search PubMed.
- I. S. Moreira, P. A. Fernandes and M. J. Ramos, Computational alanine scanning mutagenesis - an improved methodological approach, J. Comput. Chem., 2007, 28(3), 644–654 CrossRef CAS PubMed.
- S. A. Martins, M. A. S. Perez, I. S. Moreira, S. F. Sousa, M. J. Ramos and P. A. Fernandes, Computational Alanine Scanning Mutagenesis: MM-PBSA vs. TI, J. Chem. Theory Comput., 2013, 9(3), 1311–1319 CrossRef CAS PubMed.
- R. M. Ramos and I. S. Moreira, Computational Alanine Scanning Mutagenesis-An Improved Methodological Approach for Protein-DNA Complexes, J. Chem. Theory Comput., 2013, 9(9), 4243–4256 CrossRef CAS PubMed.
- M. Petukh, M. H. Li and E. Alexov, Predicting Binding Free Energy Change Caused by Point Mutations with Knowledge-Modified MM/PBSA Method, PLoS Comput. Biol., 2015, 11(7), e1004276 CrossRef PubMed.
- I. C. M. Simoes, I. P. D. Costa, J. T. S. Coimbra, M. J. Ramos and P. A. Fernandes, New Parameters for Higher Accuracy in the Computation of Binding Free Energy Differences upon Alanine Scanning Mutagenesis on Protein-Protein Interfaces, J. Chem. Inf. Model., 2017, 57(1), 60–72 CrossRef CAS PubMed.
- S. J. Darnell, D. Page and J. C. Mitchell, An automated decision-tree approach to predicting protein interaction hot spots, Proteins, 2007, 68(4), 813–823 CrossRef CAS PubMed.
- S. J. Darnell, L. LeGault, J. C. Mitchell and K. F. C. Server, Interactive forecasting of protein interaction hot spots, Nucleic Acids Res., 2008, 36, W265–W269 CrossRef CAS PubMed.
- K. I. Cho, D. Kim and D. Lee, A feature-based approach to modeling protein-protein interaction hot spots, Nucleic Acids Res., 2009, 37(8), 2672–2687 CrossRef CAS PubMed.
- N. Tuncbag, A. Gursoy and O. Keskin, Identification of computational hot spots in protein interfaces: combining solvent accessibility and inter-residue potentials improves the accuracy, Bioinformatics, 2009, 25(12), 1513–1520 CrossRef CAS PubMed.
- N. Tuncbag, O. Keskin and A. Gursoy, HotPoint: hot spot prediction server for protein interfaces, Nucleic Acids Res., 2010, 38, W402–W406 CrossRef CAS PubMed.
- J. F. Xia, X. M. Zhao, J. Song and D. S. Huang, APIS: accurate prediction of hot spots in protein interfaces by combining protrusion index with solvent accessibility, BMC Bioinf., 2010, 11, 174 CrossRef PubMed.
- X. Zhu and J. C. Mitchell, KFC2: a knowledge-based hot spot prediction method based on interface solvation, atomic density, and plasticity features, Proteins, 2011, 79(9), 2671–2683 CrossRef CAS PubMed.
- E. Cukuroglu, A. Gursoy and O. Keskin, HotRegion: a database of predicted hot spot clusters, Nucleic Acids Res., 2012, 40, D829–D833 CrossRef CAS PubMed.
- A. Shulman-Peleg, M. Shatsky, R. Nussinov and H. J. Wolfson, Spatial chemical conservation of hot spot interactions in protein-protein complexes, BMC Biol., 2007, 5, 43 CrossRef PubMed.
- E. Guney, N. Tuncbag, O. Keskin and A. Gursoy, HotSprint: database of computational hot spots in protein interfaces, Nucleic Acids Res., 2008, 36, D662–D666 CrossRef CAS PubMed.
- A. Pavelka, E. Chovancova and J. Damborsky, HotSpot Wizard: a web server for identification of hot spots in protein engineering, Nucleic Acids Res., 2009, 37, W376–W383 CrossRef CAS PubMed.
- D. M. Kruger and H. Gohlke, DrugScorePPI webserver: fast and accurate in silico alanine scanning for scoring protein-protein interactions, Nucleic Acids Res., 2010, 38, W480–W486 CrossRef PubMed.
- T. Geppert, B. Hoy, S. Wessler and G. Schneider, Context-Based Identification of Protein-Protein Interfaces and “Hot-Spot” Residues, Chem. Biol., 2011, 18(3), 344–353 CrossRef CAS PubMed.
- A. del Sol and P. O'Meara, Small-world network approach to identify key residues in protein-protein interaction, Proteins: Struct., Funct., Bioinf., 2005, 58(3), 672–682 CrossRef CAS PubMed.
- J. Y. Li and Q. Liu, Double water exclusion: a hypothesis refining the O-ring theory for the hot spots at protein interfaces, Bioinformatics, 2009, 25(6), 743–750 CrossRef CAS PubMed.
- N. Tuncbag, F. S. Salman, O. Keskin and A. Gursoy, Analysis and network representation of hotspots in protein interfaces using minimum cut trees, Proteins: Struct., Funct., Bioinf., 2010, 78(10), 2283–2294 CrossRef CAS PubMed.
- C. Pons, F. Glaser and J. Fernandez-Recio, Prediction of protein-binding areas by small-world residue networks and application to docking, BMC Bioinf., 2011, 12, 378 CrossRef CAS PubMed.
- T. L. Walunas, C. Y. Bakker and J. A. Bluestone, CTLA-4 ligation blocks CD28-dependent T cell activation, J. Exp. Med., 1996, 183(6), 2541–2550 CrossRef CAS PubMed.
- T. L. Walunas, D. J. Lenschow, C. Y. Bakker, P. S. Linsley, G. J. Freeman, J. M. Green, C. B. Thompson and J. A. Bluestone, CTLA-4 can function as a negative regulator of T cell activation, Immunity, 1994, 1(5), 405–413 CrossRef CAS.
- L. L. Carter, L. A. Fouser, J. Jussif, L. Fitz, B. Deng, C. R. Wood, M. Collins, T. Honjo, G. J. Freeman and B. M. Carreno, PD-1 : PD-L inhibitory pathway affects both CD4(+) and CD8(+) T cells and is overcome by IL-2, Eur. J. Immunol., 2002, 32(3), 634–643 CrossRef CAS PubMed.
- A. D. Salama, T. Chitnis, J. Imitola, H. Akiba, F. Tushima, M. Azuma, H. Yagita, M. H. Sayegh and S. J. Khoury, Critical role of the programmed death-1 (PD-1) pathway in regulation of experimental autoimmune encephalomyelitis, J. Exp. Med., 2003, 198(1), 71–78 CrossRef CAS PubMed.
- E. J. Wherry, T cell exhaustion, Nat. Immunol., 2011, 12(6), 492–499 CrossRef CAS PubMed.
- W. Zou and L. Chen, Inhibitory B7-family molecules in the tumour microenvironment, Nat. Rev. Immunol., 2008, 8(6), 467–477 CrossRef CAS PubMed.
- D. S. Vinay, E. P. Ryan, G. Pawelec, W. H. Talib, J. Stagg, E. Elkord, T. Lichtor, W. K. Decker, R. L. Whelan, H. Kumara, E. Signori, K. Honoki, A. G. Georgakilas, A. Amin, W. G. Helferich, C. S. Boosani, G. Guha, M. R. Ciriolo, S. Chen, S. I. Mohammed, A. S. Azmi, W. N. Keith, A. Bilsland, D. Bhakta, D. Halicka, H. Fujii, K. Aquilano, S. S. Ashraf, S. Nowsheen, X. Yang, B. K. Choi and B. S. Kwon, Immune evasion in cancer: mechanistic basis and therapeutic strategies, Semin. Canc. Biol., 2015, 35(suppl.), S185–S198 CrossRef PubMed.
- M. J. Butte, M. E. Keir, T. B. Phamduy, A. H. Sharpe and G. J. Freeman, Programmed death-1 ligand 1 interacts specifically with the B7-1 costimulatory molecule to inhibit T cell responses, Immunity, 2007, 27(1), 111–122 CrossRef CAS PubMed.
- H. Dong, S. E. Strome, D. R. Salomao, H. Tamura, F. Hirano, D. B. Flies, P. C. Roche, J. Lu, G. Zhu, K. Tamada, V. A. Lennon, E. Celis and L. Chen, Tumor-associated B7-H1 promotes T-cell apoptosis: a potential mechanism of immune evasion, Nat. Med., 2002, 8(8), 793–800 CrossRef CAS PubMed.
- C. Sun, R. Mezzadra and T. N. Schumacher, Regulation and Function of the PD-L1 Checkpoint, Immunity, 2018, 48(3), 434–452 CrossRef CAS PubMed.
- M. M. Zhan, X. Q. Hu, X. X. Liu, B. F. Ruan, J. Xu and C. Liao, From monoclonal antibodies to small molecules: the development of inhibitors targeting the PD-1/PD-L1 pathway, Drug Discov. Today, 2016, 21(6), 1027–1036 CrossRef CAS PubMed.
- T. Powles, J. P. Eder, G. D. Fine, F. S. Braiteh, Y. Loriot, C. Cruz, J. Bellmunt, H. A. Burris, D. P. Petrylak, S. L. Teng, X. Shen, Z. Boyd, P. S. Hegde, D. S. Chen and N. J. Vogelzang, MPDL3280A (anti-PD-L1) treatment leads to clinical activity in metastatic bladder cancer, Nature, 2014, 515(7528), 558–562 CrossRef CAS PubMed.
- S. L. Topalian, F. S. Hodi, J. R. Brahmer, S. N. Gettinger, D. C. Smith, D. F. McDermott, J. D. Powderly, R. D. Carvajal, J. A. Sosman, M. B. Atkins, P. D. Leming, D. R. Spigel, S. J. Antonia, L. Horn, C. G. Drake, D. M. Pardoll, L. Chen, W. H. Sharfman, R. A. Anders, J. M. Taube, T. L. McMiller, H. Xu, A. J. Korman, M. Jure-Kunkel, S. Agrawal, D. McDonald, G. D. Kollia, A. Gupta, J. M. Wigginton and M. Sznol, Safety, activity, and immune correlates of anti-PD-1 antibody in cancer, N. Engl. J. Med., 2012, 366(26), 2443–2454 CrossRef CAS PubMed.
- R. S. Herbst, J. C. Soria, M. Kowanetz, G. D. Fine, O. Hamid, M. S. Gordon, J. A. Sosman, D. F. McDermott, J. D. Powderly, S. N. Gettinger, H. E. K. Kohrt, L. Horn, D. P. Lawrence, S. Rost, M. Leabman, Y. Y. Xiao, A. Mokatrin, H. Koeppen, P. S. Hegde, I. Mellman, D. S. Chen and F. S. Hodi, Predictive correlates of response to the anti-PD-L1 antibody MPDL3280A in cancer patients, Nature, 2014, 515(7528), 563–567 CrossRef CAS PubMed.
- F. Zhang, H. Wei, X. Wang, Y. Bai, P. Wang, J. Wu, X. Jiang, Y. Wang, H. Cai, T. Xu and A. Zhou, Structural basis of a novel PD-L1 nanobody for immune checkpoint blockade, Cell Discov., 2017, 3, 17004 CrossRef PubMed.
- T. G. Phan, G. V. Long and R. A. Scolyer, Checkpoint inhibitors for cancer immunotherapy. Multiple checkpoints on the long road towards cancer immunotherapy, Immunol. Cell Biol., 2015, 93(4), 323–325 CrossRef CAS PubMed.
- S. L. Topalian, C. G. Drake and D. M. Pardoll, Targeting the PD-1/B7-H1(PD-L1) pathway to activate anti-tumor immunity, Curr. Opin. Immunol., 2012, 24(2), 207–212 CrossRef CAS PubMed.
- T. Zarganes-Tzitzikas, M. Konstantinidou, Y. Gao, D. Krzemien, K. Zak, G. Dubin, T. A. Holak and A. Domling, Inhibitors of programmed cell death 1 (PD-1): a patent review (2010-2015), Expert Opin. Ther. Pat., 2016, 26(9), 973–977 CrossRef CAS PubMed.
- B. R. Huck, L. Kotzner and K. Urbahns, Small Molecules Drive Big Improvements in Immuno-Oncology Therapies, Angew. Chem., Int. Ed. Engl., 2018, 57(16), 4412–4428 CrossRef CAS PubMed.
- Y. Han, Y. Gao, T. He, D. Wang, N. Guo, X. Zhang, S. Chen and H. Wang, PD-1/PD-L1 inhibitor screening of caffeoylquinic acid compounds using surface plasmon resonance spectroscopy, Anal. Biochem., 2018, 547, 52–56 CrossRef CAS PubMed.
- K. Guzik, K. M. Zak, P. Grudnik, K. Magiera, B. Musielak, R. Torner, L. Skalniak, A. Domling, G. Dubin and T. A. Holak, Small-Molecule Inhibitors of the Programmed Cell Death-1/Programmed Death-Ligand 1 (PD-1/PD-L1) Interaction via Transiently Induced Protein States and Dimerization of PD-L1, J. Med. Chem., 2017, 60(13), 5857–5867 CrossRef CAS PubMed.
- K. M. Zak, R. Kitel, S. Przetocka, P. Golik, K. Guzik, B. Musielak, A. Domling, G. Dubin and T. A. Holak, Structure of the Complex of Human Programmed Death 1, PD-1, and Its Ligand PD-L1, Structure, 2015, 23(12), 2341–2348 CrossRef CAS PubMed.
- Y. Chen, P. Liu, F. Gao, H. Cheng, J. Qi and G. F. Gao, A dimeric structure of PD-L1: functional units or evolutionary relics?, Protein Cell, 2010, 1(2), 153–160 CrossRef CAS.
- D. Y. W. Lin, Y. Tanaka, M. Iwasaki, A. G. Gittis, H. P. Su, B. Mikami, T. Okazaki, T. Honjo, N. Minato and D. N. Garboczi, The PD-1/PD-L1 complex resembles the antigen-binding Fv domains of antibodies and T cell receptors, Proc. Natl. Acad. Sci. U.S.A., 2008, 105(8), 3011–3016 CrossRef CAS PubMed.
- X. W. Zhang, J. C. D. Schwartz, X. L. Guo, S. Bhatia, E. H. Cao, L. P. Chen, Z. Y. Zhang, M. A. Edidin, S. G. Nathenson and S. C. Almo, Structural and functional analysis of the costimulatory receptor programmed death-1, Immunity, 2004, 20(3), 337–347 CrossRef CAS PubMed.
- Y. Yan, M. Yang, C. G. Ji and J. Z. H. Zhang, Interaction Entropy for Computational Alanine Scanning, J. Chem. Inf. Model., 2017, 57(5), 1112–1122 CrossRef CAS.
- L. Q. Qiu, Y. N. Yan, Z. X. Sun, J. N. Song and J. Z. H. Zhang, Interaction entropy for computational alanine scanning in protein-protein binding, Wiley Interdiscip. Rev.: Comput. Mol. Sci., 2018, 8(2), e1342 Search PubMed.
- L. Duan, X. Liu and J. Z. Zhang, Interaction Entropy: A New Paradigm for Highly Efficient and Reliable Computation of Protein-Ligand Binding Free Energy, J. Am. Chem. Soc., 2016, 138(17), 5722–5728 CrossRef CAS PubMed.
- D. Huang, Y. Qi, J. Song and J. Z. H. Zhang, Calculation of hot spots for protein-protein interaction in p53/PMI-MDM2/MDMX complexes, J. Comput. Chem., 2019, 40(9), 1045–1056 CrossRef CAS PubMed.
- A. Waterhouse, M. Bertoni, S. Bienert, G. Studer, G. Tauriello, R. Gumienny, F. T. Heer, T. A. P. de Beer, C. Rempfer, L. Bordoli, R. Lepore and T. Schwede, SWISS-MODEL: homology modelling of protein structures and complexes, Nucleic Acids Res., 2018, 46(W1), W296–W303 CrossRef CAS PubMed.
- D. A. Case, V. Babin, J. T. Berryman, R. M. Betz, Q. Cai, D. S. Cerutti, T. E. Cheatham, T. A. Darden, R. E. Duke, H. Gohlke, A. W. Goetz, S. Gusarov, N. Homeyer, P. Janowski, J. Kaus, I. Kolossváry, A. Kovalenko, T. S. Lee, S. LeGrand, T. Luchko, R. Luo, B. Madej, K. M. Merz, F. Paesani, D. R. Roe, A. Roitberg, C. Sagui, R. Salomon-Ferrer, G. Seabra, C. L. Simmerling, W. Smith, J. Swails, Walker, J. Wang, R. M. Wolf, X. Wu and P. A. Kollman, Amber 14, University of California, San Francisco, 2014 Search PubMed.
- W. L. Jorgensen, J. Chandrasekhar, J. D. Madura, R. W. Impey and M. L. Klein, Comparison of Simple Potential Functions for Simulating Liquid Water, J. Chem. Phys., 1983, 79(2), 926–935 CrossRef CAS.
- J. A. Maier, C. Martinez, K. Kasavajhala, L. Wickstrom, K. E. Hauser and C. Simmerling, ff14SB: Improving the Accuracy of Protein Side Chain and Backbone Parameters from ff99SB, J. Chem. Theory Comput., 2015, 11(8), 3696–3713 CrossRef CAS PubMed.
- T. Darden, D. York and L. Pedersen, Particle Mesh Ewald - an N.Log(N) Method for Ewald Sums in Large Systems, J. Chem. Phys., 1993, 98(12), 10089–10092 CrossRef CAS.
- J.-P. Ryckaert, G. Ciccotti and H. J. C. Berendsen, Numerical integration of the cartesian equations of motion of a system with constraints: molecular dynamics of n-alkanes, J. Comput. Phys., 1977, 23(3), 327–341 CrossRef CAS.
- R. Zwanzig, Nonlinear generalized Langevin equations, J. Stat. Phys., 1973, 9(3), 215–220 CrossRef.
- H. J. C. Berendsen, J. P. M. Postma, W. F. Vangunsteren, A. Dinola and J. R. Haak, Molecular-Dynamics with Coupling to an External Bath, J. Chem. Phys., 1984, 81(8), 3684–3690 CrossRef CAS.
- P. A. Kollman, I. Massova, C. Reyes, B. Kuhn, S. H. Huo, L. Chong, M. Lee, T. Lee, Y. Duan, W. Wang, O. Donini, P. Cieplak, J. Srinivasan, D. A. Case and T. E. Cheatham, Calculating structures and free energies of complex molecules: combining molecular mechanics and continuum models, Acc. Chem. Res., 2000, 33(12), 889–897 CrossRef CAS PubMed.
- J. Srinivasan, T. E. Cheatham, P. Cieplak, P. A. Kollman and D. A. Case, Continuum solvent studies of the stability of DNA, RNA, and phosphoramidate-DNA helices, J. Am. Chem. Soc., 1998, 120, 9401–9409 CrossRef CAS.
- D. Shi, S. Zhou, X. Liu, C. Zhao, H. Liu and X. Yao, Understanding the structural and energetic basis of PD-1 and monoclonal antibodies bound to PD-L1: A molecular modeling perspective, Biochim. Biophys. Acta, 2018, 1862(3), 576–588 CrossRef CAS.
- M. Ahmed and K. Barakat, The Too Many Faces of PD-L1: A Comprehensive Conformational Analysis Study, Biochemistry, 2017, 56(40), 5428–5439 CrossRef CAS PubMed.
- W. Liu, B. Huang, Y. Kuang and G. Liu, Molecular dynamics simulations elucidate conformational selection and induced fit mechanisms in the binding of PD-1 and PD-L1, Mol. Biosyst., 2017, 13(5), 892–900 RSC.
Footnote |
| † Electronic supplementary information (ESI) available: Detailed individual components of the protein–protein binding energies and some other details are provided. See DOI: 10.1039/c9ra01369e |
| This journal is © The Royal Society of Chemistry 2019 |