DOI:
10.1039/C9RA01173K
(Paper)
RSC Adv., 2019,
9, 18767-18775
Microstructural characterization and film-forming mechanism of a phosphate chemical conversion ceramic coating prepared on the surface of 2A12 aluminum alloy†
Received
15th February 2019
, Accepted 8th June 2019
First published on 14th June 2019
Abstract
Phosphate chemical conversion (PCC) ceramic coatings on the surface of 2A12 aluminum alloy substrate have been fabricated by a simple and inexpensive chemical conversion process in CrO3–NaF–H3PO4 solution. Microstructure characterization showed that the average diameter of micro-pores and the thickness of the PCC ceramic coating were about 50 nm and 4 μm, respectively, and the ceramic coating was compact and uniform when the conversion time was 60 min. Meanwhile, we found that the PCC ceramic coating mainly consisted of AlPO4, AlOOH, AlF3, and a few amorphous phases (CrPO4 and CrOOH) via EDS, XRD, XPS analyses. TG-DSC results indicated that the PCC ceramic coatings had excellent thermal stability. Significantly, the adhesion strength (178.55 N) between the PCC ceramic coatings and 2A12 Al substrate was remarkably improved owing to the strong chemical bond between the PCC ceramic coating and 2A12 Al substrate and the increase of surface roughness. Furthermore, a lower corrosion current density (1.382 × 10⁻⁷ A cm−2) and a higher corrosion inhibition efficiency (99.91%) confirmed that PCC ceramic coatings had fantastic corrosion resistance because of the presence of crystalline AlPO4/AlF3/AlOOH and amorphous CrPO4/CrOOH as a barrier layer. Additionally, a possible film-forming mechanism of the PCC ceramic coating was proposed during the chemical conversion process, which could be divided into four stages: dissolution of 2A12 aluminum substrate and hydrogen evolution; crystallization of insoluble phosphates and formation of an amorphous phase; growth of insoluble phosphates and dissolution of PCC ceramic coatings; growth and dissolution of PCC coatings to dynamic equilibrium.
1. Introduction
In recent years, the biggest challenge of the transportation industry is the ever-increasing demand to decrease air pollution and energy consumption. Light-weight transport is considered ideal to reduce carbon dioxide gas emissions and to enhance the fuel economy.1–3 In aerospace applications, owing to the low weight, high specific strength and better formability of aluminum (Al) alloys, they become the best candidate material to replace steel towards the development of a light-weight airplane. Especially, the 2A12 Al alloys have been widely used in various parts of the airplane, such as skin of the airplane, bulkhead of the airplane, wing ribs of the airplane, wing spars of the airplane, rivet of the airplane and so on, which is due to their low density, high fracture toughness and high thermal conductivity.4–10 Unfortunately, 2A12 Al alloys also have a few undesirable properties, such as low corrosion resistance and low wear resistance, which seriously impede their further applications, especially for outdoor applications.11–14 Therefore, in order to solve these problems, surface modification is necessary for the practical application of 2A12 Al alloys.
Surface modification is regarded as the most effective and straightforward approaches to protect Al alloys,15 which including anodic oxidation16,17 and micro-arc oxidation,18,19 thermal spraying,20,21 electroplating,22,23 ion implantation,24,25 electroless plating,26,27 magnetron sputtering,28,29 laser processing30,31 and chemical conversion treatment.32,33 Thereinto, chemical conversion treatment is considered as an ideal method, which shows advantages such as simple and suitability for the treatment of irregular surfaces.34–37 Moreover, chemical conversion treatment is not only economical, but also creates a useful protecting layer on the metal surface, which is required in some specially applications.
Chemical conversion coating is also called metal conversion coating, and it is an insoluble inorganic coating fabricated on the surface of steel,38 iron,39 magnesium,40 aluminum41 and their alloys via chemical conversion treatment without need for an additional electrical force and magnetomotive force. In recent decades, many scientists have focused on the formation mechanism of various types of chemical conversion coatings. Treverton and Davies42 first put up with a model of chromate-phosphate coatings in 1977. Shanmugam et al.1 reported that the growth mechanism of iron-manganese phosphate composite coatings formed on the aluminum surface was dissolution of Al and a subsequent deposition of coating. Golabadi et al.43 demonstrated that Ni2+ and Co2+ could increase the corrosion resistance of the phosphate coating. Nevertheless, although chemical conversion coating has been investigated for many years, the phosphate conversion coating with excellent microstructure, corrosion resistance and high temperature resistance has not been reported to date.
In this work, we have prepared phosphate chemical conversion (PCC) ceramic coating on the surface of 2A12 Al alloys via chemical conversion treatment. Moreover, the microstructure, elemental distribution, phase composition and thermal stability, adhesion strength and corrosion resistance of PCC ceramic coating were studied systematically. In addition, the formation mechanism of the ceramic coating was discussed in detail, which founded the basis for industrial production.
2. Experimental section
2.1 Materials and coating preparation
Square sample of 2A12 Al alloys of size 40 mm × 40 mm × 1 mm was used as substrate material in our experiment, which was purchased from Asia Metals Co. Ltd., Sichuan, China. The chemical composition of 2A12 Al alloys was listed in Table 1. Before the chemical conversion treatment, the sample was degreased with 50–70 g L−1 NaOH solution at 60 °C for 2 min, and then rinsed with deionized water immediately. Afterwards, the sample was immersed in 60–80 g L−1 HNO3 solution at room temperature for 2 min, followed by rinsing with deionized water immediately. After pretreatment process, the coating was prepared by immersing the samples in the conversion bath (3–6 g L−1 CrO3, 3–6 g L−1 NaF and 20–40 g L−1 H3PO4) at room temperature for 10 min, 30 min and 60 min, respectively, and then washed with hot deionized water at 45 °C for 1 min. Finally, sample aging via oven drying at 45 °C for 10 min prior to any characterizations and measurements. The schematic illustration of the fabrication process for PCC ceramic coating in different conversion time was shown in Fig. 1.
Table 1 The chemical composition of 2A12 Al alloys
| Elements |
Al |
Cu |
Mg |
Mn |
Si |
Zn |
Ti |
Ni |
| Content (wt%) |
Balance |
3.8–4.9 |
1.2–1.8 |
0.3–0.9 |
≤0.5 |
≤0.3 |
≤0.15 |
≤0.1 |
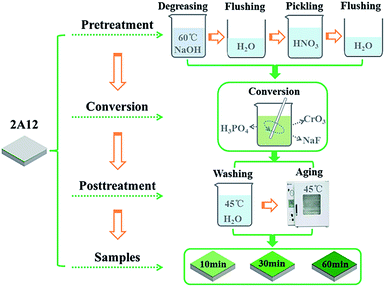 |
| | Fig. 1 Schematic illustration of the preparation process of PCC ceramic coatings. | |
2.2 Characterization and testing
The surface morphology and cross-sectional morphology of PCC ceramic coating were observed via field emission scanning electron microscope (FE-SEM, FEI Inspect F50). The elemental composition was analyzed using energy dispersive spectrometer (EDS, Octane super). Crystalline phase composition of PCC ceramic coating was examined by X-ray diffractometer (XRD, Bruker D8 Advance) using a Cu-Kα radiation (λ = 0.154184 nm), operated at 40 kV and 100 mA at a scanning speed of 4° per min from 20° to 80° of 2θ. Meanwhile, the chemical composition of PCC ceramic was performed via X-ray photoelectron spectroscopy (XPS, Escalab 250 Xi) using Al-Kα (1486.6 eV) as the source. The data were analyzed with XPSPEAK41 software. Furthermore, the thermal stability was studied via thermo gravimetric-differential scanning calorimetry (TG-DSC, STA 449C) at a heating rate of 10 °C min−1 from 30 °C to 800 °C in argon atmosphere.
2.3 Scratch test
Adhesion strength of PCC ceramic coating was determined using a single automatic scratch tester (WS-2005, Zhongke Kaihua Technology Development Co., Lanzhou, China) equipped with a diamond indenter (cone apex angle of 120° with a 200 mm tip radius). In the process of scratch test, the load was stepwise increased from 0 to 200 N at a loading rate of 100 N min−1, and the scratch length was 5 mm.
2.4 Electrochemical measurements
The electrochemical characteristic and corrosion resistance of PCC ceramic coating were evaluated via potentiodynamic polarization tests and electrochemical impedance spectroscopy (EIS) in 3.5 wt% NaCl aqueous solution using an electrochemical workstation with a conventional three-electrode cell. Thereinto, the sample with the exposure area of 1 cm2 was acted as work electrode, the saturated calomel electrode (SCE) was used as reference electrode and platinum (Pt) electrode was used as auxiliary electrode. The stable open circuit potentials (OCP) were acquired through immersing into NaCl solution for 30 min before the test. Whereafter, the potentiodynamic polarization curve was examined to obtain the corrosion potential (Ecorr) and corrosion current density (Icorr) at a scanning rate of 1 mV s−1 using extrapolation method. The EIS measurements were carried out with the sinusoidal perturbation amplitude of 20 mV and frequency range from 10−2 Hz to 105 Hz.
3. Results and discussion
3.1 Microstructure of PCC ceramic coatings
Fig. 2 presented the surface morphologies of PCC ceramic coatings on the surface of 2A12 Al alloys in different conversion times. Obviously, a large number of micro-cracks were formed on the PCC coatings surface of all samples. This was due to dehydration of PCC ceramic coatings during the aging process in post-treatment. Moreover, with the extension of conversion time, the micro-crack of PCC coating became smaller and more uniform. Compared with the ceramic coatings prepared in each stage, they have their own characteristics. As shown in Fig. 2A, PCC ceramic coating displayed “bark-like” surface morphology with a small number of flats formed on the partial activated sites of 2A12 Al substrate surface when sample was put in conversion solution for 10 min. After chemical conversion treatment for 30 min, the PCC coating showed a like dry-land structure which consisted with numerous micro-blocks (Fig. 2D) because of the growth of grains and the increased of new crystal nucleus. While prolonging the conversion time to 60 min, grain almost covered the whole Al substrate surface (Fig. 2G and H). Meanwhile, compared with coating formed with short conversion time (Fig. 2C and F), the ceramic coatings (Fig. 2I) fabricated with long conversion time were smoother and denser because of the increase of fine grains. In addition, lots of irregular nano-pores (about 50 nm) exist on the surface of ceramic coatings of each sample, because of hydrogen escaping. In fact, the growth mode of PCC ceramic coatings was nucleation-growth process, namely, insoluble phosphate crystals nucleated preferentially at defective locations such as grain boundaries and dislocations in the Al alloy (Fig. 2A), and then it spread around and growth (Fig. 2D), eventually the entire surface would be completely covered (Fig. 2G).
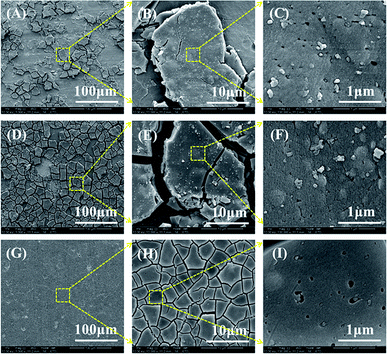 |
| | Fig. 2 Surface morphologies of PCC ceramic coatings on the surface of 2A12 Al alloys formed in different conversion times: 10 min (A–C), 30 min (D–F) and 60 min (G–I). | |
The cross-section morphologies of PCC ceramic coating prepared with different conversion times were presented in Fig. 3. It was observed that the thickness of PCC ceramic coatings increased gradually with the prolongation of conversion time, and the thickness of PCC coating was about 800 nm, 2 μm and 4 μm, respectively. Fig. 3A and D showed cross-section morphologies of PCC coating formed at 10 min, there were no micro-cracks between ceramic coating and Al substrate, and close integration each other. Cross-section morphologies of PCC coating prepared at 30 min (Fig. 3B and E) were rough, and the distribution of ceramic coating was very non-uniform. When the conversion time reached 60 min, PCC coating became more homogeneous (Fig. S1†). Besides, it could be seen that the ceramic coatings have a tendency of outward-inward bidirectional growth, which indicated that Al substrate was dissolved during the growth process of PCC ceramic coating.
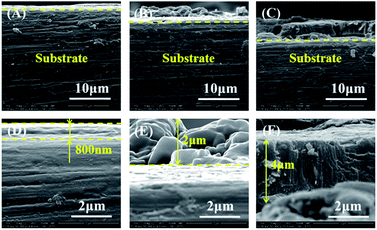 |
| | Fig. 3 Cross-section morphologies of PCC ceramic coatings prepared with different conversion time: 10 min (A and D), 30 min (B and E) and 60 min (C and F). | |
3.2 Chemical elements of PCC ceramic coatings
Fig. 4 showed energy dispersive spectra of PCC ceramic coatings with treatment of 60 min. The surface morphology of PCC ceramic coatings prepared at 60 min was shown in Fig. 4A. Meanwhile, it could be seen from the mapping-EDS of PCC coating (Fig. 4B–F) that compositions of PCC ceramic coating were mainly composed of O, Al, P, Cr and trace F elements. Moreover, the O, P, Cr and F elements distribute homogeneously on PCC ceramic coating surface. While Al was the main element in the substrate, which indicated that both substrate and oxidation solution promoted the formation of PCC ceramic coating.
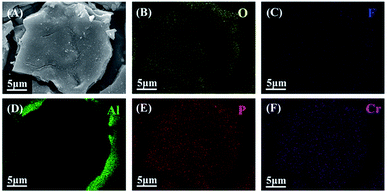 |
| | Fig. 4 (A) Surface morphology of PCC coatings with treatment of 60 min; (B)–(F) surface elemental mapping-EDS of O, F, Al, P, Cr elements of coated sample. | |
Cross-sectional morphology and lineal-EDS analysis of PCC coatings formed on 2A12 Al alloy were shown in Fig. 5. Apparently, PCC ceramic coating with thickness of about 4 μm was bonded well with the 2A12 Al substrate (Fig. 5A). Fig. 5B displayed cross-section lineal-EDS of O, F, Al, P and Cr elements of PCC coatings. It could be seen that all elements have some small random fluctuations. This phenomenon was attributed to the micro-pore in the coating. Furthermore, the content of Al element decreased gradually from Al substrate to the surface of PCC ceramic coating, which indicated that Al element was from 2A12 Al substrate. Moreover, the variation trend of O, P and Cr element was the same, namely, their first increased gradually, then stabilized and finally decreased gradually from Al substrate to the surface of PCC ceramic coating. This indicated that O, P and Cr elements were from conversion solution. In addition, F element existed only in trace amounts in the PCC coating, and it has little change from Al substrate to the surface of PCC ceramic coating.
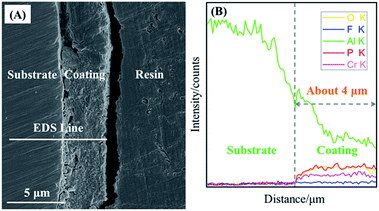 |
| | Fig. 5 (A) Cross-sectional morphology of PCC coatings prepared at 60 min and (B) cross-section lineal-EDS of O, F, Al, P and Cr elements of PCC coatings. | |
3.3 Chemical phases of PCC ceramic coatings
XRD patterns of the bare 2A12 Al alloy and PCC ceramic coatings (formed after 60 min treatments) were illustrated in Fig. 6. As could be seen, XRD patterns of bare 2A12 Al alloy and coated 2A12 Al alloy has obvious differences. For the bare 2A12 Al alloy (inset), only the diffraction peaks of Al were characterized, which because the naturally formed oxide film on the surface of 2A12 Al alloy substrate was too thin to be broken down to the Al substrate via X-ray. By comparison, the prominent diffraction peaks displayed that PCC ceramic coatings were mainly composed of Al, AlF3, AlOOH and AlPO4 phase. Diffraction peaks of Al phase were also detected owing to the porosity of PCC ceramic coatings. In the meantime, there was obvious amorphous phase in the XRD patterns of the ceramic coatings. This suggested that the ceramic coatings fabricated on the surface of 2A12 Al alloy had a low crystallinity or a thin coating thickness.
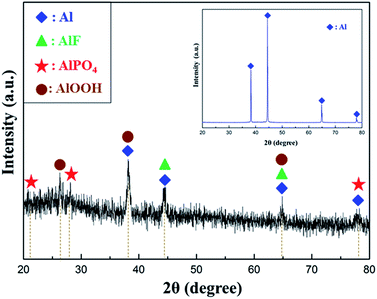 |
| | Fig. 6 XRD patterns of PCC ceramic coatings prepared on the surface of 2A12 Al alloy at 60 min (the inset was XRD patterns of 2A12 Al alloy substrate). | |
3.4 Chemical valence of PCC ceramic coatings
The elemental contents and chemical compositions of PCC ceramic coatings prepared on the surface of 2A12 Al alloy were further elucidated with XPS spectra. Fig. 7 displayed the full spectrum of PCC ceramic coating and high resolution spectra of each element. The full spectra (Fig. 7A) exhibited signals of C, O, F, Al, P and Cr. Thereinto, it was clear that C 1s (binding energy = 285.0 eV) peak could be found, for one thing, because the carbon was used as reference peak for other spectra; for another, it could also be ascribed to accidental contamination while transfer of the specimen in air.44,45 Other elements were consistent with the mapping-EDS (Fig. 4) and lineal-EDS results (Fig. 5). The atomic percent for O, F, Al, P and Cr in PCC ceramic coatings were obtained via XPS spectrum and shown in Table 2 (the extraneous carbon element was not included).
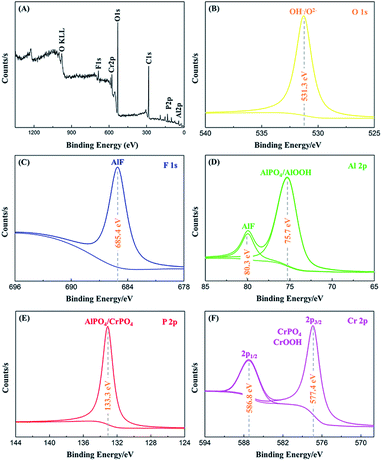 |
| | Fig. 7 XPS spectra of 2A12 Al alloys coated with PCC ceramic coating: (A) survey spectra and high resolution (B) O 1s, (C) F 1s, (D) Al 2p, (E) P 2p, (F) Cr 2p core level spectra. | |
Table 2 Elemental contents of PCC ceramic coatings prepared on the surface of 2A12 Al alloy obtained via XPS spectrum
| Elements |
Al |
O |
P |
Cr |
F |
| at% |
9.67 |
69.49 |
8.87 |
5.30 |
6.67 |
Fig. 7B showed the high resolution spectrum of oxygen, and the O 1s spectrum peak observed at 531.3 eV could be due to P–O of PO43− and O–H of OH−.46 The oxygen peak of metal oxide that appeared about 530 eV could not be found, which indicated that the absence of any metal oxides in PCC ceramic coating. Moreover, for the F 1s (Fig. 7C), only one peak could be observed at 685.4 eV, which attribute to AlF3.47 Fig. 7D showed the XPS spectra of Al 2p, where the peaks at 75.7 eV and 80.3 eV, which suggested the presence of Al3+ as in AlF3, AlOOH and AlPO4, respectively. Meanwhile, the symmetric P 2p peak could be detected at 133.3 eV, which was characteristic of PO43+.1 In addition, the Cr 2p spectra (Fig. 7F) displayed a nice resolve spin orbit doublet with two peaks (Cr 2p3/2 and Cr 2p1/2). The energy spacing between Cr 2p1/2 (586.8 eV) and Cr 2p3/2 (577.4 eV) was 9.4 eV, indicating the existence of chromate. For the Cr 2p3/2, the peak at 577.4 eV was ascribed to CrPO4 and CrOOH.48
3.5 Performance of PCC ceramic coatings
3.5.1 Thermal stability. The thermal stability of PCC ceramic coatings were investigated via TG-DSC. Fig. 8 demonstrated the TG-DSC curves of PCC ceramic coatings measured in Ar with a heating rate of 10 °C min−1. As it can be seen from TG-DSC curves, less weight loss indicated that PCC ceramic coatings had excellent thermal stability (Table S1†). For green curve (DTG), there were two peaks which indicated that PCC ceramic coatings have loss weight for twice. From the red curve (mass) in Fig. 8, it was clear that PCC ceramic coating had first weight loss of 10% from 30 °C to 110 °C, which attributed to the loss of crystalline water in PCC ceramic coatings. For the blue curve, DSC illustrated that this process was endothermic. Furthermore, PCC ceramic coating also exhibited second weight loss (about 18%) from 110 °C to 800 °C, which caused from the transition between amorphous crystalline or microcrystalline and crystalline,49 meantime, this also proved the existence of amorphous or microcrystalline in the PCC ceramic coatings.
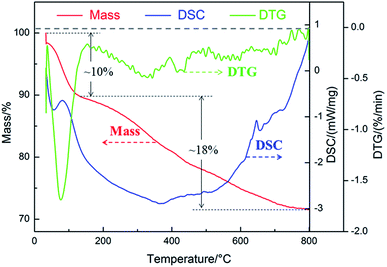 |
| | Fig. 8 TG-DSC curves in Ar of PCC ceramic coatings prepared on the surface of 2A12 Al alloy. | |
3.5.2 Adhesion strength. Fig. 9 showed the variation curves of acoustic emission intensity/loading force and surface scratch track morphology of PCC ceramic coatings after scratch test. The adhesion strength was evaluated via the critical load (LC) which is the loading force value of first sharp peak in scratch test curve. As shown in Fig. 9A, the critical load of PCC ceramic coatings was 178.55 N. Compared with critical load of other coatings,50–52 the PCC ceramic coating own the excellent adhesion strength (Table S2†), which could be explained as follows: in the first place, the AlPO4, AlF3 and AlOOH in PCC ceramic coating were bonding with Al substrate through strong chemical bond and physical means. In the second place, the alkaline etching in pretreatment process created a rougher surface was benefit for situ growth of PCC coating, which boosting the bond strength between coating and Al substrate. From Fig. 9B, with the increase of loading force, the scratch track of PCC ceramic coating became wider and deeper. Meanwhile, the microstructure of PCC ceramic coatings after scratch test was integrity and homogeneous, which could also ascribe to the excellent scratch resistance of PCC coating.
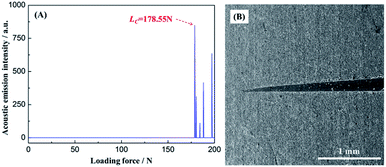 |
| | Fig. 9 Variation curves of acoustic emission intensity/loading force (A) and surface scratch track morphology of PCC ceramic coatings after scratch test (B). | |
3.5.3 Corrosion resistance.
(1) Potentiodynamic polarization. Fig. 10A displayed the potentiodynamic polarization curves of 2A12 Al substrate without and with PCC ceramic coatings in 3.5 wt% NaCl aqueous solution. It could be seen that the slope of anode branch was higher than that of cathode branch for all samples, which indicated that 2A12 Al substrate and PCC ceramic coatings were protected from the evolution of hydrogen reaction. For more clarification, the corrosion current density (Icorr), corrosion potential (Ecorr) and corrosion inhibition efficiency (η) were calculated using Tafel extrapolation method from the potentiodynamic polarization curves, and obtained data were tabulated in Table S3.† Obviously, the Icorr of 2A12 Al substrate and PCC ceramic coatings were 1.603 × 10⁻⁴ A cm−2 and 1.382 × 10⁻⁷ A cm−2, separately. Compared with 2A12 Al substrate, the Icorr of PCC ceramic coatings was three orders of magnitude smaller than that of 2A12 Al substrate, which revealed PCC ceramic coatings has lower corrosion rate. Moreover, it could be seen that the Ecorr of PCC ceramic coatings (−1.099 V) was more positive than that of 2A12 Al substrate (−1.264 V). The decrease of Icorr and increase of Ecorr of PCC ceramic coatings indicated the remarkable enhancement of anti-corrosion resistance of coatings owning to uniform and compact microstructure. What's more, corrosion inhibition efficiency (η) of PCC ceramic coating was calculated by eqn (1).53 Thereinto, where Icorrm and Icorrn were the corrosion current density of without and with PCC ceramic coating, respectively. It's worth noticing that η could reach as high as 99.91% which also indicated the excellent corrosion resistance performance of coating.| |
 | (1) |
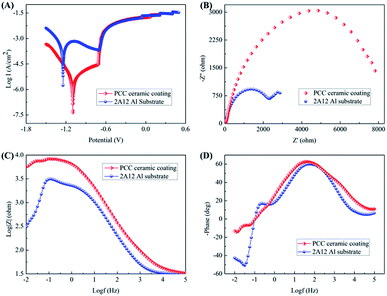 |
| | Fig. 10 Potentiodynamic polarization curves (A), Nyquist plot (B), Bode modulus (C) and phase (D) plots of 2A12 Al substrate without and with PCC ceramic coatings. | |
In general, it could be concluded that PCC ceramic coatings demonstrated a fantastic corrosion resistance performance. This phenomenon could be attributed to the existence of crystalline AlPO4/AlF3/AlOOH and amorphous CrPO4/CrOOH as barrier layer which provided an insulator between the external environment and 2A12 Al substrate. Moreover, amorphous phase without defects was not susceptible to corrosion, and CrOOH was easily decomposed into Cr2O3, which was also beneficial to enhance the corrosion resistance of PCC ceramic coating.
3.6 Film-forming mechanism of PCC ceramic coatings
The formation of PCC ceramic coatings was not only a chemical reaction, but also a sophisticated micro electrochemical reaction.37 Nevertheless, there was still no reasonable mechanism to explain PCC ceramic coatings formation process. In the present study, the film-forming mechanism of PCC ceramic coatings was investigated, the schematic illustration of the formation process of PCC coatings on 2A12 Al alloys samples surface was shown in Fig. 11. The growth process included the following four stages.
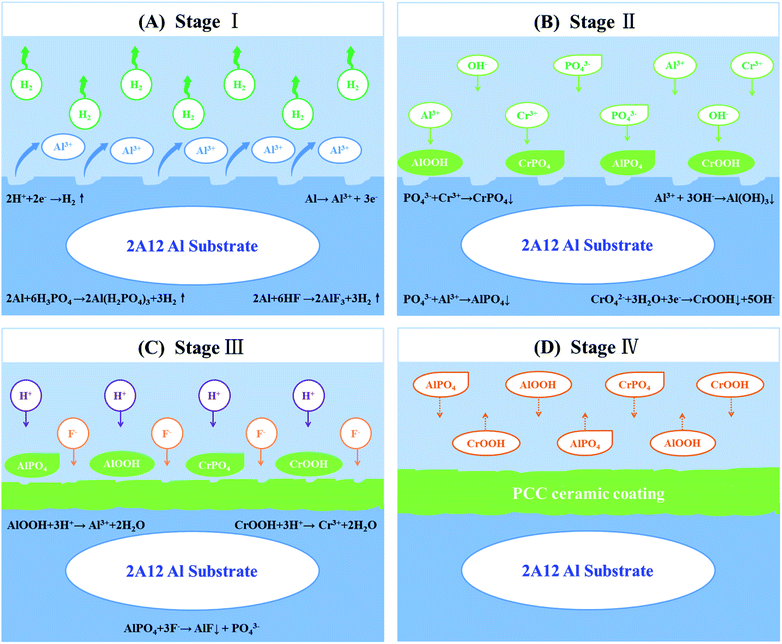 |
| | Fig. 11 Schematic illustration of the formation process of PCC ceramic coatings on 2A12 Al alloys samples. (A) Dissolution of 2A12 Al substrate and hydrogen evolution. (B) Crystallization of insoluble phosphates and formation of amorphous phase. (C) Growth of insoluble phosphates and dissolution of PCC ceramic coatings. (D) Growth and dissolution of PCC coatings to dynamic equilibrium. | |
Stage I: dissolution of 2A12 Al substrate and hydrogen evolution (Fig. 11A). In this stage, Al substrate and the oxide of aluminum surface were dissolved, which owing to the presence of phosphoric acid and hydrofluoric acid in the oxidation solution (eqn (2)–(5)). Simultaneously, this process was accompanied with the release of hydrogen (eqn (3) and (4)). This process could also be attributed to ionization of Al, H2O and H+ of micro electrochemical reaction, causing the dissolution of Al in the anode and hydrogen evolution from the cathode (eqn (6)–(8)).
| | |
NaF + H3PO4 → HF + NaH2PO4
| (2) |
| | |
2Al + 6H3PO4 → 2Al(H2PO4)3 + 3H2↑
| (3) |
| | |
2Al + 6HF → 2AlF3↓ + 3H2↑
| (4) |
| | |
Al2O3 + 6HF → 2AlF3↓ + 3H2O
| (5) |
| | |
2H2O + 2e− → H2↑ + 2OH−
| (8) |
Stage II: crystallization of insoluble phosphates and the formation of amorphous phase (Fig. 11B). With the dissolution of aluminum and consumption of hydrogen ions in the first stage, hydrogen ions in oxidation solution could not diffuse rapidly to the surface of Al substrate, thus the pH value of aluminum surface increased, which resulting in the formation of amorphous phase and crystal nuclei of insoluble phosphate (eqn (9)–(14)). Meanwhile, nuclei were more likely to form preferentially where defects (grain boundary and dislocation) occurred. In fact, amorphous phases were formed on the surface of Al substrate before the formation of insoluble phosphate nuclei.55 XRD patterns of PCC ceramic coatings with poor crystallinity (Fig. 6) could be proved the existence of amorphous phase. It was that the deposition rate of the amorphous phase was so fast that it could not be observed easily.
| | |
2CrO3 + H2O → H2Cr2O7
| (9) |
| | |
H2Cr2O7 + H2O → 2CrO42− + 4H+
| (10) |
| | |
CrO42− + 3H2O + 3e− → CrOOH↓ + 5OH−
| (11) |
| | |
Cr(OH)3 + H3PO4 → CrPO4↓ + 3H2O
| (12) |
| | |
Al3+ + PO43− → AlPO4↓
| (13) |
| | |
Al3+ + 3OH− → Al(OH)3↓
| (14) |
Stage III: growth of insoluble phosphates and dissolution of PCC ceramic coatings (Fig. 11C). With the prolongation of oxidation time, the insoluble phosphates grains grow up gradually, and new crystal nuclei of insoluble phosphate continuously formed on the Al substrate surface. However, fluoride ions could selectively dissolve aluminum phosphate to form aluminum fluoride, which leading to ceramic coating dissolution (eqn (15)). Besides, free-acids in the conversion solution also dissolved part of PCC ceramic coatings (eqn (16) and (17)).
| | |
AlPO4 + 3F− → AlF3↓ + PO43−
| (15) |
| | |
Al(OH)3 + 3H+ → Al3+ + 3H2O
| (16) |
| | |
CrOOH + 3H+ → Cr3+ + 2H2O
| (17) |
Stage IV: growth and dissolution of PCC coatings to dynamic equilibrium (Fig. 11D). During this period, both the partial dissolution of PCC coating and the formation and growth of new phosphate crystals were carried out simultaneously. Both crystallization dissolution and recrystallization dynamic reactions occurred in this process. As the reaction went on, the dissolution rate and recrystallization rate of phosphate crystals tend to be achieved dynamic equilibrium, the thickness of PCC coatings almost did not change, and PCC ceramic coatings were completely formed at this moment.
4. Conclusions
In summary, we have successfully fabricated PCC ceramic coatings with excellent microstructure, corrosion resistance and high temperature resistance on the surface of 2A12 Al substrate via a simple and low cost chemical conversion process. SEM results showed that PCC ceramic coating had a homogeneous and compact microstructure with a few nano-pores (∼50 nm). EDS results indicated that the coating was predominantly composed of Al, O, F, Cr and P element. XRD and XPS confirmed that the chemical composition of PCC coatings was AlPO4, AlOOH, AlF3 and some amorphous phases (CrPO4 and CrOOH). Meanwhile, we found that PCC ceramic coatings own excellent thermal stability by TG-DSC analysis. Besides, the coatings exhibited remarkable adhesion strength (178.55 N) due to the strong chemical bond between PCC ceramic coating and 2A12 Al substrate and the increase of surface roughness. And PCC ceramic coating could effectively boost the corrosion resistance of 2A12 Al substrate owing to the existence of crystalline AlPO4/AlF3/AlOOH and amorphous CrPO4/CrOOH as barrier layer. Additionally, the film-forming mechanism of PCC ceramic coatings on the surface of 2A12 Al substrate was discussed detailedly.
Conflicts of interest
There are no conflicts to declare.
Acknowledgements
This work was supported by the Chunhui Project of Education Ministry of China (No. Z2011074 and Z2015093). The Innovation Fund of Postgraduate of Xihua University (No. ycjj2018009). The Key Project of Natural Science Foundation of Sichuan Provincial Education Department (No. 16ZA0148), and the “Xihua Scholars” program of Xihua University (No. DC1900007152).
References
- S. Shanmugam, K. Ravichandran, T. S. N. S. Narayanan and M. H. Lee, RSC Adv., 2015, 5, 988–1008 RSC.
- R. Faria, P. Marques, P. Moura, F. Freire, J. Delgado and A. T. de Almeida, Renewable Sustainable Energy Rev., 2013, 24, 271–287 CrossRef.
- H. C. Kim and T. J. Wallington, Environ. Sci. Technol., 2013, 47(12), 6089–6097 CrossRef CAS PubMed.
- J. Y. Zhang, X. H. Shi and B. J. Fei, Int. J. Fatigue, 2012, 38, 144–154 CrossRef CAS.
- J. Yan, X. Y. Zeng, M. Gao, J. Lai and T. X. Lin, Appl. Surf. Sci., 2009, 255, 7307–7313 CrossRef CAS.
- Z. H. Zhang, W. Y. Li, J. F. Li and Y. J. Chao, Int. J. Adv. Manuf. Technol., 2014, 73, 1213–1218 CrossRef.
- Z. L. Liu, H. T. Cui, S. D. Ji, M. Q. Xu and X. C. Meng, J. Mater. Sci. Technol., 2016, 32, 1372–1377 CrossRef.
- Z. Y. Wang, T. Ma, W. Han and G. C. Yu, Trans. Nonferrous Met. Soc. China, 2007, 17, 326–334 CrossRef CAS.
- F. Yang, G. H. Wu, D. L. Sun and H. Shao, Mater. Sci. Eng., A, 2000, 280, 50–53 CrossRef.
- H. S. Gugtapeh, K. Jafarzadeh, Z. Valefi and S. M. Mirali, Surf. Coat. Technol., 2018, 349, 846–857 CrossRef.
- P. Wang, T. Wu, Y. T. Xiao, L. Zhang, J. Pu, W. J. Cao and X. M. Zhong, Vacuum, 2017, 142, 21–28 CrossRef CAS.
- M. Kaseem, Y. H. Lee and Y. G. Ko, Mater. Lett., 2016, 182, 260–263 CrossRef CAS.
- J. H. Wang, M. Hu. Du, F. Z. Han and J. Yang, Appl. Surf. Sci., 2014, 292, 658–664 CrossRef CAS.
- L. Wen, Y. M. Wang, Y. Jin, B. Liu, Y. Zhou and D. B. Sun, Surf. Coat. Technol., 2013, 228, 92–99 CrossRef CAS.
- H. Zhang, R. F. Luo, W. J. Li, J. Wang, M. F. Maitz, J. Wang, G. J. Wan, Y. Q. Chen, H. Sun, C. X. Jiang, R. Shen and N. Huang, Corros. Sci., 2015, 94, 305–315 CrossRef CAS.
- Y. Wang, L. D. Sun, C. J. Xiang, X. L. Zhao, S. J. Wu and S. Zhang, Corros. Sci., 2017, 124, 193–197 CrossRef CAS.
- S. Ide, Ö. Ö. Çapraz, P. Shrotriya and K. R. Hebert, Electrochim. Acta, 2017, 232, 303–309 CrossRef CAS.
- J. Wang, S. Huang, M. Y. He, P. H. Wangyang, Y. F. Lu, H. J. Huang and L. Xu, Ceram. Int., 2018, 44, 7656–7662 CrossRef CAS.
- P. Wang, T. Wu, Y. T. Xiao, J. Pu, X. Y. Guo, J. Huang and C. L. Xiang, J. Mater. Eng. Perform., 2016, 25, 3972–3976 CrossRef CAS.
- W. Tillmann, D. Kokalj and D. Stangier, Surf. Coat. Technol., 2018, 344, 223–232 CrossRef CAS.
- D. H. Zhang and D. J. Kong, J. Alloys Compd., 2018, 735, 1–12 CrossRef CAS.
- K. Hili, D. Fan, V. A. Guzenko and Y. Ekinci, Microelectron. Eng., 2015, 141, 122–128 CrossRef CAS.
- D. Crouse, J. Simon, K. L. Schulte, D. L. Young, A. J. Ptak and C. E. Packard, Thin Solid Films, 2018, 649, 154–159 CrossRef CAS.
- A. I. Ryabchikov, E. B. Kashkarov, N. S. Pushilina, M. S. Syrtanov, A. E. Shevelev, O. S. Korneva, A. N. Sutygina and A. M. Lider`, Appl. Surf. Sci., 2018, 439, 106–112 CrossRef CAS.
- Q. K. Jiang, C. L. Qin, K. Amiya, S. Nagata, A. Inoue, R. T. Zheng, G. A. Cheng, X. P. Nie and J. Z. Jiang, Intermetallics, 2008, 16, 225–229 CrossRef CAS.
- E. J. Bird, K. A. Nelson, J. N. Harb and D. R. Wheeler, Electrochim. Acta, 2012, 70, 69–75 CrossRef CAS.
- X. C. Ma, N. Lun and S. L. Wen, Diamond Relat. Mater., 2005, 14, 68–73 CrossRef CAS.
- Y. F. Liao, Q. Xie, Q. Q. Xiao, Q. Chen, M. H. Fan, J. Xie, J. Huang, J. M. Zhang, R. Ma, S. L. Wang, H. X. Wu and D. Fang, Appl. Surf. Sci., 2017, 403, 302–307 CrossRef CAS.
- H. J. Zheng, J. H. Zhong, W. Wang, Y. F. Zheng and C. N. Ma, Thin Solid Films, 2008, 516, 4983–4987 CrossRef CAS.
- A. Kouadri and L. Barrallier, Mater. Sci. Eng., A, 2006, 429, 11–17 CrossRef.
- A. Viswanathan, D. Sastikumar, H. Kumar and A. K. Nath, Opt. Laser Eng., 2012, 50, 1321–1329 CrossRef.
- R. C. Zeng, Y. Hu, F. Zhang, Y. D. Huang, Z. L. Wang, S. Q. Li and E. H. Han, Trans. Nonferrous Met. Soc. China, 2016, 26, 472–483 CrossRef CAS.
- G. Q. Duan, L. X. Yang, S. J. Liao, C. Y. Zhang, X. P. Lu, Y. G. Yang, B. Zhang, Y. Wei, T. Zhang, B. X. Yu, X. C. Zhang and F. H. Wang, Corros. Sci., 2018, 135, 197–206 CrossRef CAS.
- C. C. Jiang, G. Y. Xiao, X. Zhang, R. F. Zhu and Y. P. Lu, New J. Chem., 2016, 40, 1347–1353 RSC.
- H. Y. Su and C. S. Lin, Corros. Sci., 2014, 83, 137–146 CrossRef CAS.
- X. C. Zhao, G. Y. Xiao, X. Zhang, H. Y. Wang and Y. P. Lu, J. Phys. Chem. C, 2014, 118(4), 1910–1918 CrossRef CAS.
- B. Liu, G. Y. Xiao, C. C. Jiang, Y. Z. Zheng, L. L. Wang and Y. P. Lu, RSC Adv., 2016, 6, 75365–75375 RSC.
- X. Zhang, G. Y. Xiao, Y. Jiao, X. C. Zhao and Y. P. Lu, Surf. Coat. Technol., 2014, 240, 361–364 CrossRef CAS.
- H. Y. Chen, E. L. Zhang and K. Yang, Mater. Sci. Eng., C, 2014, 34, 201–206 CrossRef CAS PubMed.
- H. Zhao, S. Cai, Z. T. Ding, M. Zhang, Y. Li and G. H. Xu, RSC Adv., 2015, 5, 24586–24590 RSC.
- C. X. Zhang, Y. Y. Jia, X. Zhong, X. S. Wu and Y. L. Liu, RSC Adv., 2016, 6, 62045–62051 RSC.
- J. A. Treverton and N. C. Davies, Met. Technol., 1977, 4, 480–489 CrossRef CAS.
- M. Golabadi, M. Aliofkhazraei, M. Toorani and A. S. Rouhaghdam, J. Ind. Eng. Chem., 2017, 47, 154–168 CrossRef CAS.
- T. Lostak, A. Maljusch, B. Klink, S. Krebs, M. Kimpel, J. Flock, S. Schulz and W. Schuhmann, Electrochim. Acta, 2014, 137, 65–74 CrossRef CAS.
- M. Eslami, M. Fedel, G. Speranza, F. Deflorian, N. E. Andersson and C. Zanella, Electrochim. Acta, 2017, 255, 449–462 CrossRef CAS.
- Y. Chen, B. L. Luan, G. L. Song, Q. Yang, D. M. Kingston and F. Bensebaa, Surf. Coat. Technol., 2012, 210, 156–165 CrossRef CAS.
- A. E. Hughes, R. J. Taylor and B. R. W. Hinton, Surf. Interface Anal., 1997, 25, 223–234 CrossRef CAS.
- X. Zhang, W. G. Sloof, A. Hovestad, E. P. M. van Westing, H. Terryn and J. H. W. de Wit, Surf. Coat. Technol., 2005, 197, 168–176 CrossRef CAS.
- Y. F. Pan, X. Wang, S. B. Zhang, Y. Wang and J. T. Huang, Surf. Coat. Technol., 2016, 302, 131–141 CrossRef CAS.
- X. L. Shi, H. M. Zhu and A. Valanezhad, Phys. Status Solidi A, 2018, 215, 1800143 CrossRef.
- C. C. Jiang, G. Y. Xiao and X. Zhang, New J. Chem., 2016, 40, 1347–1353 RSC.
- S. X. Wang, X. H Liu and L. Q. Wang, RSC Adv., 2017, 7, 16078–16086 RSC.
- Y. Liu, S. Y. Li, J. J. Zhang, J. A. Liu, Z. W. Han and L. Q. Ren, Corros. Sci., 2015, 94, 190–196 CrossRef CAS.
- B. D. Mert, Corros. Sci., 2016, 103, 88–94 CrossRef.
- E. L. Ghali and R. J. A. Potvin, Corros. Sci., 1972, 12, 583–594 CrossRef CAS.
Footnote |
| † Electronic supplementary information (ESI) available. See DOI: 10.1039/c9ra01173k |
|
| This journal is © The Royal Society of Chemistry 2019 |
Click here to see how this site uses Cookies. View our privacy policy here.  Open Access Article
 *,
Xiaowei Wei,
Yuli Zhou,
Lijun Wang and
Jianjun Zhang


