 Open Access Article
Lignocellulosic hydrogen production using dark fermentation by Clostridium lentocellum strain Cel10 newly isolated from Ailuropoda melanoleuca excrement
Luyan Zhang ,
Yan Li,
Xianshu Liu,
Nanqi Ren and
Jie Ding*
State Key Laboratory of Urban Water Resource and Environment, School of Environmental, Harbin Institute of Technology, Harbin 150090, China. E-mail: dingjie123@hit.edu.cn; Fax: +86 451 86289113
First published on 9th April 2019
Abstract
Due to the characteristics of renewable and carbon-neutral, lignocellulose is considered to be one of the most potential, feasible, and ample resources for biofuel production on the Earth. However, the low energy conversion capacity of microorganisms is the primary bottleneck for utilizing lignocellulosic biomass to produce biofuel. In the present study, a mesophilic bacterial strain Cel10 identified as Clostridium lentocellum, according to 16S rRNA sequence homology, which can produce hydrogen from lignocellulose was isolated and characterized. The optimal conditions of hydrogen production from carboxymethylcellulose (CMC) are 37 °C, pH 7.0, and 5.0 g L−1. The H2 production peaked at 5.419 mmol H2 g−1 CMC under these conditions, which is relatively high compared to the other reported mesophilic bacteria that use cellulose as a substrate. Moreover, the H2-producing performance of strain Cel10 using cassava residues, a type of natural lignocellulosic feedstock, was also investigated. The results show that the hydrogen production peaked at 4.08 mmol H2 g−1 after 72 h of incubation, which is almost 1.2–3.8 times higher than the production of other mesophilic and thermophilic strains, while the highest cassava residues degradation rate reached 45.43%. The results validate that Clostridium lentocellum strain Cel10, newly isolated from Ailuropoda melanoleuca excrement, can offer a new method for directly converting lignocellulosic biomass to bio-hydrogen.
Introduction
In the past few decades, most countries have relied on fossil resources.1,2 However, this energy system, which depends on fossil fuels, can cause negative trends such as global warming, air pollution, and extreme weather phenomena.3–5 In view of this situation, an economically viable and sustainable clean energy system should be found and established to solve the crisis.6 Bio-hydrogen is an alternative and prospective clean energy source compared to conventional fossil resource utilization.7–9 Therefore, the utilization of wastes such as lignocellulosic biomass to produce bio-hydrogen has been developed worldwide.10Lignocellulosic biomass, in the forms of woods, plants, and other natural vegetation, is the second largest component on Earth.11 Over 200 billion tons of lignocellulosic biomass are produced worldwide every year, which has potential to be converted to biofuels, including bio-hydrogen.10,12 Bio-hydrogen production from lignocellulosic biomass can conform to the current energy demand and mitigate climate change.13,14
However, lignin possesses the drawback of difficult conversion of the cellulose and hemicellulose of lignocellulosic biomass into bio-hydrogen due to its resistance to biodegradation. Hence, several pre-treatments have been streamlined to ensure that lignocellulosic biomass can be broken down into oligosaccharides that can be more readily utilized by hydrogen-producing microbes.15 However, current pre-treatment methods based on acid, alkali or cellulase have conspicuous disadvantages, such as high consumption, strict conditions, time-consuming processes and formative fermentation inhibitors.16 A highly integrated one-step process named consolidated bioprocess (CBP) has been investigated for several years. During this process, specific bacteria can directly produce bio-hydrogen using the hydrolysates from the hydrolysis of lignocellulosic biomass by itself.17 Due to its benefits of low consumption and low demand for the pre-treatment of the lignocellulosic biomass, CBP has been identified as one of the feasible methods for lignocellulosic hydrogen production.18 Bio-hydrogen production requires more elaborate investigations, particularly in terms of discovering and isolating microbes that have the effective capability to directly produce H2 from lignocellulosic biomass. To date, a few microorganisms capable of producing hydrogen, which prefer oligosaccharides to cellulose, have been identified.15,19–21 Therefore, to make lignocellulosic hydrogen production competitive, more microorganisms that can produce lignocellulosic hydrogen without pre-treatment should be developed.
In the present study, a novel isolated mesophilic bacteria strain, Clostridium lentocellum Cel10, which can rapidly and efficiently convert lignocellulose to hydrogen was isolated and characterized. The main objective of the study was to validate that Clostridium lentocellum strain Cel10 can play an effective role in directly producing hydrogen from lignocellulosic biomass.
Experimental
Organisms and cultural conditions
An Ailuropoda melanoleuca excrement sample was obtained from Chengdu, Sichuan Province, China.22 To select spores from the hydrogen-producing bacteria and eliminate methanogenic bacteria, the excrement sample was pre-treated at 70 °C for 50 min. Then, 5 mL of the pre-treated excrement sample, as inoculum, was transferred to a 100 mL serum bottle with 50 mL enrichment medium (CMC was added as substrate to substitute glucose in ATCC 1191 medium) and incubated at 37 °C for 3 d. Then, the process was repeated 5 times with a fresh enrichment medium. Ten-fold serial dilutions of culture were spread on plates with the solid enrichment medium, which contained 2% agar and Congo red as a color developing agent; the plates were incubated at 37 °C for 3 d. The formed colonies, which formed decolorized hydrolytic cells, were then transferred to the fresh liquid enrichment medium. Repeated spread plating was necessary to ensure that the isolated colonies were pure. The purity was further verified by observation of the colony morphology, microscopic examination, and 16S rRNA gene sequencing, successively. The isolate with the highest H2 production potential from CMC was further tested with fermentation medium for H2 production. The composition of the fermentation medium was as follows (per liter): 5.0 g CMC, 2.0 g yeast extract, 0.5 g L-cysteine, 1.0 g (NH4)2SO4, 1.0 g NaCl, 1.5 g KH2PO4, 3.0 g K2HPO4·12H2O, 0.2 g MgSO4·6H2O, 0.2 g KCl, and 1 mL resazurin (0.2%), vitamin mixture, and trace element mixture.23 During the enrichment and cultivation, an anaerobic chamber (SHELLAB Products, Inc.) was employed. The atmosphere composition of the anaerobic chamber was N2, CO2 and H2 with the proportions of about 80%, 15% and 5%, respectively.Sequence analysis of the strain
Genomic DNA of the isolated strain was obtained using an Ezup Column Bacteria Genomic DNA Purification Kit (Sangon Biotech Co. Ltd., Shanghai, China). During polymerase chain reaction (PCR) amplification of the 16S rRNA sequence, two primers were designed: 7F (5′-CAGAGTTTGATCCTGGCT-3′) and 1540R (5′-AGGAGGTGATCCAGCCGCA-3′). The reaction mixture was composed of 2.5 μL 10× PCR buffer, 1.0 μL deoxynucleoside triphosphate (dNTP) (2.5 mmol L−1), 0.2 μL Taq DNA polymerase (2.5 U), 0.5 μL forward primer (10 μmol L−1), 0.5 μL reverse primer (10 μmol L−1), 0.5 μL template DNA (20 to 50 ng μL−1), and 19.8 μL double distilled water. The PCR steps were performed by a 2720 thermal cycler (Applied Biosystems, Foster City, USA). The thermal profile of the PCR was as follows: 4 min at 94 °C, 30 cycles of 45 s at 94 °C, 45 s at 55 °C, and 1 min at 72 °C. The amplified PCR product was purified and verified. After sequencing, which was performed by Sangon Biotechnologies, the sequence alignment was analyzed with the BLAST tool at the NCBI. According to the alignment results by ClustalX, a phylogenetic dendrogram was established with the MEGA program (version 6.0).24 Neighbor-joining (NJ) and 1000 replicates were selected as the parameters of the algorithm and bootstrap analysis.25Fermenting test with CMC
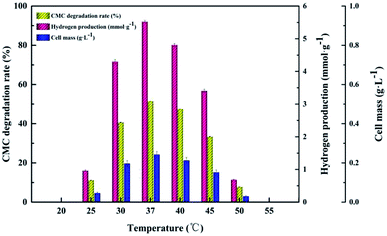
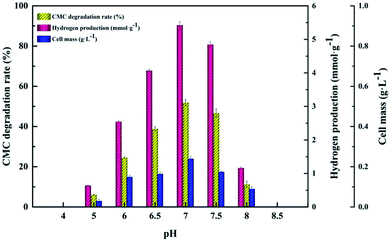
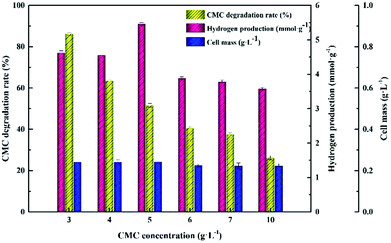
Strain Cel10 was tested in batch culture to acquire the optimum conditions (optimal pH, temperature, and CMC concentration) of hydrogen production using cellulose. The tested temperatures were 25 °C, 30 °C, 37 °C, 40 °C, 45 °C and 50 °C. The tested pH values were adjusted with sterile HCl or NaOH (1 mol L−1) and were 5.0, 6.0, 6.5, 7.0, 7.5, and 8.0. The tested CMC concentrations were 3.0, 4.0, 5.0, 6.0, 7.0 and 10.0 g L−1. During the tests, five test indexes, such as hydrogen production, liquid end products, cellulose degradation, cell biomass, and pH change, were estimated every 4 h.Tests with raw lignocellulosic materials
Four different raw lignocellulosic substrates, namely corn stalks (cellulose, 43.87 ± 0.31 wt%; hemicellulose, 27.52 ± 0.88 wt%; lignin, 23.65 ± 0.65 wt%; ash, 4.96 ± 0.43 wt%), cassava residues (cellulose, 47.61 ± 0.45 wt%; hemicellulose, 16.27 ± 0.90 wt%; lignin, 19.63 ± 0.38 wt%; ash, 5.47 ± 0.41 wt%), rice straw (cellulose, 49.27 ± 0.32 wt%; hemicellulose, 26.63 ± 0.98 wt%; lignin, 19.92 ± 0.87 wt%; ash, 4.18 ± 0.23 wt%), and corncob (cellulose, 40.66 ± 0.58 wt%; hemicellulose, 31.27 ± 0.57 wt%; lignin, 24.38 ± 0.75 wt%; ash, 3.69 ± 0.23 wt%) were selected to investigate hydrogen production by Clostridium lentocellum Cel10. Lignocellulosic biomass was chipped and screened to a diameter of 10–25 mm. Fermentation medium, which contained 5 g L−1 raw lignocellulosic substrate, was used for hydrogen production test. 10 mL inoculums were added to 100 mL medium and then maintained at 37 °C for 72 h. During the test, five test indexes, such as hydrogen production, liquid end products, cellulose degradation, cell biomass, and pH change, were estimated at 72 h.Cellulase activity of Clostridium lentocellum strain Cel10
The method described by Wood and Bhat26 was adopted to determine the total cellulase activity. Exo-glucanase activity, endo-glucanase activity, and β-1,4-glucosidase activity were assayed with a reaction mixture consisting 1.0 mL enzyme solution and 1.0 mL 1.0% corresponding substrate (CMC, Avicel cellulose, and salicin) in citrate acid buffer (0.05 mol L−1, pH 5.0). The samples were incubated at 60 °C during the reaction time of 60 min. Then, the release of reducing sugars was assayed at 540 nm by spectrophotometry. The amount of enzyme required to generate 1 μmol reducing sugar per minute was defined as the unit of enzymatic activity (IU). Each assay was performed in triplicate, and the mean was calculated for further analysis.Analyses
Bradford's method was adopted to determine the cell biomass.27 The method reported by Huang et al.28 was adopted to estimate the cellulose degradation rate. Gas collecting bags were used to collect the gas products for analysis. One gas chromatograph equipped with a thermal conductivity detector was used to measure the H2 content, while another gas chromatograph (7890A, Agilent Technologies, USA) with a flame ionization detector was used to measure residual volatile fatty acids (VFAs).29Results and discussion
Isolation and characterization of strain Cel10
Enrichment culture of Ailuropoda melanoleuca excrement was established in the CMC medium at pH 7.0 and 37 °C. A strain named Cel10 that can directly convert cellulose to hydrogen was isolated. The sequence analysis results showed that this strain belongs to the genus Clostridium. The phylogenetic analysis results indicated that Cel10 had a 98% sequence similarity to the sequence of Clostridium lentocellum DSM 5427 (Fig. 1). The physiological characteristics of Clostridium lentocellum Cel10 are shown in Table 1. Strain Cel10 cells are rod-shaped (0.5 μm by 3.0–5.0 μm), motile, have tufted flagella and belong to the strict anaerobic Gram-negative bacteria. Strain Cel10 can not only utilize common substrates, such as glucose, xylose, and fructose to produce H2, but can also hydrolyze other cellulosic materials, such as CMC and Avicel (Table 1).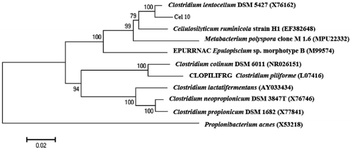 | ||
| Fig. 1 Phylogenetic relationships between Cel10 and other related species according to 16S rRNA gene sequence. | ||
| Feature | Resulta | Substrate utilization | Resulta |
|---|---|---|---|
| a + Positive; − negative. | |||
| Gram staining | — | Glucose | + |
| Xylose | + | ||
| Fructose | + | ||
| Arabinose | + | ||
| Galactose | + | ||
| Morphology | Short rod-shaped, spore | Maltose | + |
| Motility | + | Mannose | — |
| Anaerobic growth | + | Sucrose | + |
| Nitrate reduction | — | Xylan | + |
| Sulfate reduction | — | Cellobiose | + |
| Gelatin hydrolysis | — | Starch | + |
| Catalase test | — | CMC | + |
| Metabolic products with cellulose | Acetate, butyrate, ethanol, hydrogen, carbon dioxide | Avicel | + |
Effects of key factors on cellulosic hydrogen production using dark fermentation by strain Cel10
The CMC degradation and cell mass exhibited similar changing trends. The CMC degradation increased from 6.01 ± 0.12% to 51.90 ± 1.41% when the initial cultivation pH increased from 5.0 to 7.0, which is the maximum, and then decreased from 46.69 ± 2.05% to 11.24 ± 1.56% when the initial cultivation pH increased from 7.5 to 8.0. The maximum value of cell mass occurred at pH 7.0. Increase in the initial pH from 7.0 to 8.0 led to a decrease in the cell mass. This result is similar to those of Ahmad's and Sheng's,15,35 who found that a neutral initial cultivation pH range is usually optimal for hydrogen production. The use of different microorganism(s), fermentation conditions and substrates may lead to different reports of optimal cultivation initial pH for hydrogen production.36 Our findings indicate that proper control of the initial cultivation pH is crucial for increasing hydrogen production because a high or low initial cultivation pH can inhibit the activity of hydrogenase or change the corresponding metabolic pathway in the hydrogen fermentation process.16
Approximately 86.12 ± 0.56% CMC degradation was obtained at 3.0 g L−1, while CMC degradation decreased to 26.24 ± 0.92% at 10.0 g L−1. However, the cell mass remained stable at approximately 223 to 243 mg L−1 irrespective of how the CMC concentrations changed in the range of 3.0 g L−1 to 10.0 g L−1, which was inconsistent with the variation trend of cellulose degradation. Both the maximum hydrogen yield and cell concentration reached at a CMC concentration of 5.0 g L−1. In view of the above results, in the following tests, 5.0 g L−1 was set as the optimum CMC concentration.
Cellulose degradation and hydrogen production characteristics of strain Cel10 under optimal culture conditions
The kinetics of the cellulose degradation, hydrogen yield and cell mass at 5.0 g L−1 CMC, pH 7.0, and 37 °C over time during dark fermentation within 72 h were analyzed, as shown in Fig. 5. Strain Cel10 grew well during batch fermentation. It first showed a lag phase of about 12 h, then grew exponentially during 12–32 h, and finally reached the stationary phase during 32–48 h. The maximum cell concentration reached 0.243 ± 0.004 g L−1 at 36 h. Due to the fact that cellulose can be hydrolyzed in hot water, trace cellulose degradation was obtained before the test began.38 The cellulose concentration gradually decreased from 4.889 ± 0.03 g L−1 at 0 h to 2.405 ± 0.02 g L−1 at 36 h and remained nearly stable after 36 h due to the accumulation of inhibitory metabolites generated during dark fermentation39,40 or the consumption of some nutrients in the culture medium.41 The hydrogen production profile was consistent with the cellulose concentration. After an 8 h lag phase, hydrogen production began. The H2 production rate peaked at about 2.1 mmol h−1 L−1 at 28 h. Thereafter, the H2 production rate promptly decreased, while H2 accumulation gradually increased. The H2 production peaked at approximately 5.419 ± 0.04 mmol H2 g−1 CMC at 36 h and remained steady afterward. Unlike the hydrogen production and cellulose degradation, the cell mass concentration maximized earlier. This illustrates that the key factor to hydrogen production is not microorganism growth but the biological activity of the microorganism.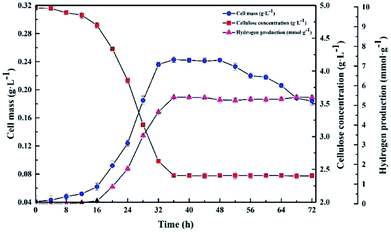 | ||
| Fig. 5 Kinetics of cellulose degradation, hydrogen yield and cell mass over time during dark fermentation within 72 h. | ||
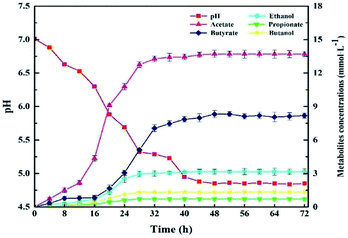
Fig. 6 presents the GC analysis about metabolites of Cel10 produced during dark fermentation. As displayed in Fig. 6, the main metabolite was acetate, followed by butyrate, ethanol, butanol, and propionate, which were produced and gradually increased up to 48 h. These results suggest that Cel10 can produce hydrogen though butyric-type fermentation because the ratio of butyrate to acetate reached about 1/2.42
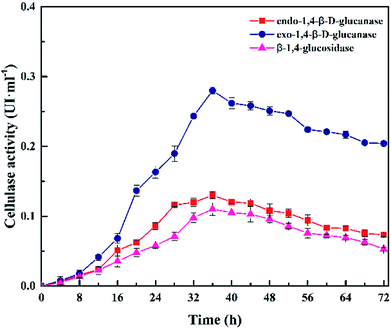
Fig. 7 presents the cellulase activity of Cel10 at 5.0 g·L−1 CMC, pH 7.0, 37 °C within 72 h. The cellulase activity was obtained after 4 h and gradually increased to a maximum at 36 h, then gradually decreased. The variation trend in the cellulase activity was in accord with the trends of the H2 production and cell mass. The cellulase activity peaked at 36 h, which contained 0.28 U exo-1,4-β-D-glucanase, 0.13 U endo-1,4-β-D-glucanase, and 0.11 U β-1,4-glucosidase. All the aforementioned results indicated that Clostridium lentocellum Cel10 exhibited good cellulose degradation and hydrogen production capacities (Table 2).
| Microbial species | Substrate | Concentration (g L−1) | Temperature (°C) | H2 yield (mmol g−1) | References |
|---|---|---|---|---|---|
| Clostridium cellulolyticum | Cellulose MN301 | 5.0 | 35 | 7.0 | 43 |
| Clostridium cellulolyticum | Microcrystalline cellulose | 5.0 | 35 | 6.2 | 43 |
| Clostridium acetobutylicum X9 | Microcrystalline cellulose | 10.0 | 37 | 3.0 | 44 |
| Clostridium populeti | Cellulose MN301 | 5.0 | 35 | 6.8 | 43 |
| Clostridium populeti | Microcrystalline cellulose | 5.0 | 35 | 5.9 | 43 |
| Clostridium termitidis CT1112 | α-Cellulose | 2.0 | 37 | 3.9 | 45 |
| Clostridium lentocellum Cel10 | CMC | 5.0 | 37 | 5.4 | This study |
Lignocellulosic hydrogen production by strain Cel10 using raw materials
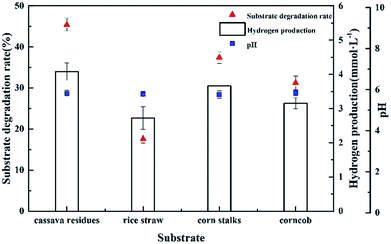
To measure the ability of Clostridium lentocellum to produce H2 from lignocellulose, four different natural lignocellulosic materials were selected as substrates, namely, cassava residues, rice straw, corn stalks, and corncob. In summary, the yields of H2 from the four substrates were comparable. The maximum H2 yield of strain Cel10 was 4.08 ± 0.25 mmol H2 g−1, which was obtained from cassava residues, followed by corn stalks, corncob, and rice straw (Fig. 8). Clostridium lentocellum Cel10 had the capacity to convert the carbohydrates in the raw lignocellulosic materials to H2. The hydrogen yield of strain Cel10 was higher than those of some mesophilic bacteria and even some thermophilic bacteria. These results indicated that the hydrogen yield of Clostridium lentocellum Cel10 from raw lignocellulosic materials is almost 1.2–3.8 times greater than those of other mesophilic and thermophilic strains (Table 3).| Microbial species | Substrate | Concentration (g L−1) | Temperature (°C) | H2 yield (mmol g−1) | References |
|---|---|---|---|---|---|
| Ruminococcus albus | Sweet sorghum | 3.0 | 37 | 2.7 | 46 |
| Clotridium butyricum | Steam-exploded corn straw | 5.0 | 35 | 3.0 | 47 |
| Clostridium thermocellum 7072 | Corn stalk | 20.0 | 55 | 2.76 | 48 |
| Thermoanaerobacterium thermosaccharolyticum M18 | Corn cob | 5.0 | 60 | 3.23 | 49 |
| Clostridium thermocellum 27405 | Dried distillers' grain | 5.0 | 60 | 1.07 | 50 |
| Caldicellulosiruptor saccharolyticus DSM 8903 | Wheat straw | 10.0 | 70 | 1.58 | 51 |
| Clostridium lentocellum Cel10 | Cassava residues | 5.0 | 37 | 4.08 | This study |
Conclusions
Clostridium lentocellum Cel10, a strictly anaerobic mesophilic bacterium, was isolated from Ailuropoda melanoleuca excrement, and then characterized by biochemical and molecular biological identification. Strain Cel10 could efficiently convert cellulose to hydrogen. The optimal dark fermentation conditions were determined to be 37 °C and pH 7.0 with 5.0 g L−1 CMC. Furthermore, the hydrogen productivity of strain Cel10 from cassava residues showed that the highest cassava residues degradation rate and hydrogen yield reached 45.43% and 4.08 mmol H2 g−1 after 72 h of incubation. In general, this strain offers a new and potentially useful method for direct hydrogen production from various lignocellulosic materials.Conflicts of interest
There are no conflicts to declare.Acknowledgements
Acknowledgements
This research was funded by the National Natural Science Fund of China, grant number 51778175, the HIT Environment and Ecology Innovation Special Funds, grant number HSCJ201612, the National Key R&D Plan, grant number 2016YFC0401105, the State Key Laboratory of Urban Water Resource and Environment (Harbin Institute of Technology), grant number 2012DX04 and the Provincial Nature Science Foundation of Heilongjiang, grant number E2016039.References
- E. Elbeshbishy, B. R. Dhar, G. Nakhla and H. S. Lee, Renewable Sustainable Energy Rev., 2017, 79, 656–668 CrossRef CAS.
- D. Kim, Molecules, 2018, 23, 309 CrossRef PubMed.
- J. Masset, M. Calusinska, C. Hamilton, S. Hiligsmann, B. Joris, A. Wilmotte and P. Thonart, Biotechnol. Biofuels, 2012, 5, 1–15 CrossRef PubMed.
- D. Kim, D. Orrego, E. A. Ximenes and M. R. Ladisch, Bioresour. Technol., 2017, 245, 511–517 CrossRef CAS PubMed.
- G. Cao, E. Ximenes, N. N. Nichols, S. E. Frazer, D. Kim, M. A. Cotta and M. Ladisch, Bioresour. Technol., 2015, 190, 412–415 CrossRef CAS PubMed.
- Y. Zheng, Z. Li, S. Feng, M. Lucas, G. Wu, Y. Li, C. Li and G. Jiang, Renewable Sustainable Energy Rev., 2010, 14, 3132–3139 CrossRef.
- S. Z. Baykara, Int. J. Hydrogen Energy, 2018, 43, 10605–10614 CrossRef CAS.
- P. Sivagurunathan, G. Kumar, P. Bakonyi, S. H. Kim, T. Kobayashi, K. Q. Xu, G. Lakner, G. Tóth, N. Nemestóthy and K. Bélafi-Bakó, Int. J. Hydrogen Energy, 2016, 41, 3820–3836 CrossRef CAS.
- J. H. Jo, D. S. Lee and J. M. Park, Biotechnol. Prog., 2006, 22, 431–437 CrossRef CAS PubMed.
- G. Kumar, P. Bakonyi, S. Periyasamy, S. H. Kim, N. Nemestóthy and K. Bélafi-Bakó, Renewable Sustainable Energy Rev., 2015, 44, 728–737 CrossRef CAS.
- M. Mora-Pale, L. Meli, T. V. Doherty, R. J. Linhardt and J. S. Dordick, Biotechnol. Bioeng., 2011, 108, 1229–1245 CrossRef CAS PubMed.
- A. Sharma and S. K. Arya, Biotechnology Reports, 2017, 15, 63–69 CrossRef PubMed.
- A. Wang, L. Gao, N. Ren, J. Xu, C. Liu, G. Cao, H. Yu, W. Liu, C. L. Hemme, Z. He and J. Zhou, Appl. Environ. Microbiol., 2011, 77, 517–523 CrossRef CAS PubMed.
- X. Liu, X. Wang, S. Yao, Y. Jiang, J. Guan and X. Mu, RSC Adv., 2014, 4, 49501–49520 RSC.
- T. Sheng, L. F. Gao, L. Zhao, W. Z. Liu and A. J. Wang, RSC Adv., 2015, 5, 99781–99788 RSC.
- J. N. Zhang, Y. H. Li, H. Q. Zheng, Y. T. Fan and H. W. Hou, Bioresour. Technol., 2015, 192, 60–67 CrossRef CAS PubMed.
- N. Q. Ren, L. Zhao, C. Chen, W. Q. Guo and G. L. Cao, Bioresour. Technol., 2016, 215, 92–99 CrossRef CAS PubMed.
- B. C. Saha, N. N. Nichols, N. Qureshi and M. A. Cotta, Appl. Microbiol. Biotechnol., 2011, 92, 865–874 CrossRef CAS PubMed.
- N. Q. Ren, G. L. Cao, W. Q. Guo, A. J. Wang, Y. H. Zhu and B. F. Liu, Int. J. Hydrogen Energy, 2010, 35, 2708–2712 CrossRef CAS.
- R. Islam, S. Özmihçi, N. Cicek, R. Sparling and D. B. Levin, Biomass Bioenergy, 2013, 48, 213–223 CrossRef CAS.
- C. Mamimin, A. Jehlee, S. Saelor, P. Prasertsan and O. Sompong, Int. J. Hydrogen Energy, 2016, 41, 21692–21701 CrossRef CAS.
- L. Y. Zhang, J. Ding, Y. Li, X. S. Liu, J. Y. Jiang and N. Q. Ren, J. Residuals Sci. Technol., 2016, 13, S227–S234 CrossRef CAS.
- E. A. Wolin, M. J. Wolin and R. S. Wolfe, J. Biol. Chem., 1963, 283, 2882–2886 Search PubMed.
- S. Kumar, K. Tamura and M. Nei, Briefings Bioinf., 2004, 5, 150–163 CrossRef CAS.
- J. Felsenstein, Evolution, 1985, 39, 783–791 CrossRef PubMed.
- T. M. Wood and K. M. Bhat, Methods Enzymol., 1988, 160, 87–112 CAS.
- M. M. Bradford, Anal. Biochem., 1976, 72, 248–254 CrossRef CAS PubMed.
- L. Huang, L. Gibbins and C. W. Forsberg, Appl. Environ. Microbiol., 1985, 50, 1043–1047 CAS.
- H. Y. Ren, B. F. Liu, F. Y. Kong, L. Zhao and N. Q. Ren, Water Res., 2015, 85, 404–412 CrossRef CAS PubMed.
- M. H. Hwang, N. J. Jang, S. H. Hyun and I. S. Kim, J. Biotechnol., 2004, 111, 297–309 CrossRef CAS PubMed.
- C. Zhao, O. Sompong, D. Karakashev, I. Angelidaki, W. Lu and H. Wang, Int. J. Hydrogen Energy, 2009, 34, 5657–5665 CrossRef CAS.
- J. Wang and W. Wan, Int. J. Hydrogen Energy, 2009, 34, 799–811 CrossRef CAS.
- H. H. P. Fang and H. Liu, Bioresour. Technol., 2002, 82, 87–93 CrossRef CAS PubMed.
- M. Ferchichi, E. Crabbe, G. H. Gil, W. Hintz and A. Almadidy, J. Biotechnol., 2005, 120, 402–409 CrossRef CAS PubMed.
- S. Ahmad Kamal, M. F. Mansor, J. Mohd Jahim and N. Anuar, Adv. Mater. Res., 2011, 236, 2987–2992 Search PubMed.
- D. H. Kim, S. H. Kim, K. W. Jung, M. S. Kim and H. S. Shin, Bioresour. Technol., 2011, 102, 8646–8652 CrossRef CAS PubMed.
- J. R. Mielenz, Curr. Opin. Microbiol., 2001, 4, 324–329 CrossRef CAS.
- M. Sasaki, B. Kabyemela, R. Malaluan, S. Hirose, N. Takeda, T. Adschiri and K. Arai, J. Supercrit. Fluids, 1998, 13, 261–268 CrossRef CAS.
- Y. Liu, P. Yu, X. Song and Y. B. Qu, Int. J. Hydrogen Energy, 2008, 33, 2927–2933 CrossRef CAS.
- I. Romano, L. Dipasquale, P. Orlando, L. Lama, G. d'Ippolito, J. Pascual and A. Gambacorta, Extremophiles, 2010, 14, 233–240 CrossRef CAS PubMed.
- L. R. Lynd, P. J. Weimer, W. H. van Zyl and I. S. Pretorius, Microbiol. Mol. Biol. Rev., 2002, 66, 506–577 CrossRef CAS PubMed.
- A. Cohen, R. Zoetemeyer, A. van Deursen and J. Van Andel, Water Res., 1979, 13, 571–580 CrossRef CAS.
- Z. Ren, T. E. Ward, B. E. Logan and J. M. Regan, J. Appl. Microbiol., 2007, 103, 2258–2266 CrossRef CAS PubMed.
- N. Q. Ren, A. J. Wang, L. F. Gao, L. Xin and D. J. Lee, Int. J. Hydrogen Energy, 2008, 33, 5250–5255 CrossRef CAS.
- U. Ramachandran, N. Wrana, N. Cicek, R. Sparling and D. B. Levina, Int. J. Hydrogen Energy, 2008, 33, 7006–7012 CrossRef CAS.
- I. Ntaikou, H. N. Gavalaa, M. Kornaros and G. Lyberatosa, Int. J. Hydrogen Energy, 2008, 33, 1153–1163 CrossRef CAS.
- D. M. Li and H. Z. Chen, Int. J. Hydrogen Energy, 2007, 32, 1742–1748 CrossRef CAS.
- X. Y. Cheng and C. Z. Liu, Bioresour. Technol., 2012, 104, 373–379 CrossRef CAS PubMed.
- G. L. Cao, L. Zhao, A. J. Wang, Z. Y. Wang and N. Q. Ren, Biotechnol. Biofuels, 2014, 7, 82 CrossRef PubMed.
- L. Magnusson, R. Islam, R. Sparling, D. Levin and N. Cicek, Int. J. Hydrogen Energy, 2008, 33, 5398–5403 CrossRef CAS.
- G. Ivanova, G. Rakhely and K. L. Kovacs, Int. J. Hydrogen Energy, 2009, 34, 3659–3670 CrossRef CAS.
| This journal is © The Royal Society of Chemistry 2019 |

