 Open Access Article
Effects of poly(ethylene glycol)-grafted graphene on the electrical properties of poly(lactic acid) nanocomposites
Kaibing Huang *a,
Han Yua,
Mei Xiea,
Shuai Liua and
Fenxia Wubc
aCollege of Materials Science and Engineering, Hunan University, Changsha 410082, PR China. E-mail: huangkaib8888@163.com
bChangsha Loyal Chemical Technology Company Limited, Changsha 410081, PR China
cHunan Engineering Research Center of Eco-friendly Water Based Adhesive Materials, Changsha 410081, PR China
First published on 4th April 2019
Abstract
Maleic anhydride was reacted with the armchair edges of graphene nanosheets (GN) via Diels–Alder reaction. Then, polyethylene glycol (PEG) was grafted onto the GN in the presence of anhydride groups through an esterification reaction. The PEG-grafted GN (PEG-g-GN) was characterised via FTIR analysis, thermogravimetric analysis, scanning electron microscopy, Raman spectroscopy and contact angle measurements, proving that PEG was successfully grafted onto the GN surface. The results indicated that PEG-g-GN possessed high electrical conductivity and was dispersed in polylactic acid (PLA). The composites were fabricated by using PEG-g-GN and GN as the conductive agent in the PLA matrix. Owing to the function of PEG molecular chains, PEG-g-GN can be uniformly dispersed in the PLA matrix and improve the tensile strength of composites to 59.46 MPa and conductivity to 9.69 × 10⁻⁴ S cm−1 at a PEG-g-GN content of 1 wt%.
Introduction
Conducting polymer composites (CPCs), which are extensively applied in the fields of sensors, batteries and memory materials, possess some significant properties such as high conductivity, light weight and good mechanical performance.1–4 CPCs contain an insulating polymer matrix and conductive fillers.5 The insulating polymer matrix of CPCs should have good physical and mechanical properties and also meet environmental protection requirements.6 Polylactic acid (PLA) is a potential replacement for traditional polymers in packaging, textiles, automotive composites and tissue engineering fields owing to its biodegradability, absorption and renewability.7,8 With the addition of nanofillers, PLA exhibits unique properties (e.g. electrical and thermal), which can be applied to some special applications.9,10 Ray and co-workers11 exhibited a novel method to improve the thermal conductivity and ductility of polylactide blend composites and presented the potential of graphene oxide-based filler for management applications.Graphene, a two-dimensional (2D) single-layer all-sp2-hybridisation carbon atom, has emerged as a promising electronic material because of its excellent electronic transport properties.12–15 However, agglomeration and low dispersion limited its application. Therefore, the modification of GN is particularly important. The Diels–Alder reaction is an excellent approach for carbon nanomaterials, such as GN and graphite, to obtain a variety of desirable functional groups on the surface. Unlike the modification of graphene oxide (GO),16,17 Diels–Alder reaction could not only render graphene possess high conductivity but also produce oxygen-containing groups on its surface. Haddon and co-workers18 demonstrated the dual behaviour concept of GN as either a diene or dienophile to realise the Diels–Alder reaction. Baek and co-worker19 investigated a solvent-free Diels–Alder reaction of graphite into functionalised GN. Siaj and colleagues20 used GO as a source of diene and maleic anhydride (MAH) as a dienophile to extend the Diels–Alder reaction.
MAH, which is comprehensively regarded as a modifying agent to be grafted onto different polymer chains, contains a double-bond and acid anhydride group.21,22 According to a recent research,18–20 maleic can be used as diene to react with GN via the Diels–Alder reaction. Moreover, Houk and co-workers23 predicted the sites of reaction in GN. However, the molecule chains of MAH are remarkably short which cannot completely inhibit the occurrence of the GN nanolayer aggregation in the composites.
Polyethylene glycol (PEG) is nontoxic, biocompatible and heat resistant, which can be used as dispersant and toughening agents. PEG shows a satisfying compatibility with PLA at a maximum loading of 30 wt%, which is regarded as useful a compatibilizer for PLA.24 Xu and co-workers25 synthesised poly-(ethylene glycol)-grafted graphene oxide (PEG-g-GO), which desirably dispersed in PLA because of the flexible PEG chains on the GO.
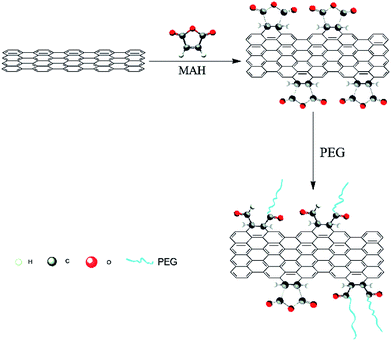
Thus, MAH was selected as a coupling agent in this study to react with GN via the Diels–Alder reaction, thereby rendering the surface of GN yield several desirable functional groups. According to a previous investigation,19,23 modifications are executed at the armchair edges of GN, but the basal plane cannot be modified. Then, PEG was selected to react with the modified GN through esterification reaction, as depicted in Scheme 1. The molecular chains of PEG on the surface of the modified GN cannot only prevent GN agglomeration but also provide good compatibility with PLA. Hence, the GN modified by PEG can possess excellent conductivity and improve composite properties.
Experimental
Materials
PLA (trade name 4032D) was purchased from NatureWorks Co. (USA). GN were acquired from Shenzhen Turing Evolutionary Technology Co. (Shenzhen, China). PEG with a number-average molecular weight of 800 g mol−1 was obtained from Tianjin Guangfu Fine Chemical Research Institute (Tianjin, China). MAH was procured from Sinopharm Chemical Reagent Co. (Shanghai, China). Except for the mentioned companies, all chemicals used have analytical grade and purchased from Tianjin Hengxing Chemical Reagent Co. (Tianjin, China).Synthesis of the PEG-grafted GN (PEG-g-GN)
Scheme 1 illustrates the fabrication procedure of PEG-g-GN. GN was added into N,N-dimethylformamide (DMF), forming a stable GN/DMF solution via ultrasonication. Then, the mixture was heated in the presence of an excess of MAH (200% w/w GN) at 100 °C for 24 h with dry nitrogen. After the reaction, PEG (n(PEG)![[thin space (1/6-em)]](https://www.rsc.org/images/entities/char_2009.gif) :
:![[thin space (1/6-em)]](https://www.rsc.org/images/entities/char_2009.gif) n(MAH) = 1
n(MAH) = 1![[thin space (1/6-em)]](https://www.rsc.org/images/entities/char_2009.gif) :
:![[thin space (1/6-em)]](https://www.rsc.org/images/entities/char_2009.gif) 1) was added. The mixture was reacted at 80 °C for 48 h through continuous stirring and then was poured into a beaker with ethanol and filtered with low pressure. Dissolution and filtration were repeated several times to remove free PEG, MAH and its polymer. The resultant product was dried at 50 °C in vacuum for future utilisation.
1) was added. The mixture was reacted at 80 °C for 48 h through continuous stirring and then was poured into a beaker with ethanol and filtered with low pressure. Dissolution and filtration were repeated several times to remove free PEG, MAH and its polymer. The resultant product was dried at 50 °C in vacuum for future utilisation.
Preparation of the PEG-g-GN/PLA nanocomposites
PLA powder was blended with PEG-g-GN and GN through constant stirring in a planetary muller until it is thoroughly mixed. PEG-g-GN and GN were added in various concentrations (i.e. 0, 0.3, 0.5, 1 and 2 wt% relative to the composites) before mixing. The mixture of composite powder was used to prepare standard splines for mechanical performance testing using an injection moulding machine. Regarding electrical conductivity, the blend was dispersed in a 10 mL solution of dichloromethane via ultrasonication for 10 min at room temperature to produce a 0.2 g mL−1 mixture solution. Then, the resulting mixtures were coated evenly on an iron plate and dried in an ambient temperature and pressure for 24 h in a fume cupboard.Characterization
The chemical structures of PEG-g-GN and GN were characterised using the Bruker Tensor 27 FTIR spectrometer (Bruker, Karlsruhe, Germany). The samples were scanned from 400 to 4000 cm−1.To determine their structures, the Raman spectra of GN and PEG-g-GN were recorded from 1000 to 3000 cm−1 on Alpha 300 Raman (WITec, Ulm, Germany) using a 532 nm argon ion laser. GN powders were dispersed in ethanol for 30 min via ultrasonication. The solution was poured on the silicon wafer and was dried in an ambient temperature to obtain the samples.
The thermal stability of the samples was investigated through thermogravimetric analysis (STA449F5; NETZSCH, Bavaria, Germany) at a heating rate of 10 °C min−1 from room temperature to 600 °C in an argon atmosphere.
The surfaces of the samples were investigated using the Hitachi S480 scanning electron microscope (SEM; Hitachi, Tokyo, Japan). The samples were coated with a fine gold layer and examined at an accelerating voltage of 5 kV.
Measurements of water contact angle were performed at a room temperature with deionised water using a contact angle goniometer (SDC-200; Sindin Precision Instrument Co., Dongwan, China).
The dispersion of GN in the PLA matrix was recorded suing a polarising microscope (BX-51; Olympus, Japan).
Tensile tests were performed by utilising a universal testing machine (WDW-5E; Jinan Shijin Group, Jinan, China). The standard splines were prepared through injection moulding (WZS10; Shanghai Xinshuo Precision Machinery Co., Shanghai, China). The initial grip separation was 50 mm, and the elongation speed was 5 mm min−1. Tensile strength is defined as the maximum tensile stress sustained by the test specimen just prior to fracture. Elongation at break or fracture strain (ε) is expressed as the percentage of change in the original length of the specimen. The values of maximum tensile stress and elongation at break shown are the means of at least three replicates.
Electrical conductivity was by assessed using a four-probe conductivity meter (ST-2258C; Suzhou Jingge Electronic Co., Suzhou, China). The samples were cut into square-shaped pieces of 10 × 10 mm. The sample thickness was measured with a precision of 0.001 mm using a coating pachometer (DT-156; China Everbest Machinery Industry Co., Shenzhen, China). Moreover, the average value was calculated by measuring the thickness of four different film spots.
Results and discussion
Structure analysis
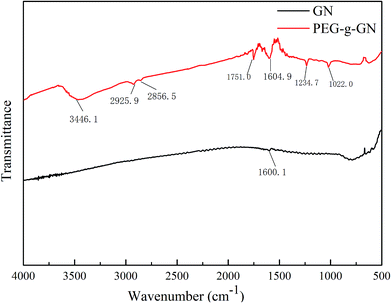
Fig. 1 depicts the comparison of FTIR spectra between GN and PEG-g-GN. In the GN spectrum, the stretching vibration of aromatic C![[double bond, length as m-dash]](https://www.rsc.org/images/entities/char_e001.gif) C bonds is at 1600 cm−1.26 After the MAH and PEG reaction, a wide peak appeared at 3446.1 cm−1 corresponding to the stretching vibration of hydroxyl groups. The asymmetrical and symmetrical stretching vibrations of C–H in CH2 bonds were observed at 2925.9 and 2856.5 cm−1, which belong to the PEG molecular chains. The peaks at 1751, 1234.7 and 1022 cm−1 were attributed to the stretching vibration of C
C bonds is at 1600 cm−1.26 After the MAH and PEG reaction, a wide peak appeared at 3446.1 cm−1 corresponding to the stretching vibration of hydroxyl groups. The asymmetrical and symmetrical stretching vibrations of C–H in CH2 bonds were observed at 2925.9 and 2856.5 cm−1, which belong to the PEG molecular chains. The peaks at 1751, 1234.7 and 1022 cm−1 were attributed to the stretching vibration of C![[double bond, length as m-dash]](https://www.rsc.org/images/entities/char_e001.gif) O and C–O–C bonds in the ester groups of PEG-g-GN owing to the hydroxyl group reaction with MAH.25–27 This result suggest that PEG molecular chains were linked to the GN via ester bonds with the aid of the MAH coupling reagent.
O and C–O–C bonds in the ester groups of PEG-g-GN owing to the hydroxyl group reaction with MAH.25–27 This result suggest that PEG molecular chains were linked to the GN via ester bonds with the aid of the MAH coupling reagent.
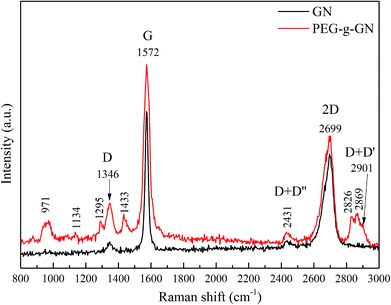
Raman spectroscopy was used to depict the ordered and disordered structures of carbon in graphite materials. Fig. 2 shows the Raman spectra of GN and PEG-g-GN. The GN powder, has three characteristic peaks at 1346 cm−1 (D band), 1572 cm−1 (G band) and 2699 cm−1 (2D band).23,28–30 The D band is ascribed to the defects inherent in the GN layers and the edge effect of GN crystallites. The G band is due to the band scattering of the E2g phonon of the sp2 carbon atoms. Meanwhile, the 2D band is an overtone of the D band, originating from the stacking order of nanosheets.31,32 Generally, an ideal graphite crystal should not exhibit the D band. Hence, some treatments for most commercial graphite products, such as a high-temperature process during production, inevitably introduce defects and reduce the crystallite size.33 For the spectra, the D band of the GN indicated that GN had fewer defects than PEG-g-GN. The intensity ratio of the D and G bands (ID/IG) is measured by the quality of graphitisation or defective disorders on the crystalline graphite, which is also used to evaluate the degree of functionalisation.34 For the GN, the ID/IG value was 0.05, which was lower than 0.19 (the value of PEG-g-GN). The result demonstrated a decrease in the average size of the sp2 domains on the GN after the modification process. In addition, the G band broadening of PEG-g-GN indicated that the sp2 structure of GN was partially destroyed. The new absorption peaks occurred in PEG-g-GN, which are associated with the characteristic peaks of PEG, such as methylene (C–H stretch near 2869, 2826 and 1433 cm−1) and ether bonds (C–O–C stretch in the range of 1100–1300 cm−1).35,36 The result revealed the successful synthesization of PEG-g-GN.
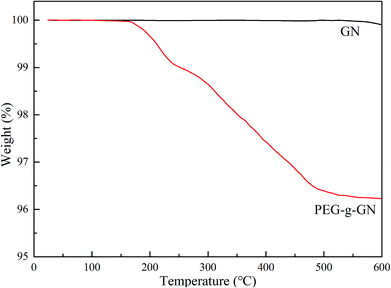
The samples were assessed via thermogravimetric analysis (TGA) to further prove the success of modification (Fig. 3). On the basis of the results, GN exhibited no significant weight loss up to 600 °C. However, two weight loss stages occurred in PEG-g-GN after its modification. The primary mass loss of the modified sample occurred in the temperature range of 130–220 °C, and the weight loss was 0.91 wt%, which was assigned to the degradation of grafted MAH molecules.26 The major weight loss of approximately 2.96 wt% between 230 °C and 600 °C mainly originated from the pyrolysis of the grafted PEG chains.25
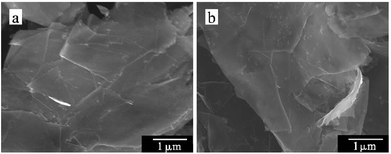
The SEM images are visual evidence of the grafting modification success. Fig. 4a shows the smooth and flat microscopic surface topography of GN. After the modification, several small particles and slight wrinkles were observed on the micro-surface of PEG-g-GN (Fig. 4b), originating from PEG and GN reaction.
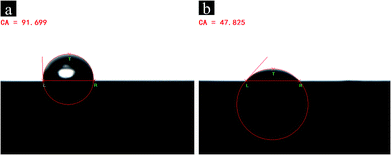
The hydrophilicity of GN and PEG-g-GN varied with the changes in the surface polarity of GN and PEG-g-GN. To characterise the GN and PEG-g-GN surface polarity, contact angle measurements were performed, as shown in Fig. 5. The water contact angle of GN was 91.699°, demonstrating the hydrophobicity of the GN.37–40 Meanwhile, the water contact angle of PEG-g-GN after modification was 47.825° and then decreased when compared with GN. The surface of PEG-g-GN transformed from hydrophobicity to hydrophilicity owing to the presence of oxygen-containing polar groups, which enhanced the GN polarity. These polar groups on the surface of PEG-g-GN will improve the compatibility of GN with polar materials.
Thermal stability of the composites
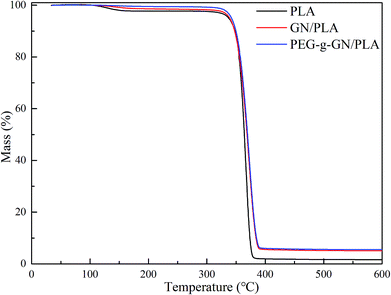
To evaluate the thermal stability of the composite, TGA was conducted in an argon atmosphere to obtain the thermal decomposition temperature of the samples, as shown in Fig. 6 and Table 1. The thermal degradation of PLA composites has two stages. The first degradation stage occurred within the temperature range of 99–160 °C, deriving from the loss of water. The second stage took place with the range of 300–400 °C, involving the degradation of the PLA chains.41 Table 1 presents the list of decomposition temperatures of PLA, GN/PLA and PEG-g-GN/PLA composites.PLA totally degraded between 314.49 °C and 385.34 °C, and reached its fast degradation at 366.36 °C (Table 1). With the addition of GN, the thermal decomposition temperature of the composites improved. To, Tf and Tc of the GN/PLA composite increased to 320.36 °C, 371.33 °C, and 396.18 °C respectively. After modification with PEG, the thermal stability of the composites was further improved. Tf and Tc separately increased to 373.94 °C and 400 °C, when compared with the GN/PLA temperatures. The To value of PEG-g-GN/PLA was 315.65 °C, which is lower than that of GN/PLA because of the degradation of the MAH and PEG molecular chains. Therefore, the thermal stability of PLA can be improved with the addition of GN and be further enhanced when GN was modified by PEG.
Dispersion of GN in the PLA composites
The dispersion of GN in the PLA matrix was investigated via polarised optical microscopy. Fig. 7 shows the optical reflection micrographs of the PLA composites with various contents and types of GN. The black parts are the GN, whereas the background is the PLA matrix. From the optical microscopic images, GN is in the form of nanosheet clusters throughout the PLA.42 When the amount of GN was increased, the black portions expanded, illustrating the establishment process of conductive networks in the PLA matrix. Unlike GN, PEG-g-GN displayed a homogeneous dispersion with smaller clusters in PLA. Specifically, there were some agglomerations of GN appeared in the PLA matrix, which can introduce defects to composites.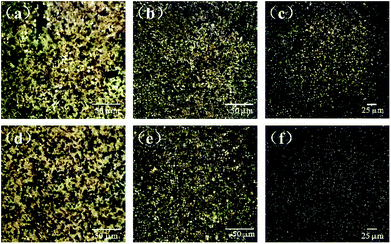 | ||
| Fig. 7 Optical microscopic images of (a) 0.3 wt% GN/PLA, (b) 0.5 wt% GN/PLA, (c) 0.5 wt% GN/PLA, (d) 0.3 wt% PEG-g-GN/PLA, (e) 0.5 wt% PEG-g-GN/PLA, (f) 1 wt% PEG-g-GN/PLA. | ||
Morphology of the composites
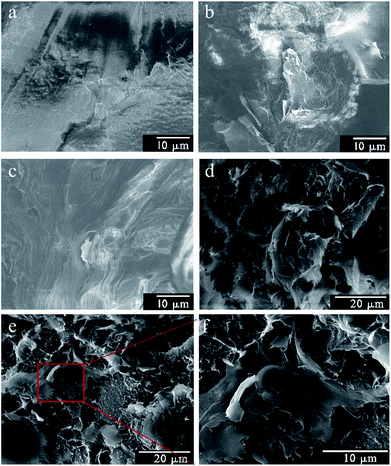
The micrographs of the composite cross section were obtained via SEM (Fig. 8). As illustrated in Fig. 8a, the fractured surface of pure PLA was smooth and plane, which can be determined as a brittle fracture, indicating the inferior ductility of pure PLA.43 With the GN loading of 1 wt%, the cross section of composites became rough and buckling (Fig. 8b and c). The result indicated that GN played a significant role in improving the elongation of composites. When the filler content increased to 2 wt%, it was clear that the some aggregations appeared in the fractured surface of GN/PLA composites, originating from the agglomeration of GN (Fig. 8e and f).44 However, there was no obvious aggregation in the PEG-g-GN/PLA composites as shown in Fig. 8d. The result was consistent with the analyses of mechanical properties of composites and dispersion of graphene in PLA matrix.Mechanical properties of the composites
Table 2 presents the tensile strength and elongation at break of every composite. The molecular chains of PLA have many polar groups, which can provide high tensile strength and low elongation at break. Thus the neat PLA samples had a tensile strength of 51.38 ± 2.63 MPa and elongation of 6.03 ± 0.30% at break. The tensile strength of the GN-based composites was higher than that of neat PLA. The results showed that stress could be transferred via GN in PLA matrix because of its high Young's modulus and tensile strength. Moreover, the PEG-g-GN/PLA composites exhibited higher tensile strength than GN/PLA with the same filler's loading. The maximum tensile strength values of the composites were 59.46 ± 1.67 MPa for PEG-g-GN/PLA and 57.26 ± 3.53 MPa for GN/PLA. With further addition of filler, the tensile strength values became small, indicating that the dominant factors for improving the mechanical properties were the filler's content and dispersion of GN in PLA. Hence, the aggregation degree and dispersion quality were inferior when a large amount of GN was added. The defects induced by the agglomeration of GN in PLA (Fig. 7) resulted in the elongation reduction at break of GN/PLA composites. Owing to the uniform dispersion of PEG-GN in PLA, PEG-g-GN acted as a bridge to prolong the fracture of composites and decrease the sudden risk of failure. Hence, the maximum elongation at break of PEG-g-GN/PLA was 6.26% with loading of 0.5 wt%. However, when the added PEG-g-GN was in excess, the defects in composites would increase, thereby decreasing the tensile strength and elongation at break.| Samples | Tensile strength (MPa) | Elongation at break (%) |
|---|---|---|
| PLA | 51.38 ± 2.63 | 6.03 ± 0.30 |
| 0.3 wt% GN/PLA | 52.94 ± 2.24 | 5.87 ± 0.36 |
| 0.5 wt% GN/PLA | 54.67 ± 2.60 | 5.24 ± 0.38 |
| 1 wt% GN/PLA | 57.26 ± 3.53 | 4.72 ± 0.66 |
| 2 wt% GN/PLA | 56.71 ± 2.88 | 4.44 ± 0.40 |
| 0.3 wt% PEG-g-GN/PLA | 53.44 ± 1.90 | 6.13 ± 0.34 |
| 0.5 wt% PEG-g-GN/PLA | 55.89 ± 2.15 | 6.26 ± 0.27 |
| 1 wt% PEG-g-GN/PLA | 59.46 ± 1.67 | 5.72 ± 0.45 |
| 2 wt% PEG-g-GN/PLA | 57.57 ± 3.12 | 5.15 ± 0.57 |
Electrical conductivity of the composites
Fig. 9 shows the electrical conductivity of the GN/PLA and PEG-g-GN/PLA composites. The figure clearly illustrates that the electrical conductivity increased with the increase in GN and PEG-g-GN content. With the increase in filler's concentration, the conductive networks gradually formed and penetrated into the insulating PLA matrix.45 With the increase in filler's content, the formation of conductive networks became increasingly perfect (as proved in Fig. 7). The electrical conductivity rose from 10−14 to 10−3 S cm−1, whereas the content of the filler increased from 0 to 2 wt%. Moreover, PEG-g-GN became considerably effective in enhancing the electrical conductivity of PLA than CN, as depicted in Fig. 9. When the concentration was 0.3 wt%, the electrical conductivity values of the PEG-g-GN/PLA and GN/PLA composites were 3.62 × 10⁻⁵ and 1.03 × 10⁻⁷ S cm−1, respectively. Unlike GN, PEG-g-GN improved the electrical conductivity of the composites by two orders of magnitude, owing to the uniform dispersion of PEG-g-GN in the PLA matrix. The MAH and PEG molecular chains occupied a certain space volume, allowing GN to overcome its attraction and to disperse well. Moreover, the oxygen-containing groups that originated from MAH and PEG molecular chains on the surface of GN can increase the polarity of the modified sample to enhance its compatibility with PLA. The conductivity values maintained a slow growth with the increase of loading (>1 wt%). Since the PEG is insulating and the modification could slightly destroy the conjugated structure of GN, leading to the decrease in conductivity. Thus, the conductivity of GN was a dominant factor in determining the conductivity of composites at large added amount of GN. The conductivity of GN/PLA was close to that of PEG-g-GN/PLA with a filler content of 2 wt%.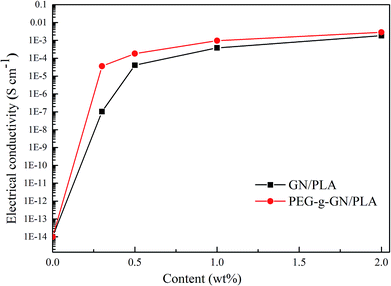 | ||
| Fig. 9 Electrical conductivity of the GN PLA and PEG-g-GN PLA composites as a function of the filler's content. | ||
Conclusions
Herein, a novel PEG-g-GN was prepared, and the physical properties of its composites were characterised. MAH was used as a coupling agent for GN to obtain functional groups via Diels–Alder reaction, and then, PEG was reacted with the anhydride groups of the modified GN, which was confirmed by the FTIR spectra and TGA. SEM revealed the transformation of GN from smooth to tiny particles on the micro-surface after modification. The π–π conjugated structure of GN was partially destroyed after these reactions, as observed in the Raman spectra. Furthermore, PEG-g-GN had good hydrophilicity with the water contact angle at 47.825° because of the presence of oxygen-containing groups. Hence, PEG-g-GN not only possessed high conductivity but also had superb compatibility with PLA. The addition of PEG-g-GN and GN to PLA could also improve the physical properties of the composites, such as thermal stability, electrical conductivity and mechanical performance. The molecular chains of PEG can prevent the GN agglomeration and be used as a plasticiser agent for PLA to enhance the thermal stability, compatibility, conductivity and elongation at break of the composites. The tensile strength of the PEG-g-GN/PLA composites was maximised with the addition of PEG-g-GN at 1 wt%, which was higher than that of the GN/PLA composites with the same amount added. Furthermore, the conductive polymer composites can be suitable for many moulding methods including injection, extrusion and three-dimensional printing. These methods have various applications in the fields of biomedical supplies, battery and sensor.Conflicts of interest
There is no conflict of interest in the submission of this manuscript, and the manuscript is approved by all authors for publication.Acknowledgements
This work was financed from the Science and Technology programme in Hunan province, Project No. 858229088. The authors thank Enago (http://www.Enago.cn) for the English language review.References
- A. Gupta and R. Goyal, J. Appl. Polym. Sci., 2018, 136, 47274 CrossRef.
- N. A. Mohd Radzuan, A. B. Sulong and J. Sahari, Int. J. Hydrogen Energy, 2017, 42, 9262–9273 CrossRef CAS.
- W. Thongruang, R. J. Spontak and C. M. Balik, Polymer, 2002, 43, 3717–3725 CrossRef CAS.
- W. Zhang, A. A. Dehghani-Sanij and R. S. Blackburn, J. Mater. Sci., 2007, 42, 3408–3418 CrossRef CAS.
- G. Georgousis, E. Kontou, A. Kyritsis, P. Pissis, M. Mičušík and M. Omastová, J. Reinf. Plast. Compos., 2018, 37, 1085–1098 CrossRef CAS.
- J. Feller, P. Chauvelon, I. Linossier and P. Glouannec, Polym. Test., 2003, 22, 831–837 CrossRef CAS.
- Y. Fu, L. Liu and J. Zhang, ACS Appl. Mater. Interfaces, 2014, 6, 14069–14075 CrossRef CAS PubMed.
- C. Gonçalves, I. C. Gonçalves, F. D. Magalhães and A. M. Pinto, Polymers, 2017, 9, 269 CrossRef.
- J.-M. Raquez, Y. Habibi, M. Murariu and P. Dubois, Prog. Polym. Sci., 2013, 38, 1504–1542 CrossRef CAS.
- H. Xu, L. Xie, X. Jiang, X.-J. Li, Y. Li, Z.-J. Zhang, G.-J. Zhong and Z.-M. Li, J. Phys. Chem. B, 2013, 118, 812–823 CrossRef.
- O. J. Botlhoko, J. Ramontja and S. S. Ray, RSC Adv., 2017, 7, 33751–33756 RSC.
- A. K. Geim, Science, 2009, 324, 1530–1534 CrossRef CAS.
- X.-Y. Qi, D. Yan, Z. Jiang, Y.-K. Cao, Z.-Z. Yu, F. Yavari and N. Koratkar, ACS Appl. Mater. Interfaces, 2011, 3, 3130–3133 CrossRef CAS PubMed.
- C. N. R. Rao, A. K. Sood, K. S. Subrahmanyam and A. Govindaraj, Angew. Chem., Int. Ed., 2009, 48, 7752–7777 CrossRef CAS PubMed.
- V. Shabafrooz, S. Bandla and J. C. Hanan, J. Mater. Sci., 2018, 53, 559–572 CrossRef CAS.
- P. Zheng, T. Ma and X. Ma, Ind. Eng. Chem. Res., 2013, 52, 14201–14207 CrossRef CAS.
- X. Zhang, Y. Ma, Y. Pei, S. Zheng, Q. Fang, Y. Li and Y. Niu, J. Appl. Polym. Sci., 2018, 47164 Search PubMed.
- S. Sarkar, E. Bekyarova, S. Niyogi and R. C. Haddon, J. Am. Chem. Soc., 2011, 133, 3324–3327 CrossRef CAS PubMed.
- J.-M. Seo and J.-B. Baek, Chem. Commun., 2014, 50, 14651–14653 RSC.
- P. P. Brisebois, C. Kuss, S. B. Schougaard, R. Izquierdo and M. Siaj, Chem.–Eur. J., 2016, 22, 5849–5852 CrossRef CAS PubMed.
- M. Razavi Aghjeh, H. Nazockdast and H. Assempour, J. Appl. Polym. Sci., 2006, 99, 141–149 CrossRef.
- H. Sheshkali, H. Assempour and H. Nazockdast, J. Appl. Polym. Sci., 2007, 105, 1869–1881 CrossRef CAS.
- Y. Cao, S. Osuna, Y. Liang, R. C. Haddon and K. Houk, J. Am. Chem. Soc., 2013, 135, 17643–17649 CrossRef CAS PubMed.
- W.-C. Lai, W.-B. Liau and T.-T. Lin, Polymer, 2004, 45, 3073–3080 CrossRef CAS.
- J.-Z. Xu, Z.-J. Zhang, H. Xu, J.-B. Chen, R. Ran and Z.-M. Li, Macromolecules, 2015, 48, 4891–4900 CrossRef CAS.
- F. Samadaei, M. Salami-Kalajahi and H. Roghani-Mamaqani, Bull. Mater. Sci., 2016, 39, 229–234 CrossRef CAS.
- L. Yang, F. Zhang, T. Endo and T. Hirotsu, Macromolecules, 2003, 36, 4709–4718 CrossRef CAS.
- A. C. Ferrari and D. M. Basko, Nat. Nanotechnol., 2013, 8, 235 CrossRef CAS PubMed.
- R. He, T.-F. Chung, C. Delaney, C. Keiser, L. A. Jauregui, P. M. Shand, C. Chancey, Y. Wang, J. Bao and Y. P. Chen, Nano Lett., 2013, 13, 3594–3601 CrossRef CAS PubMed.
- L. Malard, M. Pimenta, G. Dresselhaus and M. Dresselhaus, Phys. Rep., 2009, 473, 51–87 CrossRef CAS.
- M. Fang, K. Wang, H. Lu, Y. Yang and S. Nutt, J. Mater. Chem., 2010, 20, 1982–1992 RSC.
- M. Pimenta, G. Dresselhaus, M. S. Dresselhaus, L. Cancado, A. Jorio and R. Saito, Phys. Chem. Chem. Phys., 2007, 9, 1276–1290 RSC.
- K. N. Kudin, B. Ozbas, H. C. Schniepp, R. K. Prud'Homme, I. A. Aksay and R. Car, Nano Lett., 2008, 8, 36–41 CrossRef CAS PubMed.
- S. Stankovich, D. A. Dikin, R. D. Piner, K. A. Kohlhaas, A. Kleinhammes, Y. Jia, Y. Wu, S. T. Nguyen and R. S. Ruoff, Carbon, 2007, 45, 1558–1565 CrossRef CAS.
- M. Caccamo and S. Magazù, Vib. Spectrosc., 2016, 85, 222–227 CrossRef CAS.
- F. Migliardo, S. Magazù and M. Caccamo, J. Mol. Struct., 2013, 1048, 261–266 CrossRef CAS.
- S. An, B. N. Joshi, J.-G. Lee, M. W. Lee, Y. I. Kim, M.-w. Kim, H. S. Jo and S. S. Yoon, Catal. Today, 2017, 295, 14–25 CrossRef CAS.
- Y. Lin, G. J. Ehlert, C. Bukowsky and H. A. Sodano, ACS Appl. Mater. Interfaces, 2011, 3, 2200–2203 CrossRef CAS PubMed.
- J. Zang, S. Ryu, N. Pugno, Q. Wang, Q. Tu, M. J. Buehler and X. Zhao, Nat. Mater., 2013, 12, 321 CrossRef CAS PubMed.
- X. Zhang, S. Wan, J. Pu, L. Wang and X. Liu, J. Mater. Chem., 2011, 21, 12251–12258 RSC.
- C. Zhang, L. Wang, T. Zhai, X. Wang, Y. Dan and L.-S. Turng, J. Mech. Behav. Biomed. Mater., 2016, 53, 403–413 CrossRef CAS PubMed.
- R. B. Valapa, G. Pugazhenthi and V. Katiyar, RSC Adv., 2015, 5, 28410–28423 RSC.
- L. Wan and Y. Zhang, J. Mech. Behav. Biomed. Mater., 2018, 88, 223–230 CrossRef CAS PubMed.
- M. Wang, X.-Y. Deng, A.-K. Du, T.-H. Zhao and J.-B. Zeng, RSC Adv., 2015, 5, 73146–73154 RSC.
- D. Chen and G. Chen, J. Reinf. Plast. Compos., 2011, 30, 757–761 CrossRef CAS.
| This journal is © The Royal Society of Chemistry 2019 |

