 Open Access Article
A bis-benzimidazole PMO ratiometric fluorescence sensor exhibiting AIEE and ESIPT for sensitive detection of Cu2+†
Xiafan
Hao
a,
Shuhua
Han
 *a,
Jingtao
Zhu
b,
Yongfeng
Hu
c,
Lo Yueh
Chang
d,
Chih-Wen
Pao
e,
Jeng-Lung
Chen
e,
Jin-Ming
Chen
 e and
Shu-Chih
Haw
e
aKey Lab of Colloid and Interface Chemistry, Ministry of Education, Shandong University, Jinan 250100, P. R. China. E-mail: shuhhan@sdu.edu.cn
bMOE Key Laboratory of Advanced Micro-structured Materials, School of Physics Science and Engineering, Tongji University, Shanghai 200092, P. R. China
cCanadian Light Source 44 Innovation Boulevard Saskatoon, SK S7N 2V3, Canada
dInstitute of Functional Nano & Soft Materials (FUNSOM), Soochow University-Western University Centre for Synchrotron, Radiation Research, Suzhou 215006, P. R. China
eNational Synchrotron Radiation Research Center, 101, Science-Based Industrial Park, Hsinchu 30076, Taiwan
First published on 2nd May 2019
Abstract
A novel bis-benzimidazole organic siloxane precursor (BBM-Si) was prepared, and was combined with tetraethylorthosilicate (TEOS) as a mixed Si source. Then, bridged periodic mesoporous organosilica (BBM-PMO) spherical nanoparticles were synthesized by co-condensation using cetyltrimethylammonium bromide (CTAB) as structure directing agent. The optical properties showed that BBM qualifies as an “aggregation induced emission enhanced” (AIEE) molecule, exhibiting characteristics of excited-state intramolecular proton transfer (ESIPT), such as a large Stokes shift and dual fluorescence emission. For the BBM-PMO materials, the silica skeleton provides a rigid environment that limits molecular rotation, resulting in improved fluorescence emission. In particular, the BBM-PMOs exhibited dual emission of the enol and keto forms, achieving a ratiometric response to Cu2+ with high sensitivity and selectivity in a broad pH range. Additionally, the limit of detection was as low as 7.15 × 10⁻⁹ M in aqueous solution. The X-ray absorption near-edge spectroscopy (XANES) showed the coordination structure through the interaction between copper ions and N atoms of benzimidazole in the BBM-PMO coordinated to Cu2+. These results demonstrate that BBM-PMO hybrid materials have potential applications in the fields of bio-imaging and environmental monitoring.
Introduction
Periodic mesoporous organosilica (PMO) nanoparticles have attracted increasing attention in the fields of chemical sensing, cell imaging, drug delivery and catalysis, due to their large surface area, tunable pore diameter, excellent biocompatibility and ease of modification with other functional groups.1 The chemical sensing properties of PMOs can be modulated by the functional organic groups that are embedded in the hybrid mesoporous silica framework. As organic fluorophores are incorporated into the framework structure of PMOs, the bridged organic groups protected by the silica walls can be densely packed in the pore walls with high stability against photobleaching.2 Many organic–inorganic hybrid nanoparticles have been used as fluorescence sensors to detect metal ions, such as Cu2+, Hg2+ and Zn2+.3The use of aggregation-induced emission enhancement (AIEE) luminophores is considered to be an effective way to avoid fluorescence quenching in an aggregation state or a solid state, as they exhibit stronger emission due to the restriction of intramolecular rotation.4 Excited-state intramolecular proton transfer (ESIPT) is a photoinduced process, in which a proton is transferred from a proton donor to an acceptor in the excited state. ESIPT molecules have unique properties, such as dual emission and a large Stokes shift, which help in avoiding self-absorption, and optical properties that are sensitive to the local environment.5 Integration of AIEE and ESIPT fluorophores leads to a material that possesses characteristics of both and offers a better platform in the field of chemical sensing and bio-imaging than either of these fluorophores alone. Recently, more efforts have been made to research AIEE-active ESIPT molecules. Qin et al. synthesized an efficient chemosensor for Zn2+ detection, based on an ESIPT-coupled AIEE process.6 Xu et al. developed a new benzothizole-based fluorescent probe for Hg2+ recognition in MCF-7 cells with good cell permeability.7
Fluorescence has the unique advantages of high sensitivity, specificity and easy manipulation, and so it has rapidly become a preferable ion measurement technique.8 However, most luminescence sensors are only based on changes in fluorescence intensity, which are transmitted as a single signal.9 In order to obtain a precise result, more attention must be paid to ratiometric fluorescence chemosensors, due to their self-calibration, ability to avoid the effects of external environmental changes and reduced background interference. Ratiometric chemosensors possess these advantages as they utilize the ratio changes of fluorescence intensities at two wavelengths in order to detect substances. This method provides built-in corrections for changes in environmental conditions.10
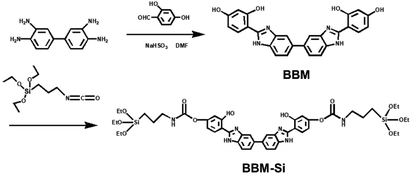
Here, a new bis-benzimidazole derivative (BBM) was designed and synthesized from diaminobenzidine and dihydroxybenzaldehyde (Scheme 1). BBM exhibits characteristics of both AIEE and ESIPT, as it is composed of a biphenyl group and tautomers of enol and keto forms. BBM was modified further to form an organosiloxane compound (BBM-Si). Bis-benzimidazole derivative bridged PMO (BBM-PMO) materials were synthesized utilizing BBM-Si and tetraethoxyorthosilane (TEOS) as mixed Si sources. Cetyltrimethylammonium bromide (CTAB) was used as a structure-directing agent. The results show that the BBM-PMOs not only maintained a good mesoporous structure, but also exhibited excellent characteristics of ratiometric fluorescence emission, which was used for the highly selective and sensitive detection of copper ions over a broad range of tested metal ions. Moreover, its limit of detection (LOD) was as low as the nanomolar concentration range. In addition, the chemosensing mechanism of the BBM-PMOs for copper ions was researched using synchrotron radiation X-ray absorption spectra. To the best of our knowledge, there are no reports of AIEE-active ESIPT fluorescence hybrid PMOs up to now. These organic–inorganic hybrid nanomaterials integrating ESIPT and AIEE show potential applications in bioimaging, sensing and other fields.
Results and discussion
Structural characterization of BBM-PMOs
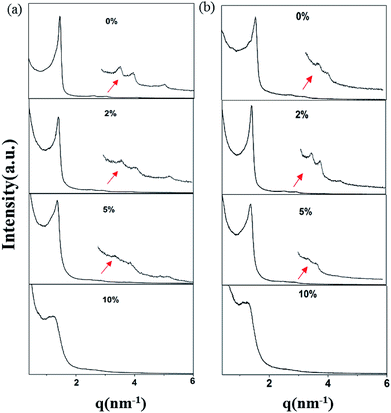
The small-angle X-ray scattering (SAXS) peaks of all BBM-PMOs before and after extraction of CTAB are shown in Fig. 1. As we can see from the figure, the hybrid materials have well-ordered mesoporous structures. For BBM-PMO-2, there are four significant scattering peaks at 1.43 nm−1, 2.47 nm−1, 2.86 nm−1 and 3.80 nm−1 that meet the ratios of 1![[thin space (1/6-em)]](https://www.rsc.org/images/entities/char_2009.gif) :
:![[thin space (1/6-em)]](https://www.rsc.org/images/entities/char_2009.gif)

![[thin space (1/6-em)]](https://www.rsc.org/images/entities/char_2009.gif) :
:![[thin space (1/6-em)]](https://www.rsc.org/images/entities/char_2009.gif) 2
2![[thin space (1/6-em)]](https://www.rsc.org/images/entities/char_2009.gif) :
:![[thin space (1/6-em)]](https://www.rsc.org/images/entities/char_2009.gif)
 , which correspond to the (100), (110), (200) and (210) scattering peaks, indicating the formation of 2D hexagonal (P6mm) materials. With the increase of the BBM-Si precursor, the (100) scattering peak of the PMO material gradually widens and the intensity of the peak decreases, illustrating that the order of the materials is steadily declining. In addition, the 2θ values of the d100 plane are 1.55°, 1.43°, 1.36° and 1.28° for BBM-PMO-0, BBM-PMO-2, BBM-PMO-5 and BBM-PMO-10, respectively. This trend suggests a gradual expansion to the pore wall as a way of overcoming the strained inclusion of organic moieties in the PMOs, as the amount of BBM-Si is increased in the BBM-PMOs.11 After removing the surfactant, the materials still maintain an ordered mesoporous structure well.
The FTIR spectra of BBM and BBM-PMOs are shown in Fig. S1.† Compared with that of BBM, the BBM-PMO spectra exhibit a new peak at around 1635 cm−1 representing the C![[double bond, length as m-dash]](https://www.rsc.org/images/entities/char_e001.gif) O stretching vibration, indicating that BBM is connected to the siloxane via a propylamide group. On the other hand, the peaks at 1070 cm−1 and 795 cm−1 are assigned to the stretching vibrations of Si–O–Si and Si–O frameworks, respectively, which prove that BBM-Si was successfully introduced into the hybrid materials. Additionally, the typical band of BBM and BBM-PMOs at 1615 cm−1 was attributed to the C
O stretching vibration, indicating that BBM is connected to the siloxane via a propylamide group. On the other hand, the peaks at 1070 cm−1 and 795 cm−1 are assigned to the stretching vibrations of Si–O–Si and Si–O frameworks, respectively, which prove that BBM-Si was successfully introduced into the hybrid materials. Additionally, the typical band of BBM and BBM-PMOs at 1615 cm−1 was attributed to the C![[double bond, length as m-dash]](https://www.rsc.org/images/entities/char_e001.gif) N stretching vibration of imide groups, exhibiting the characteristic peak of imidazole rings in the BBM molecules.
N stretching vibration of imide groups, exhibiting the characteristic peak of imidazole rings in the BBM molecules.
The condensation degree and silicon environment of the BBM precursor with the silica skeleton were confirmed using 29Si NMR spectroscopy (Fig. S2†). For BBM-PMO-20, the spectrum shows two groups of signals. One group of peaks at −40 ppm and −55 ppm corresponds to silicon resonances of T2 and T3, respectively, which represent isolated terminal (RSi(OSi)2OH) and cross-linked (RSi(OSi)3) siloxanes. The other signals at −86, −100 and −110 ppm correspond to Si species of Q2, Q3 and Q4 units (Qn = Si(OSi)n(OH)4−n, n = 2, 3, 4), respectively. The uncondensed siloxane was not detected, suggesting that the BBM-Si groups were embedded into the silica frameworks of the PMOs.
Three main weight losses of BBM-PMO-10 are observed in the TGA-DSC curves (Fig. S3†). The initial weight loss below 200 °C is attributed to the physically adsorbed water and crystalline water in the pores of the BBM-PMO-10 sample. The second weight loss from 200 °C to 350 °C corresponds to decomposition of organic groups in the sample. The weight loss at 350–800 °C is ascribed to the further condensation of residual silanol to form a Si–O–Si network. The above analysis indicates that BBM-PMO hybrid materials can maintain excellent thermal stability below 200 °C.
Fig. 2 shows the SEM and HR-TEM images of BBM-PMOs after the extraction of CTAB. The prepared BBM-PMOs exhibit a spherical shape with an average diameter of 80 nm. A regularly ordered mesoporous channel (ca. 2.60 nm) is observed in Fig. 2b, d and f. The appearance of hexagonal diffraction spots is ascribed to the diffraction of the (100) crystal face, which indicates a regular mesoporous structure in the P6mm space group, consistent with the SAXS results. Although the shape of the pores is disordered, mesoporous channels still exist in BBM-PMO-10, illustrating that excess BBM can destroy the order of the mesoporous structure.
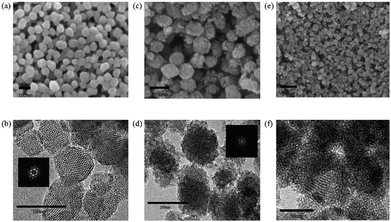 | ||
| Fig. 2 The SEM (a, c and e) and HR-TEM (b, d and f) images of BBM-PMO-2 (a and b), BBM-PMO-5 (c and d) and BBM-PMO-10 (e and f) after extraction of the template. | ||
Nitrogen adsorption–desorption isotherms reflect the interactive relationships between the surface properties and pore structural features. Fig. 3 shows nitrogen adsorption–desorption isotherms for the BBM-PMOs. The patterns present typical IV curves and obvious H1 hysteresis loops that are characteristic of mesoporous materials according to the IUPAC. The surface areas, calculated using the Brunauer–Emmett–Teller (BET) method, were 1237, 747, 500 and 121 m2 g−1, with pore diameters of 2.85, 2.76, 2.50 and 2.45 nm, for BBM-PMO-0, BBM-PMO-2, BBM-PMO-5 and BBM-PMO-10, respectively. These results revealed a decrease in the surface area and pore size with increasing fraction of BBM-Si (Table 1). This can be ascribed to the bridged organic groups occupying a large volume of space in the pore walls. The results are consistent with those of SAXS and HR-TEM.
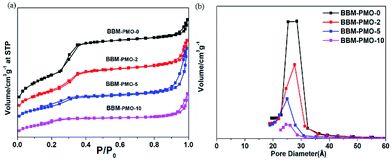 | ||
| Fig. 3 (a) N2 adsorption–desorption isotherms and (b) pore size distribution curves of BBM-PMO-X (X = 0, 2, 5, 10) hybrid nanoparticles. | ||
| Sample | a 0 [nm] | S BET [m2 g−1] | V t [m3 g−1] | D BJH [nm] | b [nm] |
|---|---|---|---|---|---|
| a Notation: a0, lattice parameter; SBET, BET surface area; Vt, total pore volume; DBJH, pore diameter, calculated from absorption branches by BJH method; wall thickness, b = a0 − DBJH. | |||||
| BBM-PMO-0 | 4.67 | 1237 | 1.04 | 2.85 | 1.82 |
| BBM-PMO-2 | 5.07 | 747 | 0.80 | 2.76 | 2.31 |
| BBM-PMO-5 | 5.33 | 500 | 0.76 | 2.50 | 2.83 |
| BBM-PMO-10 | 5.67 | 121 | 0.15 | 2.45 | 3.22 |
Effects of solvents on ESIPT and AIEE of BBM
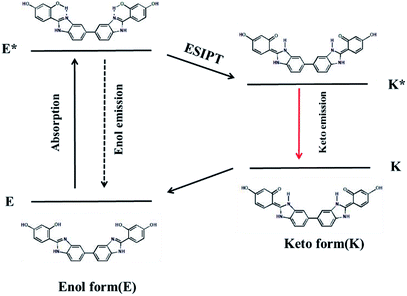
The ESIPT process of AIEE-active BBM is described in Scheme 2. In the ground state, BBM exists as an enol form (E), which is stabilized by the intramolecular hydrogen bond between the proton donor (–OH) and proton acceptor (imine of benzimidazole) groups.12 Through photoexcitation, E is transformed into an exited enol form known as the E* form. Then a very fast intramolecular proton transfer (ESIPT) process occurs from E* to the single line excited state of the keto isomer (K*), due to the reapportionment of electronic charge. Next, K* returns to the keto ground state (K) by radiative decay. Lastly, K can return to the E form through proton transfer. During this process, two fluorescence emissions are produced by the tautomer. One is the enol fluorescence emission from E* to E, which is called the enol emission. The other is the ESIPT fluorescence emission from K* to K, which is named the keto emission.13 Therefore, intramolecular and/or intermolecular hydrogen bonding has a great influence on the fluorescence properties of the ESIPT process.Fig. S4† shows the fluorescence emission spectra of BBM with ESIPT effect in several solvents. In protic solvents (methanol and ethanol), BBM exhibits a strong keto emission (K*) at 440 nm, suggesting that BBM interacts with the protic solvent to form a dipolar zwitterion, which is formed by intermolecular hydrogen bonding between BBM molecules and protic solvent (Fig. S5†).14 However, the fluorescence intensity of the enol form (E*) is very weak at 310 nm. These results show that BBM molecules mainly appear in the keto form, not as the enol form, in protic solvents. In aprotic polar solvents, such as THF and DMF, dual fluorescence emissions at 317 nm and 458 nm, which are the enol and keto form emissions, respectively, illustrate that BBM molecules coexist in the tautomer enol and keto forms. Moreover, the fluorescence intensity of the tautomer represents the amount of the enol and/or keto forms in aprotic polar solvents. This makes it possible to construct a highly sensitive platform based on the ratiometric fluorescence of two wavelengths. As for BBM in dichloromethane, no obvious enol emission is found and only the keto emission appears in the solution. BBM has two different planar conformers, syn-enol and anti-enol, which are in equilibrium in the ground state.15 Because the biphenyl C–C bond can rotate freely, nonplanar rotamers may exist. In DCM, the C–C bond rotation of biphenyl groups in BBM makes it possible for two benzene rings to exist in a nonplanar form, which is beneficial to ESIPT, resulting in the keto emission in DCM.
In order to study the AIEE of BBM, the fluorescence emission spectra in different ratios of THF/H2O (v/v) were obtained, as depicted in Fig. S6.† Upon addition of water, the intensity of the keto emission was enhanced, which originated from the production of self-aggregates due to its poor solubility in aqueous solution.16 Ultimately, THF/H2O = 3![[thin space (1/6-em)]](https://www.rsc.org/images/entities/char_2009.gif) :
:![[thin space (1/6-em)]](https://www.rsc.org/images/entities/char_2009.gif) 7 (water fraction fw = 70%) solvent was selected as the working solution for examination, because the ratio of the fluorescence emission intensity of the keto and enol forms (I2/I1) was found to be moderate in the mixed solvent. Similarly, it is essential to choose an appropriate pH value for achieving high sensitivity detection of Cu2+ in aqueous solution. The pH value has a great influence on the fluorescence behavior and on the intramolecular hydrogen bonds of BBM. When the pH < 4, a new peak at 400 nm appears (Fig. 7a), attributed to the protonated BBM molecule, which facilitates an effective ESIPT process. Meanwhile, the BBM molecule no longer complexes with Cu2+ because of the electric repulsion between Cu2+ and the protonated imidazole ring. When the pH > 10, BBM forms anions due to the dissociation of hydrogen ions from the hydroxyl groups of BBM, weakening the ESIPT effect. Thus, the ion cannot be detected below pH 4 and above pH 10 (Fig. S7b†). In the pH range from 4 to 10, the fluorescence intensity ratio (I2/I1) of BBM exhibits an inconspicuous change between before and after the addition of Cu2+, indicating that the materials are resistant to environmental interference during the detection process and they are stable over a broad pH range.
7 (water fraction fw = 70%) solvent was selected as the working solution for examination, because the ratio of the fluorescence emission intensity of the keto and enol forms (I2/I1) was found to be moderate in the mixed solvent. Similarly, it is essential to choose an appropriate pH value for achieving high sensitivity detection of Cu2+ in aqueous solution. The pH value has a great influence on the fluorescence behavior and on the intramolecular hydrogen bonds of BBM. When the pH < 4, a new peak at 400 nm appears (Fig. 7a), attributed to the protonated BBM molecule, which facilitates an effective ESIPT process. Meanwhile, the BBM molecule no longer complexes with Cu2+ because of the electric repulsion between Cu2+ and the protonated imidazole ring. When the pH > 10, BBM forms anions due to the dissociation of hydrogen ions from the hydroxyl groups of BBM, weakening the ESIPT effect. Thus, the ion cannot be detected below pH 4 and above pH 10 (Fig. S7b†). In the pH range from 4 to 10, the fluorescence intensity ratio (I2/I1) of BBM exhibits an inconspicuous change between before and after the addition of Cu2+, indicating that the materials are resistant to environmental interference during the detection process and they are stable over a broad pH range.
Optical properties of BBM-PMOs
The UV-vis spectrum peaks of BBM-Si appear at 262 nm and 349 nm in aqueous solution (Fig. 4a). The absorption peak at 262 nm belongs to the aromatic ring π–π* transition.17 The maximum absorption peak at 349 nm is ascribed to the π–π* transition between benzimidazole and hydroxyphenyl,18 including a six-membered ring formed by a hydrogen bond between a phenolic hydroxyl group and an imidazole nitrogen, which inhibits rotation around C–C of the biphenyl group to form a large conjugate structure.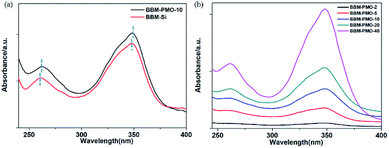 | ||
Fig. 4 UV-vis absorption spectra of (a) BBM-Si (10−5 M) and BBM-PMO-10 (10−4 g mL−1) in THF/H2O (3![[thin space (1/6-em)]](https://www.rsc.org/images/entities/char_2009.gif) : :![[thin space (1/6-em)]](https://www.rsc.org/images/entities/char_2009.gif) 7 v/v); (b) BBM-PMOs in THF/H2O (3 7 v/v); (b) BBM-PMOs in THF/H2O (3![[thin space (1/6-em)]](https://www.rsc.org/images/entities/char_2009.gif) : :![[thin space (1/6-em)]](https://www.rsc.org/images/entities/char_2009.gif) 7 v/v, 10−4 g mL−1). 7 v/v, 10−4 g mL−1). | ||
For BBM-PMO-10, a slight red shift (about 2 nm) of each absorption peak is observed. This may be due to a higher conjugation or coplanarity degree of the benzene rings in the BBM-PMOs.19 As the BBM content in the hybrid material increases, the intensity of the absorption peaks also increase; however, the position and shape of the peaks are retained, indicating that there is no strong molecular interaction between the organic molecules in the ground state when BBM is embedded in the materials (Fig. 4b).
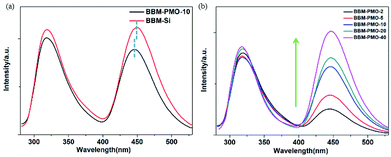
In order to further investigate the optical properties of BBM-Si and BBM-PMOs, the fluorescence spectra were also investigated in an aqueous environment (Fig. 5). Upon exciting at 270 nm, dual emission peaks at 317 nm and 445 nm, which are assigned to the enol emission and keto emission (Stokes shift = 128 nm), respectively, revealed the typical features of the ESIPT process.20 For BBM-PMO-10, a slight blue shift (about 3 nm) of the keto emission occurs compared with that of BBM-Si, because the silica matrix provides a rigid structure that restricts intramolecular rotation of AIEE molecules.21 Furthermore, the fluorescence intensity of the BBM-PMOs increases as the organic content of the embedded materials increases. However, the spectrum curve shape and position are also constant, indicating that there is no interaction between BBM and the silica framework in the excited state. In addition, the fluorescence lifetime for the keto tautomer was measured through time-correlated single photon counting with excitation at 380 nm (Fig. S8†). All samples exhibit a biexponential decay profile, illustrating that there are two mechanisms of fluorescence decay in the hybrid materials.22 The shorter life τ1 is attributed to the monomer emission, and longer life τ2 is ascribed to the interaction of organic groups in the materials. For BBM-Si, the average lifetime ![[small tau, Greek, macron]](https://www.rsc.org/images/entities/i_char_e0d4.gif) is 2.15 ns. After the BBM units have been anchored into the materials, the average lifetime declines rapidly (Table S1†). This may be due to the increase of the positive charge density in the hybrid materials caused by the acidity in the surrounding environment.23
is 2.15 ns. After the BBM units have been anchored into the materials, the average lifetime declines rapidly (Table S1†). This may be due to the increase of the positive charge density in the hybrid materials caused by the acidity in the surrounding environment.23
BBM-PMO-10 as a sensor for detection of Cu2+
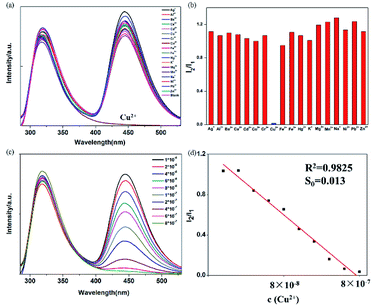
A set of experiments were carried out to assess the specific selectivity of BBM-PMO-10 to metal copper ions. BBM-PMO-10 (blank sample) presents strong fluorescence emissions at 317 nm and 445 nm, corresponding to the enol (I1) and keto (I2) luminescence, respectively (Fig. 6). Upon addition of Cu2+ ions, the keto fluorescence emission is quenched, while the enol form maintains its original fluorescence intensity. On the contrary, there is no perturbation to the fluorescence properties of the BBM-PMO when other metal ions such as Ba2+, Ca2+, Cd2+, Co2+, Fe2+, Hg2+, Mg2+, Mn2+, Ni2+, Pb2+, Zn2+, Ag+, K+, Na+, Al3+, Cr3+ and Fe3+ were added. Moreover, when Cu2+ solution is added to the other metal ion solution again (Fig. S9†), the ratio of I2/I1 decreased significantly.These results demonstrate that BBM-PMOs have the unique ability to test for Cu2+ in aqueous solution with selectivity and sensitivity. In addition, it was noticed that the I2/I1 of BBM-PMO-10 decreases linearly with the increase of Cu2+ concentration from 10−8 to 10−7 M (Fig. 6c and d). The LOD of Cu2+ was calculated to be 7.15 × 10⁻⁹ M, while for the BBM molecule itself, the LOD is 6.9 × 10⁻⁷ M (Fig. S10†), which is about two orders of magnitude lower than that of the hybrid materials.
It is considered that the fixation role of the silica framework improves stability and the AIEE effect of BBM. On the other hand, BBM-PMO materials exhibit outstanding performance as a reversible fluorescence chemosensor, as shown in Fig. S11.† With the addition of EDTA, the fluorescence of BBM-PMO-10 quenched by Cu2+ can restore its original fluorescence. After the addition of Cu2+ solution again, the fluorescence of the keto form is quenched again, demonstrating the outstanding reproducibility for BBM-PMOs.
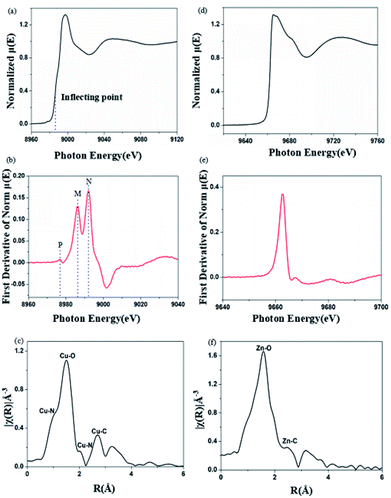
X-ray absorption near-edge spectroscopy (XANES) can provide information about metal valence states and coordination structures.24 The Cu K-edge and Zn K-edge XANES spectra for Cu2+-chelated and Zn2+-chelated BBM-PMO-10 are shown in Fig. 7. The position of the maximum peak of the derivative curve (Fig. 7b), corresponding to the inflection point in the normalized curve (Fig. 7a), is taken as the position of the edge energy. The energy of the K-edge of copper in BBM-PMO-10 (8990 eV) is different from that of copper metal (8986 eV). This indicates that the copper ion is divalent in the hybrid materials.25 There are three characteristic peaks in the Cu K-edge derivative picture (Fig. 7b). The appearance of a weak pre-edge peak (labeled “P”) at 8978 eV, which is caused by the 1s → 3d dipole forbidden electron transition, indicates that the copper ion and BBM-PMO complex possesses non-centrosymmetric geometry. Peaks at 8986 eV (strong, labeled “M”) and 8993 eV (strong, labeled “N”) are Cu K-edge feature peaks due to the 1s → 4p transition allowed by the dipole.26 The appearance of the characteristic peak M indicates the distortion of the metal cluster, that is, the Cu(II) complex may exist in a distorted pyramidal configuration in the hybrid material. In the Fourier transform spectrum of the Cu K-edge XANES spectrum (Fig. 7c), the peak at 1.04 Å is assigned to the Cu–N interaction between the copper ion and the BBM group.27 As a comparison, the Zn K-edge XANES spectrum of the Zn2+-chelating BBM-PMO-10 material was investigated. The normalized μ(E) spectrum shows a plateau at around 9666 eV (Fig. 7d), with no distinct peaks appearing around 9765 eV, indicating that the Zn(II) complex exists in tetrahedral coordination.28 The first peak of the Fourier transform spectrum of the Zn K-edge XANES spectrum appears at 1.60 Å (Fig. 7f), which is greater than the peak of the Cu2+-chelated sample (1.04 Å). These results indicate that the interaction between the copper ion and BBM unit is stronger than that of the zinc ion, and the N atoms of the imidazole ring play an important role in the specific selection of Cu(II).
The soft X-ray absorption near-edge structure (XANES) spectrum is sensitive to the electronic structure of the organic group and can provide information about the electronic distribution. In order to further prove that BBM-PMO-10 can achieve specific detection of Cu(II), the C and N K-edge XANES spectra of BBM-PMO-10 chelated with Fe2+, Zn2+ and Cu2+ were studied (Fig. 8).
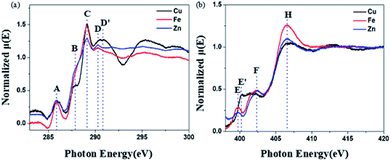 | ||
| Fig. 8 C (a) and N (b) K-edge XANES spectra of Cu2+-chelated BBM-PMO-10, Fe2+-chelated BBM-PMO-10 and Zn2+-chelated BBM-PMO-10. | ||
The C K-edge spectrum of BBM-PMO-10 chelated with Cu(II) shows a broad peak at 287.87 eV (peak B), compared with those of the Fe(II) and Zn(II) samples. This is attributed to the electronic transition of  of the imidazole ring,29 probably because the protonation of the imidazole N atom reduces the shielding effect of the C atoms attached to it.30 The peak at 290.3 eV (peak D) is the transition of the C atom of imidazole:
  . After coordination with Cu(II), the transition energy increases to 209.8 eV (peak D′). As copper ions participate in the coordination interaction, electrons are transferred from the benzimidazole unit to copper ions, making the C-electron cloud density decrease and energy transition increase. The positions of other absorption peaks of the C K-edge XANES spectrum are shown in Table 2. The soft X-ray absorption near-edge structure of the N K-edge of BBM-PMO-10 chelated with Fe2+ and Zn2+ exhibits a peak at 399.6 eV (E peak), attributed to the electronic transition of the N atom of the imidazole group:
  . After coordination with Cu(II), the position of the peak is shifted to 400.3 eV (E′ peak). The reason is that the electron cloud density of the N atom of the imidazole ring decreases and the transition energy increases when Cu(II) participates in the coordination interaction. The other absorption peaks in the N K-edge XANES spectrum are also shown in Table 3. Thus, benefiting from the high resolution of the soft X-ray absorption spectra of C and N, different C and N atom sites in BBM-PMOs can be clearly distinguished in the carbon and nitrogen K-edge XANES.
| Peaks | Energy (eV) | Transition level from N1s |
|---|---|---|
| E | 399.6 |

|
| E′ | 400.3 |

|
| F | 402.2 |
 (ref. 31) (ref. 31) |
| H | 406.5 |
 and and  |
Fig. S16† shows the complex ratios of BBM and copper ions. The total concentration of BBM and copper ions was kept constant, while the molar ratio of BBM and copper ions was gradually changed. Finally, the complex ratio of BBM and copper ions was 1![[thin space (1/6-em)]](https://www.rsc.org/images/entities/char_2009.gif) :
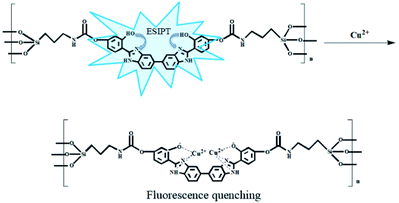
:![[thin space (1/6-em)]](https://www.rsc.org/images/entities/char_2009.gif) 2. From the above analysis, the possible detection mechanism was proposed, as shown in Fig. 9. The addition of Cu2+ leads to the formation of the complex that quenches keto fluorescence emission.
2. From the above analysis, the possible detection mechanism was proposed, as shown in Fig. 9. The addition of Cu2+ leads to the formation of the complex that quenches keto fluorescence emission.
Conclusion
In summary, spherical BBM-PMO nanoparticles were prepared by using CTAB as a structure directing agent to condense the BBM-bridged siloxane precursor and TEOS. The BBM-PMO materials possess characteristics of both AIEE and ESIPT, in which the effect of AIEE enhances the fluorescence, and ESIPT exhibits a double fluorescence emission of the enol and keto forms. With increasing content of the BBM-Si precursor, the fluorescence intensity of the hybrid materials increases, because the immobilization of the silica skeleton limits the free rotation around the C–C bond within the hybrid materials. The BBM-PMOs can detect copper ions with high sensitivity and selectivity, which causes the keto fluorescence emission to quench while the enol fluorescence emission is maintained in a broad pH range. In summary, highly ordered mesoporous BBM-PMOs exhibiting ratiometric fluorescence have been achieved, and have been effectively applied to the chemical sensing of Cu2+, with a detection limit in the nanomolar range.Experimental section
Materials
All of the reagents and solvents were commercially available and used as received. 3,3′-diaminobenzidine, 2,4-dihydroxybenzaldehyde, 3-isocyanatopropyltriethoxysilane, triethylene diamine (TEDA) and cetyltriethylammnonium bromide (CTAB) were purchased from Shanghai Jingchun Reagent Company. Tetraethoxyorthosilane (TEOS) was available from Tianjin Guangcheng Reagent Company. Tetrahydrofuran (THF) was bought from Sinopharm Chemical Reagent Co., Ltd. Sodium hydrogen sulfite was obtained from Tianda Chemical Reagent Factory. Ethanol, N,N-dimethylformamide, triethylamine and n-hexane were purchased from Tianjin Fuyu Reagent Company.Characterization
1H NMR spectra were measured using a Bruker DPX-300 NMR spectrometer and DMSO-d6 was used as the solvent. HRMS spectra were obtained on an Agilent QTOF6510. Small-angle X-ray scattering (SAXS) was recorded using the SAXSess mc2 by Anton Paar; the sample-detector distance was set to 264.5 mm. FT-IR spectra were collected on a Nicolet 700 FTIR spectrometer (Thermo-Fisher Scientific, Inc., Waltham, MA) with KBr flakes. 29Si magic angle spinning nuclear magnetic resonance (29Si MAS NMR) spectra were obtained on a Bruker DSX 300 MHz spectrometer (5000 transients, spin speed 6 kHz, acquisition time 0.02 s, pulse delay 3 s). TGA/DSC was carried out in N2 atmosphere using a SDT-Q600 V8.3 Build 101 Simultaneous DSC-TGA Instrument (TA) with a heating rate of 10 °C min−1 in temperature range from 30 °C to 800 °C. Scanning electron microscope (SEM) pictures were taken by S-4800 with an accelerating voltage of 5 kV. High resolution transmission electron microscope (HR-TEM) pictures were taken using a JEM-2100, with an operating voltage of 200 kV. Nitrogen adsorption/desorption isotherms were acquired on a Micromeritics ASAP2020 surface area and porosity analyzer at 77 K. The UV-vis absorption spectra were recorded on a Beijing TU-1901 spectrometer. The fluorescence spectra were collected on a Hitachi F-4500 fluorescence spectrophotometer using a monochromated Xe lamp as an excitation source. Time-resolved fluorescence spectra were measured using an Edinburgh FLS920 fluorescence spectrophotometer. The metal ion (Cu, Fe, Zn) K-edge XAS measurements were performed at the Quick-EXAFS beamline of the Taiwan Light Source in transmission mode. Metal foil was used for energy calibration and the results were analyzed using the Athena program. C, N and O K-edge spectra were obtained using beamline 20 A of the Taiwan Light Source in fluorescence mode. SiC, BN and CoO were used for the energy calibration.Synthesis
Conflicts of interest
There are no conflicts to declare.Abbreviation
| PMOs | Periodic mesoporous organosilicas |
| AIEE | Aggregation-induced emission enhancement |
| ESIP | Excited-state intramolecular proton transfer |
Acknowledgements
This research was financially supported by the Natural Science Foundation of China (No. 50572057).Notes and references
- (a) S. Parambadath, A. Mathew, M. J. Barnabas, K. M. Rao and C.-S. Ha, Microporous Mesoporous Mater., 2016, 225, 174–184 CrossRef CAS; (b) K. M. Rao, S. Parambadath, A. Kumar, C.-S. Ha and S. S. Han, ACS Biomater. Sci. Eng., 2018, 4, 175–183 CrossRef CAS; (c) Y. Wei, X. M. Li, A. A. Elzatahry, R. Y. Zhang, W. X. Wang, X. T. Tang, J. P. Yang, J. X. Wang, D. Al-Dahyan and D. Y. Zhao, RSC Adv., 2016, 6, 51470–51479 RSC; (d) A. Martinez-Cuezva, S. Valero-Moya, M. Alajarin and J. Berna, Chem. Commun., 2015, 51, 14501–14504 RSC; (e) J. G. Croissant, C. Qi, O. Mongin, V. Hugues, M. Blanchard-Desce, L. Raehm, X. Cattoën, M. Wong Chi Man, M. Maynadier, M. Gary-Bobo, M. Garcia, J. I. Zink and J.-O. Durand, J. Mater. Chem. B, 2015, 3, 6456–6461 RSC.
- (a) X. Y. Qiu, S. H. Han and M. Gao, J. Mater. Chem. A, 2013, 1, 1319–1325 RSC; (b) J. J. Peng, J. Y. Li, W. Xu, L. Wang, D. D. Su, C. L. Teoh and Y. T. Chang, Anal. Chem., 2018, 90, 1628–1634 CrossRef CAS.
- (a) A. A. Bhatti, M. Oguz and M. Yilmaz, Appl. Surf. Sci., 2018, 434, 1217–1223 CrossRef CAS; (b) X. F. Zeng, Y. H. Xu, X. M. Chen, W. H. Ma and Y. Zhou, Appl. Surf. Sci., 2017, 423, 1103–1110 CrossRef CAS; (c) Z. B. Sun, G. J. Cui, H. Z. Li, Y. Liu, Y. X. Tian and S. Q. Yan, J. Mater. Chem. B, 2016, 4, 5194–5216 RSC; (d) A. Singh, V. K. Bhardwaj, G. Kaur, K. Kaur, N. Singh and M. S. Bakshi, RSC Adv., 2014, 4, 21079–21088 RSC.
- (a) G. X. Huang, R. S. Wen, Z. M. Wang, B. S. Li and B. Z. Tang, Mater. Chem. Front., 2018, 2, 1884–1892 RSC; (b) Y. J. Cai, C. S. Shi, H. Zhang, B. Chen, K. Samedov, M. Chen, Z. M. Wang, Z. J. Zhao, X. G. Gu, D. G. Ma, A. J. Qin and B. Z. Tang, J. Mater. Chem. C, 2018, 6, 6534–6542 RSC.
- K. C. Tang, M. J. Chang, T. Y. Lin, H. A. Pan, T. C. Fang, K. Y. Chen, W. Y. Hung, Y. H. Hsu and P.-T. Chou, J. Am. Chem. Soc., 2011, 133, 17738–17745 CrossRef CAS.
- J. C. Qin, B. D. Wang, Z. Y. Yang and K. C. Yu, Sens. Actuators, B, 2016, 224, 892–898 CrossRef CAS.
- D. Xu, L. J. Tang, M. Y. Tian, P. He and X. M. Yan, Tetrahedron Lett., 2017, 58, 3654–3657 CrossRef CAS.
- (a) C. H. Zong, K. L. Ai, G. Zhang, H. W. Li and L. H. Lu, Anal. Chem., 2011, 83, 3126–3132 CrossRef CAS; (b) X. G. Chen, Q. J. Lu, D. Liu, C. Y. Wu, M. L. Liu, H. T. Li, Y. Y. Zhang and S. Z. Yao, Microchim. Acta, 2018, 185, 188 CrossRef.
- (a) M. Gao, S. H. Han, Y. F. Hu and L. J. Zhang, J. Phys. Chem. C, 2016, 120, 9299–9307 CrossRef CAS; (b) L. Zhang, Z. Z. Wang, J. Z. Hou, L. L. Lei, J. Li, J. Bai, H. Huang and Y. X. Li, Anal. Methods, 2018, 10, 2560–2566 RSC.
- (a) J. L. Yao, K. Zhang, H. J. Zhu, F. Ma, M. T. Sun, H. Yu, J. Sun and S. H. Wang, Anal. Chem., 2013, 85, 6461–6468 CrossRef CAS; (b) K. Wang, H. L. Ren, N. Li, X. Y. Tan and F. Q. Dang, Talanta, 2018, 188, 708–713 CrossRef CAS.
- S. Parambadath, A. Mathew, M. Jenisha Barnabas and C.-S. Ha, Microporous Mesoporous Mater., 2015, 215, 67–75 CrossRef CAS.
- (a) S. Biswas, R. Mengji, S. Barman, V. Venugopal, A. Jana and N. D. P. Singh, Chem. Commun., 2018, 54, 168–171 RSC; (b) N. Manojai, R. Daengngern, K. Kerdpol, C. Ngaojampa and N. Kungwan, J. Lumin., 2017, 188, 275–282 CrossRef CAS; (c) S. Sahu, M. Das and G. Krishnamoorthy, Phys. Chem. Chem. Phys., 2016, 18, 11081–11090 RSC; (d) C. Prommin, N. Kanlayakan, W. Chansen, R. Salaeh, K. Kerdpol, R. Daengngern and N. Kungwan, J. Phys. Chem. A, 2017, 121, 5773–5784 CrossRef CAS.
- (a) J. E. Kwon and S. Y. Park, Adv. Mater., 2011, 23, 3615–3642 CrossRef CAS; (b) S. Furukawa, H. Shono, T. Mutai and K. Araki, ACS Appl. Mater. Interfaces, 2014, 6, 16065–16070 CrossRef CAS.
- E. L. Roberts, J. Dey and I. M. Warner, J. Phys. Chem. A, 1997, 101, 5296–5301 CrossRef CAS.
- K. Skonieczny, A. I. Ciuciu, E. M. Nichols, V. Hugues, M. Blanchard-Desce, L. Flamigin and D. T. Gryko, J. Mater. Chem., 2012, 22, 20649–20664 RSC.
- K. Li, Q. Feng, G. L. Niu, W. J. Zhang, Y. Y. Li, M. M. Kang, K. Xu, J. He, H. W. Hou and B. Z. Tang, ACS Sens., 2018, 3, 920–928 CrossRef CAS.
- V. Kachwal, I. S. Vamsi Krishna, L. Fageria, J. Chaudhary, R. Kinkar Roy, R. Chowdhury and I. R. Laskar, Analyst, 2018, 143, 3741–3748 RSC.
- S. K. Behera, A. Murkherjee, G. Sadhuragiri, P. Elumalai, M. Sathiyendiran, M. Kumar, B. B. Mandal and G. Krishnamoorthy, Faraday Discuss., 2017, 196, 71–90 RSC.
- Y. F. Dong, W. L. Wang, C. W. Zhong, J. B. Shi, B. Tong, X. Feng, J. G. Zhi and Y. P. Dong, Tetrahedron Lett., 2014, 55, 1496–1500 CrossRef CAS.
- A. Sen Gupta, K. Paul and V. Luxami, Sens. Actuators, B, 2017, 246, 653–661 CrossRef CAS.
- S. S. Yan, Z. N. Gao, Y. Xia, X. M. Liao, J. Han, C. C. Pan, Y. F. Zhang and W. Z. Zhai, Eur. J. Inorg. Chem., 2018, 1891–1901 CrossRef CAS.
- M. G. Vivas, J. C. Germino, C. A. Barboza, D. D. A. Simoni, P. A. M. Vazquez, L. D. Boni, T. D. Z. Atvars and C. R. Mendonca, J. Phys. Chem. C, 2017, 121, 1283–1290 CrossRef CAS.
- (a) S. A. J. Sulaiman, G. S. Al-Rasbi and O. K. Abou-Zied, Luminescence, 2016, 31, 614–625 CrossRef CAS; (b) S. Y. Yin, S. S. Sun, M. Pan, L. Chen, Z. Wang, Y. J. Hou, Y. N. Fan, H. P. Wang and C. Y. Su, J. Photochem. Photobiol., A, 2018, 355, 377–381 CrossRef CAS.
- A. Gaur, W. Klysubun, B. Soni, B. D. Shrivastava, J. Prasad and K. Srivastava, J. Mol. Struct., 2016, 1121, 119–127 CrossRef CAS.
- H. Ando, Y. Ichihashi, K. Tawa and M. Tanaka, J. Inclusion Phenom. Macrocyclic Chem., 2011, 71, 293–296 CrossRef CAS.
- A. Gaur, W. Klysubun, S. K. Joshi, B. Soni, B. D. Shrivastava, J. Prasad and K. Srivastava, J. Phys.: Conf. Ser., 2016, 712, 012084 CrossRef.
- A. Gaur, W. Klysubun, N. N. Nair, B. D. Shrivastava, J. Prasad and K. Srivastava, J. Mol. Struct., 2016, 1118, 212–218 CrossRef CAS.
- W. Hu, J. Ma, J. L. Wang and S. M. Zhang, Mater. Sci. Eng., C, 2012, 32, 2404–2410 CrossRef CAS.
- A. W. Gillespie, F. L. Walley, R. E. Farrell, P. Leinweber, A. Schlichting, K. U. Eckhardt, T. Z. Regier and R. I. R. Blyth, Soil Sci. Soc. Am. J., 2009, 73, 2002–2012 CrossRef CAS.
- J. Y. Lv, P. J. Y. Ko, Y. Zhang, L. J. Liu, X. J. Zhang, X. H. Zhang, X. H. Sun and T. K. Sham, Appl. Phys. Lett., 2011, 98, 243016 Search PubMed.
- A. Vairavamurthy and S. Wang, Environ. Sci. Technol., 2002, 36, 3050–3056 CrossRef CAS.
- K. Akutsu, S. Mori, K. Shinmei, H. Iwase, Y. Nakano and Y. Fujii, Talanta, 2016, 146, 575–584 CrossRef CAS.
- J. G. Croissant, O. Mongin, V. Hugues, M. Blanchard-Desce, X. Cattoën, M. Wong Chi Man, V. Stojanovic, C. Charnay, M. Maynadier, M. Gary-Bobo, M. Garcia, L. Raehm and J. O. Durand, J. Mater. Chem. B, 2015, 3, 5182–5188 RSC.
Footnote |
| † Electronic supplementary information (ESI) available. See DOI: 10.1039/c9ra00892f |
| This journal is © The Royal Society of Chemistry 2019 |

