 Open Access Article
Enhanced electrochemical properties of cellular CoPS@C nanocomposites for HER, OER and Li-ion batteries†
Miao Wang and
Kaibin Tang *
*
Hefei National Laboratory for Physical Sciences at the Microscale, Department of Chemistry, University of Science and Technology of China, Hefei, 230026, China. E-mail: kbtang@ustc.edu.cn
First published on 14th May 2019
Abstract
Cellular CoPS@C nanocomposites were successfully synthesized via a facile two-steps route. The performances of the CoPS@C electrode as a non-noble metal electrocatalyst for hydrogen evolution reaction (HER) and oxygen evolution reaction (OER) show good activity. On the other hand, the electrochemical investigation of CoPS systems for lithium ion batteries (LIBs) is reported for the first time. The CoPS@C nanocomposite as a novel anode can maintain a capacity of about 713 mA h g−1 after 50 cycles at a current density of 0.2 A g−1, indicating its potential applications in lithium storage. Test results also demonstrate that the CoPS@C nanocomposite exhibit more excellent HER, OER and Li storage performances compared to the bulk CoPS sample.
Introduction
Due to the rapidly increasing demand for energy and extensive use of fossil fuels, there is an urgent need to find alternative sources of clean energy to solve the growing environmental problems. In this regard, hydrogen, as the most abundant element in the universe, has a high energy density and is eco-friendly.1–5 Among various methods, the water electrolysis reaction (H2O → H2 + 1/2O2), including hydrogen evolution (HER) at the cathode and oxygen evolution (OER) at the anode, is considered as a very promising approach for hydrogen production with high purity.6–10 However, the electrocatalytic techniques for water splitting heavily rely on noble metal catalysts such as Pt for the HER and IrO2/RuO2 for the OER. Thus, it is highly desirable to find earth-abundant, low-cost, and highly active catalysts for water splitting. In order to address these challenges, various classes of electrocatalysts, such as transition-metal phosphides (TMPs)11–18 and transition-metal chalcogenides (TMCs)19,20 were developed, which were investigated for electrocatalytic application. Some studies have shown that the synergistic effects between TMPs and TMCs can effectively improve the electrochemical performance.21,22 Therefore, bifunctional electrocatalytic application ternary transition-metal phosphide-chalcogenides (TMPCs) is a research field with great potential. In particular, the pyrite-type ternary compound cobalt phosphosulfide (CoPS) has recently been demonstrated as a highly efficient earth-abundant non-noble catalyst for robust electrochemical tests.23–25On the other hand, Li-ion batteries (LIBs) which are considered to be another kind of substitutes of finite fossil fuel, are promising power sources in energy storage devices, portable electronics and electric vehicles.26–30 Because of the low theoretical capacity of commercial graphite (372 mA h g−1) and poor rate performance,31 the research of new anode materials with more excellent electrochemical performances is one of the most widely investigated topics in LIBs.32–34 As previously reported, cobalt phosphide35–37 and cobalt sulfide38–41 as anode materials have been widely investigated. However, to the best of our knowledge, the electrochemical investigation of CoPS system as anode for lithium ion batteries (LIBs) have not been reported yet.
In general, the nanostructured materials and coating with carbon are two main approaches which can significantly improve their electrochemical performance.42–45 Herein, a cellular CoPS@C nanocomposite was successfully prepared via a facile two-steps route and its electrochemical properties were examined for HER, OER and LIBs. The test results show that it exhibit better electrochemical properties than bulk material.
Experimental section
Sample synthesis
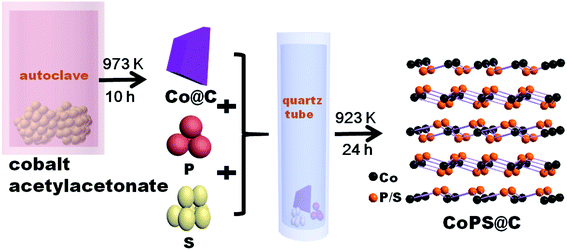
In a typical synthesis, powder of cobalt(II) acetylacetonate (97%) firstly was loaded into a stainless steel autoclave of 20 mL capacity, and sealed and heated at 973 K for 10 h. Then the dark precipitates of Co@C were collected without any purified treatment. Secondly, powders of Co@C, red phosphorus (99%) and sublimate sulphur (99%) were thoroughly mixed together, encapsulated in an evacuated quartz tube, and followed by a sintering procedure at 923 K for 24 h, which is illustrated in Scheme 1. Bulk CoPS sample was also successfully prepared by conventional solid state method. Powders of the elements Co (99.5%), red phosphorus (99%) and sublimate sulphur (99%) were thoroughly mixed together, then sealed into quartz ampoule evacuated. The ampoule was slowly heated up to 923 K, holding for 24 h. After the tube was naturally cooled to room temperature, the product was collected carefully, washed with absolute alcohol several times, and finally dried in a vacuum furnace at 60 °C for subsequent tests.Structural characterization
The phases and purity of the obtained products were characterized by X-ray powder diffraction an a Philips X'pert X-ray diffractometer equipped with Cu Kα radiation (λ = 1.5418 Å). The scanning electron microscopy (SEM) images were taken by using a JEOL-JSM-6700F field-emitting (FE) scanning electron microscope. The high-resolution transmission electron microscope (HRTEM) images were taken on a JEOL-2010 HRTEM at an acceleration voltage of 200 kV, and the samples for analysis were prepared by dipping carbon coated copper grids into ethanolic solutions of samples and drying under ambient conditions. X-ray photoelectron spectroscopy (XPS) was performed on Thermo ESCALAB 250. Raman spectroscopy is carried out on a JY LABRAM-HR confocal laser micro-Raman spectrometer using Ar+ laser excitation with a wavelength of 514.5 nm. The weight percentage of carbon is characterized by elemental analysis (EA, Elemental vario EL cube, Thermal Conductivity Detector) at pure oxygen atmosphere.Electrochemical characterization
All the electrochemical measurements were performed with a CHI660E electrochemical workstation (Shanghai Chenhua Instrument Corporation, China) at room temperature. The carbon cloth was firstly washed with acetone, alcohol and water, then dried in a vacuum for subsequent HER and OER tests. The catalysts (5 mg) were dispersed into 1 mL solution containing 500 μL ethanol and 500 μL deionized water, then the dispersion was sonicated until a homogeneous black ink was formed. Then 30 μL of the slurry was drop-cast onto a carbon cloth (0.5 cm × 0.5 cm) followed by drying in an oven at 80 °C. The HER and OER activities were evaluated by using a CHI660E electrochemical analyzer (CH Instruments, Inc., Shanghai, China) in a standard three-electrode system, using Ag/AgCl (saturated KCl solution) as the reference electrode, a platinum electrode as the counter electrode and the modified carbon cloth electrode as the working electrode. All the linear sweep voltammetry (LSV) curves were recorded at 5 mV s−1 for the performance test. For comparison, the catalytic activity of commercial Pt/C (20 wt%) and RuO2 were also tested with the carbon cloth as the substrate and the same mass loading was applied. The cyclic voltammetry (CV) was carried out from 0.36 to 0.46 V at a scan rate of 2 mV s−1, 4 mV s−1, 6 mV s−1, 8 mV s−1, and 10 mV s−1. Electrochemical impedance spectroscopy (EIS) was used at frequencies from 100![[thin space (1/6-em)]](https://www.rsc.org/images/entities/char_2009.gif) 000 to 0.01 Hz at 0.6 V for OER. The amperometric i–t curve measurements were tested at 10 mA cm−1 current density. All the potentials were calibrated with respect to the reversible hydrogen electrode (RHE): E(RHE) = E(Ag/AgCl) + 0.059 × pH + 0.197.
000 to 0.01 Hz at 0.6 V for OER. The amperometric i–t curve measurements were tested at 10 mA cm−1 current density. All the potentials were calibrated with respect to the reversible hydrogen electrode (RHE): E(RHE) = E(Ag/AgCl) + 0.059 × pH + 0.197.
Coin-type 2016 cells for lithium storage performance test are assembled in an argon-filled glove-box (O2, H2O < 1 ppm) with lithium foil worked as the anode, celgard 2400 worked as the separator, and 1.0 M LiPF6 in ethylene carbonate (EC)/diethyl carbonate (DEC) (1![[thin space (1/6-em)]](https://www.rsc.org/images/entities/char_2009.gif) :
:![[thin space (1/6-em)]](https://www.rsc.org/images/entities/char_2009.gif) 1 by volume) worked as the electrolyte. The working electrode was prepared by mixing active material, carbon black and polyvinylidene fluoride (PVDF) at a weight ratio of 6
1 by volume) worked as the electrolyte. The working electrode was prepared by mixing active material, carbon black and polyvinylidene fluoride (PVDF) at a weight ratio of 6![[thin space (1/6-em)]](https://www.rsc.org/images/entities/char_2009.gif) :
:![[thin space (1/6-em)]](https://www.rsc.org/images/entities/char_2009.gif) 2
2![[thin space (1/6-em)]](https://www.rsc.org/images/entities/char_2009.gif) :
:![[thin space (1/6-em)]](https://www.rsc.org/images/entities/char_2009.gif) 2 in N-methyl-2-pyrrolidone (NMP). Then the mixture is ball-milling for ten hours to mix uniformly, the obtained slurry was spread on Cu foil substrate and dried at 80 °C in a vacuum oven for 10 h. The loading mass of the CoPS@C anode material is around 1 mg. Galvanostatic measurements are performed using a LAND-CT2001A instrument in the potential range of 0.01–3 V (vs. Li/Li+) at a designated current density at constant room temperature.
2 in N-methyl-2-pyrrolidone (NMP). Then the mixture is ball-milling for ten hours to mix uniformly, the obtained slurry was spread on Cu foil substrate and dried at 80 °C in a vacuum oven for 10 h. The loading mass of the CoPS@C anode material is around 1 mg. Galvanostatic measurements are performed using a LAND-CT2001A instrument in the potential range of 0.01–3 V (vs. Li/Li+) at a designated current density at constant room temperature.
Results and discussion
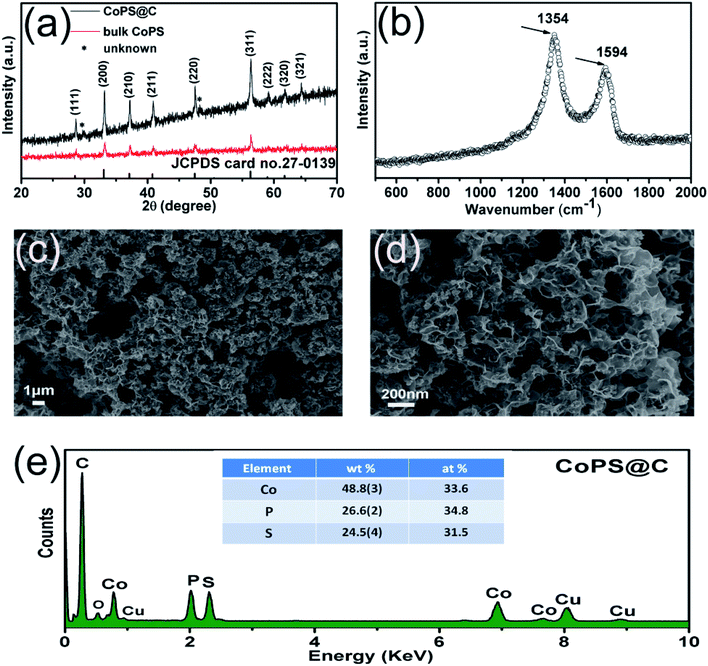
CoPS as ternary alloy crystallizes in a typical pyrite compound, as displayed in Scheme 1. The phases of the as-obtained CoPS@C and bulk CoPS samples were analyzed by powder X-ray diffraction (XRD), and the results are shown in Fig. 1a. The main diffraction peaks could be well indexed based on a cubic-type cell with the space group of Pa3 (CoPS: JCPDS card no. 27-0139). Fig. 1b shows the Raman spectrum of the sample, two characteristic peaks located at 1354 cm−1 and 1594 cm−1 are detected, which can be attributed to the D- and G-bands of graphite, respectively. In detail, the D-band is attributed to the vibration of carbon atoms with dandling bonds in plane terminations of disordered graphite, while the G-band is corresponds to an E2g vibration mode of graphite and is associated with the vibration of carbon sp2 atoms in 2D hexagonal lattice. The ratio between I(D band)/I(G band) is very high, which suggests the presence of a high component of disordered carbon in the samples.46–49 Elemental analysis reveals that the carbon content of the CoPS@C nanocomposite is about 14.28 wt%. Fig. 1c and d show representative SEM images of the as-prepared cellular CoPS@C nanocomposite with different magnification. The microstructure of product shows a uniform and typical cellular morphology. The EDX spectra (Fig. 1e) confirms that these composites are composed of C, Co, P and S elements and the trace oxygen signal may be caused by surface oxidation.To identify the microstructures of the CoPS@C nanocomposite, high-resolution TEM (HRTEM) images are collected. Fig. 2a reveals that these lumpy structures consist of CoPS nanoparticles and carbon layers; meanwhile, these CoPS nanoparticles are dispersed in the carbon layers without severe agglomeration and the diameter of the nanoparticle is estimated to be 50 nm. Fig. 2c shows the HRTEM image of the CoPS@C nanocomposite, the clear crystal lattice with d-spacing of 0.272 nm, which correspond to the (200) plane of CoPS crystal. The HAADF-STEM and corresponding EDX mapping images of the CoPS@C nanocomposite are shown in Fig. 2b and d–g. These images further confirm the homogeneous distributions of cobalt, phosphorus and sulfur elements in the particles, which are encapsulated with carbon layers.
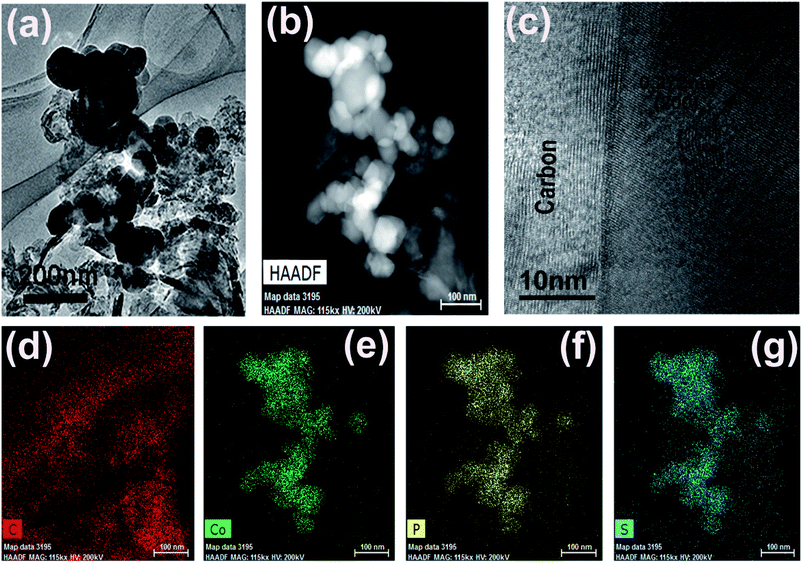 | ||
| Fig. 2 (a) TEM, (b) HAADF-STEM (c) HRTEM images and (d–g) the corresponding EDX mapping images of the as-prepared CoPS@C nanocomposite, C (red), Co (green), P (yellow) and S (blue). | ||
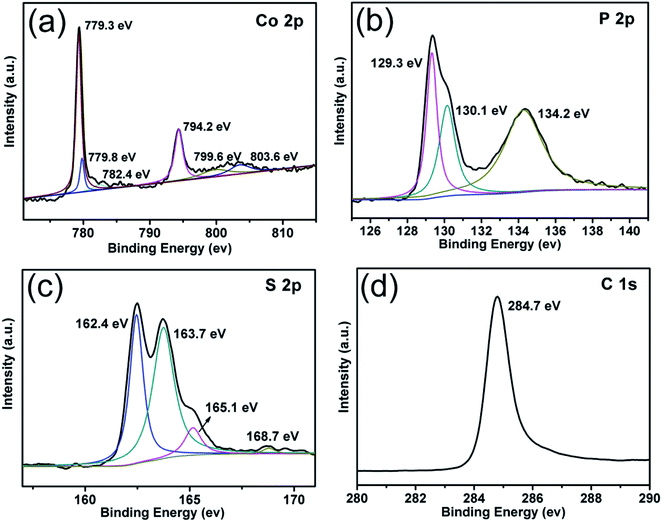
X-ray photoelectron spectroscopy (XPS) was carried out to further analyze the bonding characteristics as well as the composition of CoPS @C nanocomposite (Fig. 3). The full XPS spectrum indicates that Co, P, S, C and O elements exist in the CoPS@C nanocomposite, as shown in Fig. S1.† Fig. 3a displays the XPS spectrum of Co 2p. The peaks located at 779.3 and 794.2 eV were attributed to the 2p3/2 and 2p1/2 of Co3+, respectively.50–52 Another doublet at 779.8 and 799.6 eV was ascribed to 2p3/2 and 2p1/2 of Co2+, while the other two peaks at 782.4 and 803.6 eV were satellites.53–57 The 2p3/2 and 2p1/2 peaks of P 2p core level spectrum located at 129.3 and 130.1 eV, respectively as displayed in Fig. 3b, while the peak at 134.2 eV was attributed to the P–O bond due to the surface oxidation.58–62 The spectra of S 2p are shown in Fig. 3c. Two peaks at 162.4 and 163.7 eV were attributed to S 2p3/2, while the peaks at 165.1 and 168.7 eV represent the spin–orbit contributions from S 2p1/2.63–69 A very strong signal at 284.7 eV corresponds to the C 1 s peak of CoPS@C sample, as shown in Fig. 3d.70
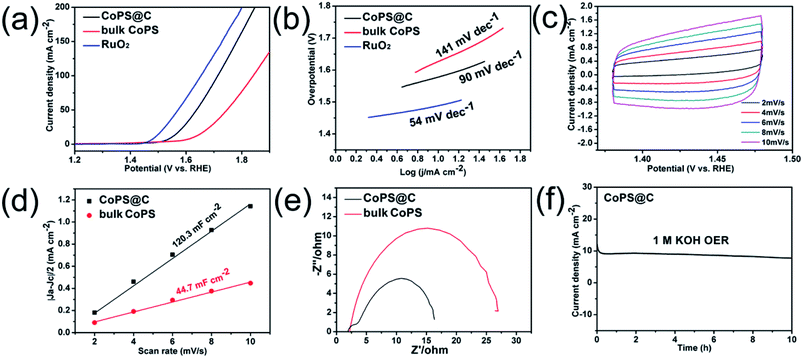
The test for OER performance was performed in 1 M KOH using a standard three-electrode system at room temperature, and the electrocatalytic activity of RuO2 was also measured for comparison. As shown in Fig. 4a, the electrode of CoPS@C exhibits enhanced OER performance compared with the bulk CoPS electrode. The CoPS@C can generate a current density of 10 mA cm−2 at an overpotential of 313 mV vs. RHE, lower than that of the bulk CoPS (395 mV vs. RHE). We also cycled our CoPS@C catalyst continuously for 1000 cycles in 1 M KOH solution at a scan rate of 50 mV s−1, and I–V curves were obtained before and after the cycling, as displayed in Fig. S2.† In addition, based on the LSV curves, the corresponding Tafel plots are constructed. The Tafel plot is a useful parameter to evaluate catalytic activity as well as an indicator of the reaction mechanism.71–73 Fig. 4b shows that the Tafel slope value of CoPS@C catalyst is about 90 mV dec−1, much lower than those of bulk CoPS (141 mV dec−1), which further confirms the faster reaction kinetics and superior electrocatalytic OER performance of CoPS@C. To provide further insight into the intrinsic catalytic property, the electrochemical active surface area (ECSA) of catalysts was also evaluated via the cyclic voltammetry (CV) method, which is proportional to the electrochemical double-layer capacitance (Cdl).74–76 The CV testing of CoPS@C nanocomposite and bulk CoPS were carried out from 0.36 to 0.46 V at different scan rates (Fig. 4c and Fig. S3†), and the differences between anode and cathode current density at 0.41 V plotted against scan rate are fitted to gain the Cdl. It was calculated that the Cdl of CoPS@C nanocomposite and bulk CoPS were 120.3 mF cm−2 and 44.7 mF cm−2 respectively, which demonstrated that CoPS@C nanocomposite can provide more active sites, corresponding to excellent electrocatalytic activity, as shown in Fig. 4d. Furthermore, the electrochemical impedance spectroscopy (EIS) measurements were carried out for CoPS@C nanocomposite and bulk CoPS to investigate the kinetics of the electrode reaction, as shown in Fig. 4e. The semicircle observed in the Nyquist plots represents the charge transfer resistance (Rct).77–81 The smaller semicircle is observed for the CoPS@C nanocomposite, indicating the smaller Rct, and thus the faster OER kinetics than bulk CoPS. Stability is another important performance characteristic for catalysts. Testing of the long-term durability of the CoPS@C nanocomposite for OER was performed by chronoamperometry measurement at 0.31 V for 10 h (Fig. 4f), and the decrease in the current density was almost negligible.
Besides, the HER performance of the electrode was tested in 0.5 M H2SO4 using a standard three-electrode system at room temperature. Fig. 5a shows linear sweep voltammetry (LSV) curves of the CoPS@C and bulk CoPS from −0.6 V to 0.1 V vs. RHE with a scan rate of 5 mV s−1. The commercial Pt/C catalyst (20 wt%) was also examined for comparison. As expected, the Pt/C shows excellent HER activity with a near-zero overpotential. The polarization curves of CoPS@C has a smaller overpotential (154 mV vs. RHE) than bulk CoPS (304 mV vs. RHE) to achieve a geometric current density of −10 mA cm−2. To evaluate the long durability of the electrode for HER activity, we cycled the electrode continuously for 1000 cycles in 0.5 M H2SO4 solution at a scan rate of 50 mV s−1, as displayed in Fig. S4.† As shown in Fig. 5b, the Tafel slope of CoPS@C is 167 mV dec−1, which is smaller than those of bulk CoPS (218 mV dec−1), suggesting the faster reaction kinetics and better HER efficiency of CoPS@C. The stability of CoPS for HER was tested at −0.36 V for 10 h by Chronoamperometry. Fig. 5c shows that the decrease in the current density was almost negligible.
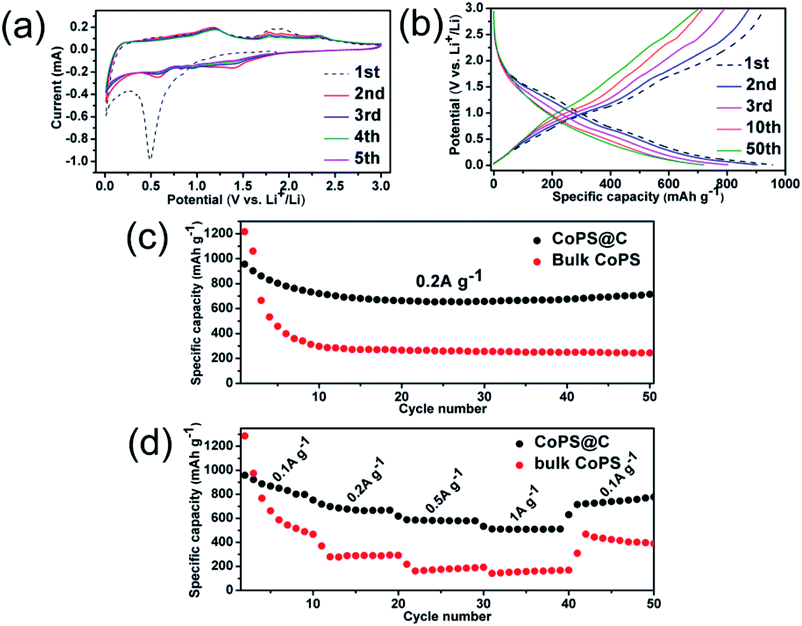
The electrochemical properties of the as-synthesized CoPS@C nanocomposite are further tested by CV (cyclic voltammetry) between 0.01 and 3.0 V (scan rate 0.1 mV s−1). Fig. 6a shows the first five consecutive CV of the CoPS@C electrode. During the cathodic sweep, there is an obvious reduction peaks consisted of two peaks centered at 1.41 and 0.56 V, which can be attributed to the conversion reaction of Li with CoPS.82–84 During the anodic sweep, oxidation peaks locate at 1.18, 1.78 and 2.34 V corresponded to lithium ion delithiation reaction.85–87 From the second cycle, the CV curves mostly overlap, indicating the good reversibility of the electrochemical reactions. Fig. 6b shows the discharge and charge curves for the 1st, 2nd, 3rd, 10th and 50th cycles at a current density of 0.2 A g−1. Consistent with the above CV results, a platform at 0.5 V is observed in the discharge process. Upon charge, a platform located at 1.75 V is observed. Fig. S5† shows the four voltammograms of CoPS@C nanocomposite electrode after 50 cycles at the current density of 0.2 A g−1 to verify the cycling stability. As expected, the observed peaks during the cathodic and anodic sweep were consistent with the result in Fig. 6a. To further investigate the lithium storage mechanism of CoPS@C electrode, ex situ XRD test on the discharged electrodes were performed. However, the signals from XRD pattern are too weak due to amorphous products, as displayed in Fig. S6.† Fig. 6c displays the representative cyclic performances of CoPS@C and bulk CoPS electrodes at a current density of 0.2 A g−1. The bulk CoPS electrode exhibits a capacity of about 245 mA h g−1 after 50 cycles. As for CoPS@C electrode, a reversible capacity of 713 mA h g−1 was retained over 50 cycles. Comparing with the bulk CoPS electrode, the CoPS@C electrode shows more excellent electrochemical performance. Fig. 6d depicts the rate capability of CoPS@C and bulk CoPS electrodes. The capacities of the CoPS@C electrode at current densities of 0.1 A g−1, 0.2 A g−1, 0.5 A g−1, 1.0 A g−1 and 0.1 A g−1 are around 816, 668, 581, 512 and 778 mA h g−1. As for bulk CoPS electrode, the capacities at 0.1 A g−1, 0.2 A g−1, 0.5 A g−1, 1.0 A g−1 and 0.1 A g−1 are around 417, 292, 186, 171 and 398 mA h g−1, respectively.
Conclusions
In summary, we have developed a facile synthetic route for the cellular CoPS@C nanocomposite. The performances of CoPS@C as a non-noble metal catalyst for HER in an acidic medium and OER in an alkaline medium show better activity than bulk CoPS sample. On the other hand, CoPS@C as a novel anode was found to be active in lithium ion batteries, exhibiting a high capacity 713 mA h g−1 at current density of 0.2 A g−1 and excellent reversibility over 50 cycles, indicating its potential applications in LIBs.Conflicts of interest
The authors declare that they have no conflict of interest.Acknowledgements
This work was supported by the National Natural Science Foundation of China (Grant No. 21671182).References
- J. P. Holdren, Science, 2008, 319, 424–434 CrossRef CAS.
- S. E. Habas, H. A. S. Platt, M. F. A. M. V. van Hest and D. S. Ginley, Chem. Rev., 2010, 110, 6571–6594 CrossRef CAS PubMed.
- T. R. Cook, D. K. Dogutan, S. Y. Reece, Y. Surendranath, T. S. Teets and D. G. Nocera, Chem. Rev., 2010, 110, 6474–6502 CrossRef CAS PubMed.
- B. W. Hao and W. L. Xiong, Sci. Adv., 2017, 3, 9252 CrossRef PubMed.
- H. Yang, Y. Long, Y. Zhu, Z. Zhao, P. Ma, J. Jin and J. Ma, Green Chem., 2017, 19, 5809–5817 RSC.
- C. G. Moralesguio, L. A. Stern and X. Hu, Chem. Soc. Rev., 2014, 43, 6555–6569 RSC.
- C. Sun, Q. Dong, J. Yang, Z. Dai, J. Lin, P. Chen, W. Huang and X. Dong, Nano Res., 2016, 9, 2234–2243 CrossRef CAS.
- J. Greeley, T. F. Jaramillo, J. Bonde, I. B. Chorkendorff and J. K. Norskov, Nat. Mater., 2006, 5, 909–913 CrossRef CAS PubMed.
- Q. Liu, L. S. Xie, Z. Liu, G. Du, A. M. Asiri and X. P. A. Sun, Chem. Commun., 2017, 53, 12446–12449 RSC.
- X. Q. Ji, B. P. Liu, X. Ren, X. F. Shi, A. M. Asiri and X. P. Sun, ACS Sustainable Chem. Eng., 2018, 6, 4499–4503 CrossRef CAS.
- F. Li, Y. Bu, Z. Lv, J. Mahmood, G. F. Han, I. Ahmad, G. Kim, Q. Zhong and J. B. Baek, Small, 2017, 13, 1701167 CrossRef PubMed.
- F. Yang, Y. Chen, G. Cheng, S. Chen and W. Luo, ACS Catal., 2017, 7, 3824–3831 CrossRef CAS.
- H. T. Du, R. M. Kong, X. X. Guo, F. L. Qu and J. H. Li, Nanoscale, 2018, 10, 21617–21624 RSC.
- C. Wu, Y. J. Yang, D. Dong, Y. H. Zhang and J. H. Li, Small, 2017, 13, 1602873 CrossRef PubMed.
- S. Li, G. Zhang, X. Tu and J. Li, ChemElectroChem, 2018, 5, 701–707 CrossRef CAS.
- M. Sun, H. Liu, J. Qu and J. Li, Adv. Energy Mater., 2016, 6, 1600087–1600121 CrossRef.
- G. Zhang, G. C. Wang, Y. Liu, H. J. Liu, J. H. Qu and J. H. Li, J. Am. Chem. Soc., 2016, 138, 14686–14693 CrossRef CAS PubMed.
- P. Yu, L. Wang, Y. Xie, C. Tian, F. Sun, J. Ma, M. Tong, W. Zhou, J. Li and H. Fu, Small, 2018, 14, 1801717 CrossRef PubMed.
- X. Zhang, S. Liu, Y. Zang, R. Liu, G. Liu, G. Wang, Y. Zhang, H. Zhang and H. Zhao, Nano Energy, 2016, 30, 93–102 CrossRef CAS.
- W. Xiao, P. Liu, J. Zhang, W. Song, Y. P. Feng, D. Gao and J. Ding, Adv. Energy Mater., 2017, 7, 1602086 CrossRef.
- H. Huang, X. Feng, C. Du and W. Song, Chem. Commun., 2015, 51, 7903–7906 RSC.
- J. Zhuo, M. Cabanacevedo, H. Liang, L. Samad, Q. Ding, Y. Fu, M. Li and S. Jin, ACS Catal., 2015, 5, 6355–6361 CrossRef CAS.
- M. Caban-Acevedo, M. L. Stone, J. R. Schmidt, J. G. Thomas, Q. Ding, H. C. Chang, M. L. Tsai, J. H. He and S. Jin, Nat. Mater., 2015, 14, 1245–1251 CrossRef CAS PubMed.
- T. Wu, M. L. Stone, M. J. Shearer, M. J. Stolt, I. A. Guzei, R. J. Hamers, R. F. Lu, K. M. Deng, S. Jin and J. R. Schmidt, ACS Catal., 2018, 8, 1143–1152 CrossRef CAS.
- Y. Hu, F. Li, Y. Long, H. Yang, L. Gao, X. Long, H. Hu, N. Xu, J. Jin and J. Ma, J. Mater. Chem. A, 2018, 6, 10433–10440 RSC.
- B. Scrosati, J. Hassoun and Y. K. Sun, Energy Environ. Sci., 2011, 4, 3287–3295 RSC.
- A. Manthiram, B. Song and W. Li, Energy Storage Materials, 2017, 6, 125–139 CrossRef.
- Q. Xu, J. Y. Li, J. K. Sun, Y. X. Yin, L. J. Wan and Y. G. Guo, Adv. Energy Mater., 2017, 7, 1601481 CrossRef.
- H. Zhang, X. Huang, O. Noonan, L. Zhou and C. Yu, Adv. Funct. Mater., 2017, 27, 1606023 CrossRef.
- X. Zuo, J. Zhu, P. Müller-Buschbaum and Y. J. Cheng, Nano Energy, 2017, 31, 113 CrossRef CAS.
- K. Huo, L. Wang, C. Peng, X. Peng, Y. Li, Q. Li, Z. Jin and P. K. Chu, J. Mater. Chem., 2016, 4, 7585–7590 RSC.
- M. M. Rahman, I. Sultana, T. Yang, Z. Chen, N. Sharma, A. M. Glushenkov and Y. Chen, Angew. Chem., Int. Ed., 2016, 55, 16059 CrossRef CAS PubMed.
- W. Li, H. Li, Z. Lu, L. Gan, L. Ke, T. Zhai and H. Zhou, Energy Environ. Sci., 2015, 8, 3629 RSC.
- C. Kim, G. Hwang, J. W. Jung, S. H. Cho, J. Y. Cheong, S. Shin, S. Park and I. D. Kim, Adv. Funct. Mater., 2017, 27, 1605975 CrossRef.
- J. Yang, Y. Zhang, C. C. Sun, H. Z Liu, L. Q. Li, W. L. Si, W. Huang, Y. Yan and X. C. Dong, Nano Res., 2016, 9, 612–621 CrossRef CAS.
- Z. S. Zhang, J. Yang, Y. Nuli, B. F. Wang and J. Q. Xu, Solid State Ionics, 2005, 176, 693 CrossRef CAS.
- Y. Cui, M. Xue, Z. Fu, X. Wang and X. Liu, J. Alloys Compd., 2013, 555, 283–290 CrossRef CAS.
- S. Kong, Z. Jin, H. Liu and Y. Wang, J. Phys. Chem. C, 2014, 118, 25355–25364 CrossRef CAS.
- Y. Gu, Y. Xu and Y. Wang, ACS Appl. Mater. Interfaces, 2013, 5, 801–806 CrossRef CAS PubMed.
- Y. Chen, X. Li, K. Park, L. Zhou, H. Huang, Y. W. Mai and J. B. Goodenough, Angew. Chem., Int. Ed., 2016, 55, 15831–15834 CrossRef CAS PubMed.
- F. Han, C. Zhang, B. Sun, W. Tang, J. Yang and X. Li, Carbon, 2017, 118, 731–742 CrossRef CAS.
- J. Jiang, C. Wang, J. Zhang, W. Wang, X. Zhou, B. Pan, K. Tang, J. Zuo and Q. Yang, J. Mater. Chem. A, 2015, 3, 499–503 RSC.
- J. Zhou, H. Song, X. Chen, L. Zhi, S. Yang, J. Huo and W. Yang, Chem. Mater., 2009, 21, 2935 CrossRef CAS.
- L. Si, Z. Yuan, J. Liang, L. Hu, Y. Zhu and Y. Qian, J. Mater. Chem. A, 2014, 2, 9784 RSC.
- H. Li, X. Huang, L. Chen, Z. Wu and Y. Liang, Electrochem. Solid-State Lett., 1999, 2, 547 CrossRef CAS.
- S. C. Lyu, B. C. Liu, C. J. Lee, H. K. Kang, C. W. Yang and C. Y. Park, Chem. Mater., 2003, 15, 3951–3954 CrossRef CAS.
- J. T. Han, Y. H. Huang and J. B. Goodenough, Chem. Mater., 2011, 23, 2027 CrossRef CAS.
- J. S. Chen and X. W. Lou, Small, 2013, 9, 1877 CrossRef CAS PubMed.
- X. W. Lou, J. S. Chen, P. Chen and L. A. Archer, Chem. Mater., 2009, 21, 2868 CrossRef CAS.
- Y. Pan, K. Sun, S. Liu, X. Cao, K. Wu, W. C. Cheong, Z. Chen, Y. Wang, Y. Li, Y. Liu, D. Wang, Q. Peng, C. Chen and Y. Li, J. Am. Chem. Soc., 2018, 140, 2610–2618 CrossRef CAS PubMed.
- B. C. Qiu, L. J. Cai, Y. Wang, Z. Y. Lin, Y. P. Zuo, M. Y. Wang and Y. Chai, Adv. Funct. Mater., 2018, 28, 1706008 CrossRef.
- Z. Wang, Y. Lu, Y. Yan, T. Y. P. Larissa, X. Zhang, D. Wuu, H. Zhang, Y. Yang and X. Wang, Nano Energy, 2016, 30, 368–378 CrossRef CAS.
- Y. Su, Y. Zhu, H. Jiang, J. Shen, X. Yang, W. Zou, J. Chen and C. Li, Nanoscale, 2014, 6, 15080 RSC.
- M. Ibrahim, C. Marcelotgarcia, K. A. Atmane, E. Berrichi, L. M. Lacroix, A. Zwick, B. Warotfonrose, S. Lachaize, P. Decorse and J. Y. Piquemal, J. Phys. Chem. C, 2013, 117, 15808 CrossRef CAS.
- T. J. Chuang, C. R. Brundle and D. W. Rice, Surf. Sci., 1976, 59, 413–429 CrossRef CAS.
- J. Wang, Q. Yang, Z. Zhang and S. Sun, Chem. –Eur. J., 2010, 16, 7916–7924 CrossRef CAS PubMed.
- H. vanderHeide, R. Hemmel, C. F. vanBruggen and C. Haas, J. Solid State Chem., 1980, 33, 17–25 CrossRef CAS.
- X. Q. Ji, R. Zhang, X. F. Shi, A. M. Asiri, B. Z. Zheng and X. P. Sun, Nanoscale, 2018, 10, 7941–7945 RSC.
- J. Zhang, R. J. Cui, X. A. Li, X. H. Liu and W. Huang, J. Mater. Chem. A, 2017, 5, 23536–23542 RSC.
- T. Liu, L. Xie, J. Yang, R. Kong, G. Du, A. M. Asiri, X. Sun and L. Chen, ChemElectroChem, 2017, 4, 1840–1845 CrossRef CAS.
- H. Lei, M. Chen, Z. Liang, C. Liu, W. Zhang and R. Cao, Catal. Sci. Technol., 2018, 8, 2289–2293 RSC.
- S. Li, G. Zhang, X. Tu and J. Li, ChemElectroChem, 2018, 5, 701–707 CrossRef CAS.
- K. Zhang, T. Zhang, J. Liang, Y. Zhu, N. Lin and Y. Qian, RSC Adv., 2015, 5, 14828–14831 RSC.
- D. Brion, Appl. Surf. Sci., 1980, 5, 133 CrossRef CAS.
- X. F. Wang, Q. Y. Xiang, B. Liu, L. J. Wang, T. Luo, D. Chen and G. Z. Shen, Sci. Rep., 2013, 3, 2007 CrossRef PubMed.
- S. Suzuki, T. Kosaka, M. Saito, Y. Waseda, E. Matsubara and M. Oku, Scr. Mater., 1997, 36, 841 CrossRef CAS.
- N. K. Unsworth, I. Hancox, C. Argent Dearden, P. Sullivan, M. Walker, R. S. Lilley, J. Sharp and T. S. Jones, Org. Electron., 2014, 15, 2624 CrossRef CAS.
- J. Noh, E. Ito, K. Nakajima, J. Kim, H. Lee and M. Hara, J. Phys. Chem. B, 2002, 106, 7139 CrossRef CAS.
- M. Wang and K. B. Tang, Dalton Trans., 2019, 48, 3819–3824 RSC.
- H. M. Liao, R. N. S. Sodhi and T. W. Coyle, J. Vac. Sci. Technol., A, 1993, 11, 2681 CrossRef CAS.
- Y. Li, H. Wang, L. Xie, Y. Liang, G. Hong and H. Dai, J. Am. Chem. Soc., 2011, 133, 7296–7299 CrossRef CAS PubMed.
- Q. Ding, B. Song, P. Xu and S. Jin, Chem, 2016, 1, 699–726 CAS.
- Y. Li, S. Niu, D. Rakov, Y. Wang, M. Caban-Acevedo, S. Zheng, B. Song and P. Xu, Nanoscale, 2018, 10, 7291–7297 RSC.
- X. Li, Y. Fang, X. Lin, M. Tian, X. An, Y. Fu, R. Li, J. Jin and J. Ma, J. Mater. Chem. A, 2015, 3, 17392 RSC.
- J. Chang, Y. Ouyang, J. Ge, J. Wang, C. Liu and W. Xing, J. Mater. Chem. A, 2018, 6, 12353–12360 RSC.
- C. C. L. McCrory, S. Jung, J. C. Peters and T. F. Jaramillo, J. Am. Chem. Soc., 2013, 135, 16977–16987 CrossRef CAS PubMed.
- C. Tang, R. Zhang, W. Lu, Z. Wang, D. Liu, S. Hao, G. Du, A. M. Asiri and X. Sun, Angew. Chem., 2017, 129, 860–864 CrossRef.
- B. Losiewicz, A. Budniok, E. Rowinski, E. Lagiewka and A. Lasia, Int. J. Hydrogen Energy, 2004, 29, 145–157 CrossRef CAS.
- A. R. J. Kucernak and V. N. Naranammalpuram Sundaram, J. Mater. Chem. A, 2014, 2, 17435–17445 RSC.
- P. Jiang, J. Chen, C. Wang, K. Yang, S. Gong, S. Liu, Z. Lin, M. Li, G. Xia, Y. Yang, J. Su and Q. Chen, Adv. Mater., 2018, 30, 1705324 CrossRef PubMed.
- P. Jiang, Y. Yang, R. Shi, G. Xia, J. Chen, J. Su and Q. Chen, J. Mater. Chem. A, 2017, 5, 5475–5485 RSC.
- Y. Kim and J. B. Goodenough, J. Phys. Chem. C, 2008, 112, 15060–15064 CrossRef CAS.
- Q. Wang, L. Jiao, Y. Han, H. Du, W. Peng, Q. Huan, D. Song, Y. Si, Y. Wang and H. Yuan, J. Phys. Chem. C, 2011, 115, 8300–8304 CrossRef CAS.
- X. Li, J. Liang, Y. Lu, Z. Hou, Q. Cheng, Y. Zhu and Y. Qian, Angew. Chem., Int. Ed., 2017, 56, 2937–2941 CrossRef CAS PubMed.
- Q. Liang, Y. Zheng, C. Du, Y. Luo, J. Zhang, B. Li, Y. Zong and Q. Yan, Small Methods, 2017, 1700304, DOI:10.1002/smtd.201700304.
- Z. Gao, N. Song, Y. Zhang and X. Li, Nano Lett., 2015, 15, 8194–8203 CrossRef CAS PubMed.
- Z. Yu, J. Song, M. L. Gordin, R. Yi, D. Tang and D. Wang, Adv. Sci., 2015, 2, 1400020 CrossRef PubMed.
Footnote |
| † Electronic supplementary information (ESI) available. See DOI: 10.1039/c9ra00869a |
| This journal is © The Royal Society of Chemistry 2019 |

