 Open Access Article
Optimised thermally driven molecular stability of an SCO metal complex for TEC Seebeck generation enhancement
Megat Muhammad Ikhsan Megat Hasnana,
Suhana Mohd Said *a,
Mohd Faizul Mohd Sabrib,
Siti Amira Mat Hussinc,
Norbani Abdullahc,
Nik Muhd Jazli Nik Ibrahima,
Yuzuru Miyazakid,
Mohd Faiz Mohd Salleha and
Noraisyah Mohd Shah
 a
a
aElectrical Engineering Department, Engineering Faculty, Universiti Malaya, 50603 Kuala Lumpur, Malaysia. E-mail: smsaid@um.edu.my
bMechanical Engineering Department, Engineering Faculty, Universiti Malaya, 50603 Kuala Lumpur, Malaysia
cChemistry Department, Science Faculty, Universiti Malaya, 50603 Kuala Lumpur, Malaysia
dDepartment of Applied Physic, Graduate School of Engineering, Tohoku University, 6-6-04, Aramaki Aza Aoba Aoba-ku, Sendai, Miyagi 980-8579, Japan
First published on 4th April 2019
Abstract
The thermoelectricity effect allows the generation of electrical potential in an electrolyte upon application of a thermal gradient. In the previous work, the spin crossover effect in metal complexes was shown to be beneficial for generating a high Seebeck coefficient due to the high entropy associated with the conformational change accompanying the spin state change. In this study, we examine the diamagnetic stability of a spin crossover material through optimisation of the ligand chain length. We show that the diamagnetic stability of the spin crossover material can enhance the thermoelectrochemical Seebeck effect through ligand optimisation of the octahedral structure. The increase of carbon chain length from C14 to C16 in the long alkyl chain of the N-donor ligand increased Seebeck generation in a Co(III)L16 complex to 1.94-fold that of a previously studied paramagnetic Co complex, and in a Fe(III)L16 complex to 3.43-fold that of a less diamagnetic Fe complex. We show with DSC studies of an Fe based octahedral complex that an endothermic absorption accompanies the spin crossover transition, which enhances the Seebeck coefficient of this metal complex. Thus, we can correlate the diamagnetic stabilisation with temperature. We therefore indicate a molecular design strategy for optimisation of a spin crossover metal complex.
Introduction
The thermoelectric (TE) phenomenon is shown by a solid state electronic material that converts a thermal gradient into electricity. This TE behaviour is also observed in thermo-electrochemical cells (TECs) which consist of two inert electrodes and an active redox material.1 The active redox material is dissolved in a solvent or ionic liquid. A temperature difference (ΔT) arises between the hot electrode and cold electrode which causes an imbalance of the redox reactions and generates an electromotive force (ΔV).2–8Recently, spin crossover (SCO) materials have been found to enhance the TE properties of several complexes.9–11 SCO complexes are attractive and valuable materials for stimuli (thermal-light) responsive devices, such as photocatalytic energy harvesting devices and photosensors.12–17 The highest Seebeck coefficients (Se) so far observed accompanied the change in the spin state of a Co2+/3+(bpy)3(NTf2)2/3 redox couple in a 3 methoxypropionitrile (MPN) solvent (2.19 mV K−1 for a 0.01 M solution).18 This was ascribed to a large entropy change (ΔS), which arose because the bond lengths for an octahedral complex in the high spin (HS) state are longer (weaker) compared to those of the low spin (LS) state. A larger ΔS results in a higher Se value. This electrochemical Seebeck effect in TEC is due to the difference in the entropy values (redox reaction entropy) at the hot and cold sides of the electrode.19 The reaction entropy during the redox reaction is related to the ratio of the potential difference between the electrodes and the temperature difference, as expressed in eqn (1)
 | (1) |
 | (2) |
ΔSspin = R![[thin space (1/6-em)]](https://www.rsc.org/images/entities/char_2009.gif) ln[(2S + 1)HS/(2S + 1)LS] ln[(2S + 1)HS/(2S + 1)LS]
| (3) |
Octahedral complexes of first-row transition-metal ions with labile electronic configurations (d4–d7) and ligands of intermediate field strengths have been studied previously to drive the SCO effect. These types of complex are central to high stability diamagnetic complexes that can enhance Seebeck generation from temperature differences in TECs.9–11 Fe complexes have been found to produce the highest Seebeck coefficients through agglomeration in the form of spherical micelles (average micelles diameter 100 nm) as shown in Fig. 1. The trapped charge carriers within the micelles enhance the diffusion activity thus enhancing both Seebeck and ionic conductivity compared to the active redox couple in the absence of agglomeration.9
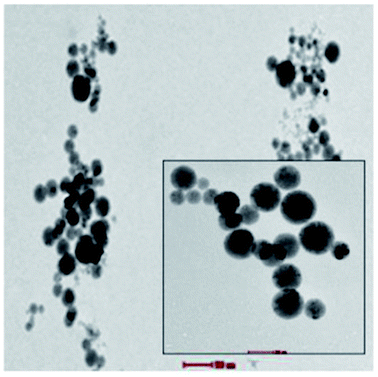 | ||
| Fig. 1 Cyro TEM analysis of micelles of 0.1 mM Fe complex that can trap the KI–KI3 redox active electrolyte in the high polarity MPN solvent. | ||
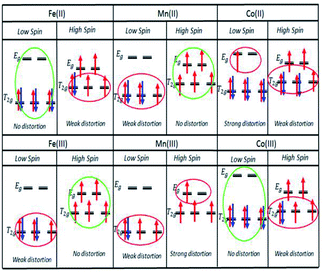
With respect to octahedral complexes, we expect the stability of an octahedral structure to be described by the Jahn–Teller theorem, in which the complex will suffer weak and strong Jahn–Teller effects if the electrons are unevenly occupied in the T2g and Eg orbitals, respectively, as shown in Fig. 2. If the T2g and Eg orbitals are evenly occupied, there will be no Jahn–Teller effect.
In this study, we continue our investigation by optimizing the ligand structure to design highly stable diamagnetic complexes for high Se generation. Weak field ligands stabilize the HS (maximum spin multiplicity) ground state, whilst strong field ligands stabilize the LS (minimum multiplicity) ground state. The coordinate bonds in the HS complexes are longer (weaker) than those in the LS complexes. The strategy for enhancing the Seebeck and power densities for TECs involves increasing the ligand field strength by increasing the ligand carbon chain length number in our previous octahedral structure. A longer chain length is expected to improve diamagnetic stability and thermal stability,9 and we use a neutral N-donor ligand (Cn = C14) and benzoate as the counter ion. In order to maintain an intermediate ligand field strength in the complexes to drive the reverse SCO effect, we use the maximum carbon chain length (C16) using a concept proposed by Hayami.22 He proposed that the long alkyl chain could produce a “hook” effect by which it could pull out the ligand from the metal centre in the HS state at room temperature. Upon application of temperature, the van der Waals forces between the alkyl chains are expected to break, allowing for a closer approach of the ligand to the metal centre to drive a stable LS state.
In this paper, the following hypotheses will be investigated:
(a) An increased ligand carbon chain length in the octahedral structure design causes a reverse SCO effect with increasing temperature.
(b) The spin state transition of the octahedral metal complex determines the stability of the complex.
(c) Ultimately, the SCO effect detects stability as a function of temperature based on the Jahn–Teller distortion.
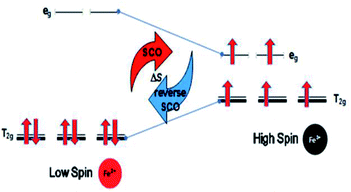
(d) The optimum Seebeck generation is for an Fe ion complex. This is greater than those for Mn and Co ion complexes since Fe ions should not suffer weak or strong distortions due to evenly occupied orbitals in the transitions for normal SCO (Fe(II)LS to Fe(III)HS) and reverse SCO (Fe(III)HS to Fe(II)LS), as shown in Fig. 3.
Experimental
Ligand (L16) preparation
A mixture of 4-HOC5H4N (5.01 g, 52.70 mmol), K2CO3 (17.28 g, 125.10 mmol) and KI (0.33 g, 2.00 mmol) in DMF (200 mL) was stirred vigorously in a round bottomed flask at room temperature. CH3(CH2)15Br (15.25 g, 50.0 mmol) was added portion-wise to the magnetically stirred solution. The reaction mixture was then refluxed for 72 hours, and left to cool at room temperature overnight. Distilled water was added into the mixture and it was left overnight. A yellow solid formed, which was collected by suction filtration and washed with distilled water. The product was a white powder and its yield was 12.98 g (81.27%). The structure of the ligand L16 was ascertained using CHN elemental analyses, nuclear magnetic resonance (1H-NMR) spectroscopy and Fourier transform infrared (FTIR) spectroscopy.Preparation of SCO complexes
A 20 mL solution of L16 in CHCl3 was prepared and then it was added portion-wise to three different magnetically stirred suspensions: Co(C6H5COO)2(cyclam)(C6H5COO), Fe(C6H5COO)2(cyclam)·2H2O and Mn(C6H5COO)2(cyclam)·7H2O.The structural formulae of the prepared complexes were deduced using a combination of carbon, hydrogen and nitrogen (CHN) elemental analyses, FTIR, 1H-NMR, ultra violet (UV-vis) spectroscopy and superconducting quantum interference device (SQUID) magnetometry.
The prepared complexes were then dissolved in either DMSO (Mn and Co complexes) or MPN (Fe complexes) to form 1 mM TEC solutions in the presence of 1 mM KI–KI3 as a redox active material and 0.1 M TBATFB as the supporting electrolyte.
Structural analyses
The CHN elemental analyses were recorded on a PerkinElmer PE 2400 Series II CHNS/O analyser and Thermo-Finnigan Flash EA 110. A small amount of each sample (1.5–2.0 mg) was placed in a tin capsule with dimensions of 5 mm × 8 mm. The weighed samples were wrapped and then folded into smaller pieces before being placed in the analyser.The FTIR spectra were recorded neat from 4000–400 cm−1 at room temperature on a PerkinElmer 400 FT-IR/FT-IR Spectrometer with a Pike 22107 Technologies GladiATR attachment.
Thermal analysis
The thermal stabilities of the complexes were determined by thermogravimetry analysis (TGA). The thermogravimetric traces were recorded using a Pyris Diamond TG/DTA PerkinElmer instrument. An empty ceramic pan was placed in the holder, and then tarred. Each sample (about 4 mg) was loaded onto the pan and its weight was recorded. The spectra were recorded in the temperature range 303–1173 K under N2 at a flow rate of 293 K min−1.The differential scanning calorimetry (DSC) was performed on a METTLER TOLEDO DSC 822. Each sample (about 4.0 mg) was weighed in an aluminium pan by using an external microbalance and then it was placed inside the DSC heating stage. The scans were recorded for one heating and cooling cycle in the temperature range of 298–390 K. The heating and cooling rates were 5 °C min−1.
Magnetic analysis
The magnetic properties of the complexes can be inferred by 1H-NMR spectroscopy. Diamagnetic complexes are NMR active, and therefore produce well-resolved 1H-NMR signals. Paramagnetic complexes are partially NMR active, and therefore do not produce well-resolved 1H-NMR signals (peaks are broadened and some peaks are missing) due to the unfavourable electronic relaxation times.In order to investigate the magnetic properties of the complexes, SQUID magnetometer analysis was also used to measure magnetic susceptibility values as a function of temperature.
UV-vis spectroscopy
The UV-vis spectra were recorded from 1000 nm to 300 nm on a Shimadzu UV-vis NIR 3600 spectrophotometer. An exactly known amount of each sample (about 5 mg) was dissolved in 10 mL solvent and then placed into a 1 cm quartz cuvette. The absorbance spectrum was recorded against the solvent background with a fast scan rate. The molar absorptivity (ε) was calculated using the Beer–Lambert law as expressed in eqn (3)| A = εcl | (4) |
Non-isothermal Seebeck measurement
The Seebeck coefficients for the complexes were measured using a non-isothermal two beaker experimental setup1,2,23–29 for three cycles in which Tcold was 305 K and Thot was 300–350 K. The temperature for every measurement was confirmed using a thermocouple type-K. The complexes (1 mM) were dissolved in 10 mL of DMSO solvent (Co and Mn) or 10 mL of MPN (Fe) in the presence of 0.1 M TBATFB as the supporting electrolyte and 1 mM KI–KI3 as the redox couple. The temperature gradient was confirmed using a thermocouple type-K.Power density measurement
The power measurements were made using a high input impedance digital multimeter (Agilent 34461A) and a resistor box with a resistance range of 1 Ω to 10 MΩ. The samples were filled into fabricated TEC devices and thermocouples were used as the temperature probes to confirm the temperature gradient. The power generated using Pt as the active working electrode (area = 1 cm2) at the hot side and the cold side was measured in steady state conditions with different temperature gradients. The lower electrode was heated using a ceramic heater while the upper electrode was exposed to the air flow from a fan for a natural air convection heat sink. The temperatures were measured using a type-K thermocouple that measured the temperature of the wafer surface at both the cold side and the hot side. All measurements were taken over 5 cycles.TEC device fabrication
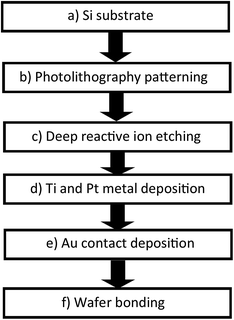
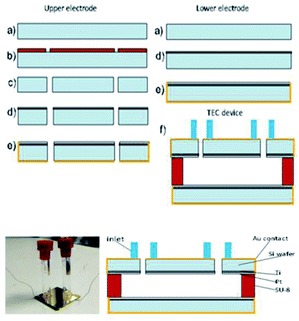
In this study, we measured the power density for the complex which possessed the highest Seebeck coefficient in the TEC devices. The TEC devices were fabricated using micromachining technology using the process flow shown in Fig. 4. Silicon wafer substrates (2 × 2 cm2) of 300 μm thickness were used as the base material due to their high thermal conductivity (148 W m−1 K−1) for fast heat transfer and fast steady state response. SU-8 dry film resist, which has low thermal conductivity (0.2 W m−1 K−1), was used as an intermediate layer to maintain the thermal gradient across the TEC. First, the Si wafer was dry etched (hole diameter = 0.5 mm) using high rate (800 W coil power, passivation gas: C4F8 140 sccm flow, etching gas: SF6 140 sccm flow, pressure 3.7–9 Pa) deep reactive ion etching (RIE) (refer to Fig. 5(b and c)) after the photolithography process (refer to Fig. 5(a and b)) using OFPR 300 cp as the positive photo resist mask (refer to Fig. 5(a–c)). A hole was made as an inlet for the TEC device. Next, the Si wafer with the hole as the upper electrode, and a Si wafer without a hole as the lower electrode, were sputtered using a SHIBAURA sputter machine to deposit a Ti layer with a thickness of 23.6 nm (refer to Fig. 5(d)) and a Pt layer with a thickness of 420 nm as the redox active area. The opposite side of the Si wafer was deposited with an Au layer of thickness 120 nm which also connected to the side of the Si wafer as a Pt–Au electrical contact (refer to Fig. 5(e)). As shown in Fig. 5(f), the upper and lower electrodes were assembled using a patterned 300 μm thickness SU-8 dry film resist to obtain a 300 μm electrode separation, and using 4 layers of SU-8 dry film to obtain a 1 mm electrode separation. The SU-8 dry film was laminated first for each layer on the lower electrode at a temperature of 65 °C for 5 minutes (soft bake) before both the upper and the lower electrodes were clamped and heated in the furnace at 95 °C for 1 hour (hard baked wafer bonding process). For ease of TEC material filling, 1 cm of a Pyrex glass tube with a 5 mm diameter inlet was bonded to the hole on the Si wafer as the inlet and a rubber cap was used to enclose the inlet after the filling process. The filling process was done in vacuum conditions using a glove box to avoid the formation of micro bubbles inside the TEC device.Results and discussion
Ligand 16 characterisation
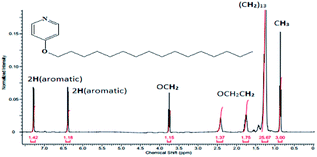
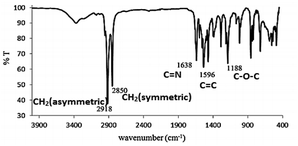
The results of CHN elemental analyses of the ligand (76.0% C; 13.1% H; 3.9% N) were in good agreement with those calculated for the empirical formula C12H37NO (76.5% C; 12.6% H; 3.3% N; formula weight 337.52 g mol−1). Fig. 6 shows the 1H-NMR spectrum for L16 in which the assignments for the ligand structure are labelled based on the integral of the observed chemical shifts.The FTIR spectrum of L16 in Fig. 7 shows two strong peaks at 2918 cm−1 and 2850 cm−1 for CH2 asymmetric and symmetric stretching, respectively, while strong peaks at 1638 cm−1, 1596 cm−1 and 118 cm−1 are assigned to aromatic C![[double bond, length as m-dash]](https://www.rsc.org/images/entities/char_e001.gif) N, C
N, C![[double bond, length as m-dash]](https://www.rsc.org/images/entities/char_e001.gif) C and C–O–C stretching, respectively, in good agreement with the structural formula of L16 as deduced from the CHN elemental analyses and 1H-NMR.
C and C–O–C stretching, respectively, in good agreement with the structural formula of L16 as deduced from the CHN elemental analyses and 1H-NMR.
Preparation of Fe, Mn and Co complexes
The formulae for the complexes with the new chain ligand L16 were deduced as shown in Table 1; the complexes with ligand L14 have been described in our previous work.9[Co(cyclam)(L16)2](C6H5COO)3·4H2O whose chemical formula was based on the results of elemental analyses (65.7% C; 9.5% H; 6.0% N), was consistent with the chemical formula CoC73H121N6O12 (65.7% C; 9.1% H; 6.3% N; formula weight, 1333.71 g mol−1).
For [Fe(cyclam)(L16)2](C6H5COO)3]·4H2O, the CHN analyses (65.3% C; 10.0% H; 6.0% N) were in good agreement with those calculated for C73H121FeN6O12 (65.9% C; 9.2% H; 6.3% N; formula weight, 1330.6 g mol−1).
The elemental analyses of [Mn(cyclam)(L16)(H2O)](C6H5COO)3·3H2O (61.2% C; 8.8% H; 6.4% N) were in good agreement with those calculated for the chemical formula C52H84MnN5O11 (61.8% C; 8.4% H; 6.9% N; formula weight, 1010.2 g mol−1).
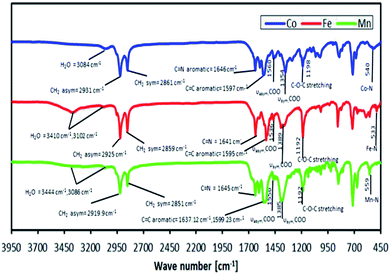
It was found from the CHN elemental analyses that the newly synthesised complexes had a difference in the number of mol of bound lattice water and number of mol of benzoate (C6H5COO−) counter ions compared to those found in our previous study, which suggested that the valence charges of the complexes were metal 2+ and metal 3+ for L14 and L16 respectively. The actual binding modes of a RCOO− ion were inferred from FTIR spectroscopy, as shown in Fig. 8, based on the difference (Δ) in the values of the asymmetric vibration of the COO group (vasym) and the symmetric vibration of the COO group (vsym), where ΔCOO = 206 cm−1, ΔCOO = 147 cm−1 and ΔCOO = 183 cm−1 for Co, Fe and Mn complexes, respectively. Thus, it is suggested that a free (non-coordinated) C6H5COO− ion binding mode exists for the complexes.
Thermal properties
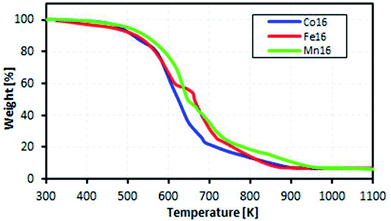
The motivation for the thermal analysis was to demonstrate the feasibility of the ionic L16 complexes for a real-life application of low-waste heat energy harvesting (below 100 °C).Fig. 9 shows the measured mass loss of the complexes as a function of temperature. The complexes were found to be stable in the temperature range 300–400 K. Thus, we inferred that the complexes would be stable for TEC application in the temperature range 300–400 K. From TGA, the decomposition temperatures of the complexes were 420 K, 417 K and 413 K for Co, Fe and Mn, respectively, due to the loss of lattice-coordinated H2O.
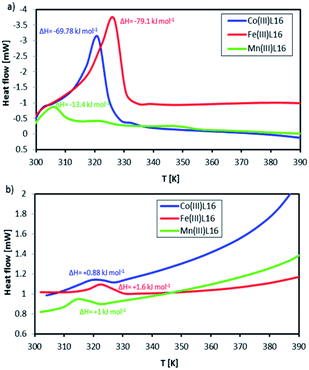
Fig. 10 shows DSC scans for the L16 complexes recorded in one successive heating–cooling cycle within the temperature range 300–392 K, which is below the TGA weight loss temperatures. Co showed a strong endothermic peak at 318 K (ΔH = +93.1 kJ mol−1) which was assigned to its melting temperature. Upon cooling, there was a weak exothermic peak at 328 K (ΔH = −1.17 kJ mol−1). The Mn complex showed three endothermic peaks at onset (i) (T = 303 K, ΔH = +13.6 kJ mol−1), (ii) (T = 321 K, ΔH = +1.0 kJ mol−1) and (iii) (T = 348 K, ΔH = +1.1 kJ mol−1). Upon cooling, only one exothermic peak at (i) (T = 318 K, ΔH = −1.1 kJ mol−1) was evident. Fe showed a strong and broad endothermic peak at 328 K (ΔH = +112.1 kJ mol−1) which was assigned to the breaking of strong bonds. Upon cooling, there was only one exothermic peak at (i) (T = 323 K, ΔH = −2 kJ mol−1). Thus, Fe showed the highest thermal stability followed by Co and then Mn. These observations can be correlated to the fact that the FeL16 complex is the most stable diamagnetic complex and hence provides the largest entropy change accompanying the spin state transition and correspondingly, the highest Seebeck coefficient. Notably, there is a strong difference between its endothermic peak and exothermic peak. This will have significance for applications since the complex will absorb heat as convection at the cold side of the TEC when it is heated, which will aid the completion of the redox cycle in the TEC and generate a high entropy difference, thus increasing the Seebeck coefficient. The entropy differences ΔS calculated from the differences of the endothermic and exothermic entropy changes for FeL16, CoL16 and MnL16 were 0.34, 0.29 and 0.04834 kJ mol−1 K−1, respectively, thus showing that Fe gave the highest ΔS when compared to the Co and Mn complexes. From the calculated entropy we deduced that the magnitude of Se generated as a function of transition metal type would follow the order Fe > Co > Mn. It was also found that the heat capacity change for the endothermic–exothermic transition for Fe was the highest at 16.14 kJ mol−1 followed by Co at 7 kJ mol−1 and Mn at 0.96 kJ mol−1.
Magnetic properties
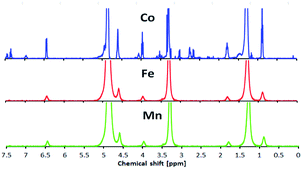
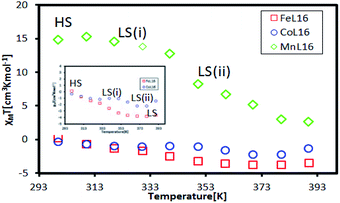
Fig. 11 shows 1H-NMR spectra for the Co, Mn and Fe complexes at room temperature. The Co complex showed a peak for the organic ligand, suggesting that it was a diamagnetic complex (3d6; LS). However, Fe and Mn showed several broad peaks which indicated paramagnetism at room temperature.The temperature dependence of the SQUID magnetometry measurements was analysed, as shown in Fig. 12. At room temperature (298 K), the Co complex showed diamagnetic (LS) behaviour (χMT = −0.314 cm3 K mol−1) while Fe (χMT = +0.14 cm3 K mol−1) and Mn (χMT = +14.7 cm3 K mol−1) were paramagnetic; this was in good agreement with the magnetism of the complexes at room temperature found from 1H-NMR. All complexes showed a HS to LS transition with increasing temperature due to the breaking of the van der Waals forces between the alkyl chains which allowed for a closer approach of the ligand to the metal centre, so driving a more stable LS state.30 The Mn complex showed paramagnetic behaviour over the temperature range 298–390 K suggesting a high Jahn–Teller distortion of the HS–LS transition. Interestingly, the paramagnetic Fe was shown to change to a stable diamagnetic (χMT = −3.31 cm3 K mol−1) state at the transition temperature of T = 350 K. Co showed a two-step LS state transition at the temperature of 303 K for LS (i) and at the temperature of 373 K for LS (ii), which was expected due to the loss of the H2O lattice bonding upon heating. Hence, it was inferred that in solution, the Fe and Co complexes formed a stable LS state in ionic form due to the solvation of the H2O lattice. A further investigation into the temperature dependent UV-vis properties is presented in the next section to investigate the SCO effect of the complexes in solution.
UV-vis properties
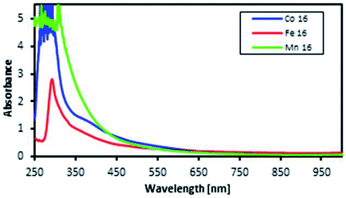
The motivation for performing UV-vis spectroscopy was to confirm the octahedral structure of the complexes through their absorption spectra. The UV-vis spectra are shown in Fig. 13. The Co complex continuously increased in absorbance from 800 nm to the shoulder of a d–d band (due to the electronic transition from 1A1g to 1T1g for a LS octahedral Co(III) complex) at about 550 nm and showed a charge transfer (CT) band at about 286 nm. Fe showed continuously increasing absorbance from 700 nm to a shoulder at 289 nm which was proposed for the overlapping electronic transitions from 2T2g to 2A2g, 2T1g, 2Eg and 2T2g for an octahedral LS Fe(III) complex. The Mn complex showed the same CT band as the Co complex; the absorbance increased continuously from 850 nm to a shoulder at 307 nm suggesting an octahedral LS Mn(III) complex.This work was extended by conducting molar absorption (ε) analysis as a function of temperature to understand the SCO/reverse SCO capability and reversibility behaviour of the complexes when they became ionic complexes in solution. The absorption spectra of the Fe(III)L16, Mn(III)L16 and Co(III)L16 complexes in solution at different temperatures are shown in Fig. 14. The spectra clearly show the change in intensities of the spin allowed transitions, due to the HS to LS transitions and vice versa. The ε values (863 M−1 cm−1) remained unchanged for the Co(III)L16 complex in solution in the first heating cycle within the temperature range 300–305 K. Then, after 305 K, the molar absorption decreased to 645 M−1 cm−1 and remained unchanged upon further heating to 343 K. Upon cooling and reheating, the molar absorption remained unchanged showing that the Co(III)L16 complex could not change to a LS state once it had become HS. Thus the Co(III)L16 complex showed an irreversible SCO behaviour in solution (LS to HS on heating). Due to this irreversible SCO behaviour, a HS state of Co(III)L16 in TEC was proposed for both oxidation and reduction after heating. Thus the complex is expected to suffer only weak Jahn–Teller distortions in contrast to the previous9 Co(II)L14 which suffered weak Jahn–Teller distortions for LS Co(II)L14 complexes and strong distortions for HS Co(III)L14 (refer to Fig. 2).
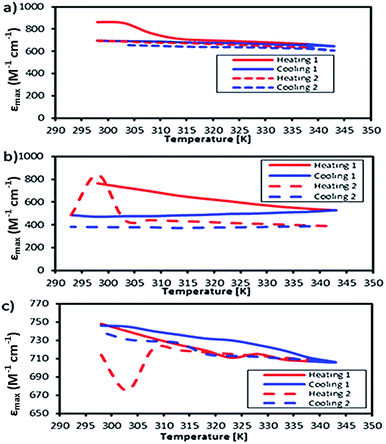 | ||
| Fig. 14 Temperature dependent molar absorption values of (a) Co, (b) Fe, and (c) Mn complexes in solution. | ||
The Fe(III)L16 complex showed decreased molar absorption values from 764 M−1 cm−1 to 528 M−1 cm−1 upon heating from 300 K to 343 K. Upon cooling, the molar absorption gradually decreased further to 471 M−1 cm−1 and then remained constant within the temperature range 300–294 K. Upon reheating, the value of ε abruptly increased to 840 M−1 cm−1 at 298 K and then decreased abruptly to 441 M−1 cm−1 and 388 M−1 cm−1 at 308 K and 343 K, respectively. Thus, the Fe(III)L16 complex was inferred to exhibit normal SCO behaviour with a LS to HS transition on heating and a reverse SCO (HS to LS) on cooling in solution. Upon reheating, the Fe(III)L16 demonstrated re-entrant behaviour (HS–LS–HS) transitions at 303 K. Thus, Fe(III)L16 showed reversible SCO and reverse SCO behaviour due to the good thermal stability (consistent with the significant endothermic peak found in the DSC analysis) of the long alkyl chain ligand. The Fe(III)L16 complex in TEC was proposed to have both molecular stability at the cold side (LS Fe2+) and the hot side (HS Fe3+) (refer to Fig. 2). Compared to the previous9 Fe(II)L14 complex that suffered a weak distortion (HS Fe2+) upon heating, the Fe(III)L16 complex was not expected to suffer Jahn–Teller distortions while at the same time having a high potential to increase reaction entropy by having different spin states at the hot and cold sides due to the reversibility of its SCO behaviour.
Mn(III)L16 shows ε values that gradually decreased to 705 M−1 cm−1 upon heating. Upon cooling, the value of ε gradually increased to 745 M−1 cm−1 and then abruptly decreased to 706 M−1 cm−1 at 343 K. Upon second reheating, the values abruptly decreased to 676 M−1 cm−1 at 303 K and then gradually increased to 729 M−1 cm−1 at 308 K. Upon second cooling from this temperature, the values gradually increased until 740 M−1 cm−1 at 298 K. Hence, the Mn complex showed re-entrant SCO behaviour in the first cooling mode between 303–298 K (HS–LS–HS) and upon second heating (LS–HS–LS) at 293–303 K. The Mn complex was inferred to exhibit reversible SCO behaviour in solution. Thus the Mn(III)L16 complex showed SCO and reverse SCO capability in the same way as the Fe(III)L16 complex, but the Mn(III)L16 complex possessed both weak distortions (LS Mn2+) and strong distortions (HS Mn3+) according to the Jahn–Teller rule (refer to Fig. 2) which is the same behaviour as shown by the previous9 Mn(II)L14 complex. Thus, the Mn(III)L16 complex is not expected to show much difference in its Seebeck generation capability compared to the previous Mn(II)L14 complex.
Seebeck coefficient
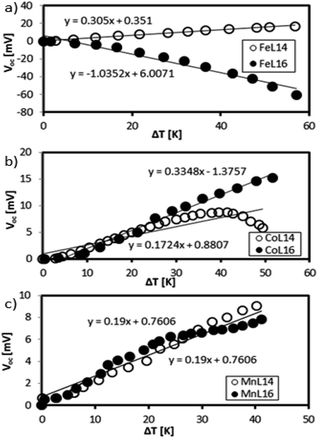
This section quantifies the Seebeck generation capabilities of the optimised Fe, Mn and Co complexes in the presence of low molarity (0.1 mM) reducing agent KI–KI3 and supporting electrolyte TBATFB. Fig. 15 shows the Seebeck measurements of Mn, Co, and Fe L14 complexes (as reported previously9) and L16 complexes.Fe shows a difference in the Se sign which is positive for Fe(II)L14 and negative for Fe(III)L16. The Co complex shows a stable positive Se for Co(III)L16 whilst Co(II)L14 shows a positive to negative Se transition at ΔT = 40 K. Mn shows a positive Se for both Mn(II)L14 and Mn(III)L16. The positive sign is due to the dominance of reduction and the negative sign is due to the dominance of oxidation.13
The Fe(III)L16 complex, which was the most stable complex, showed the highest Se magnitude (−1 mV K−1) followed by Co(III)L16 (+0.3 mV K−1) and Mn(III)L16 (0.6 mV K−1). The increase of carbon chain length (Cn = C14) in the ligand design resulted in an improvement in Se generation for Fe(III)L16 and Co(III)L16 which were 3.43 times and 1.94 times higher respectively compared to the Fe and Co L14 complexes (Fig. 15(a)). From the molecular Jahn–Teller distortion perspective, these enhancements are because the Fe and Co complexes possess stable molecular states in the LS–HS transition with applied temperature, thus increasing the entropy difference in the reaction. The strong distortion behaviour of the Mn complex, as expected, was not suitable for Se generation for the TEC devices, and hence showed no enhancement of Se value (+0.19 mV K−1 for both L14 and L16) (Fig. 15(b)).
From a thermodynamic perspective, the highest Se generation seen for the Fe complex was also due to the high heat capacity change and strong endothermic reaction that was shown by the DSC analysis. The stronger endothermic reaction of the Fe complex compared to the Co and Mn complexes was inferred to create strong convection at the hot side of the TEC device, hence increasing the entropy difference of the device. Thus, the highest entropy difference found for Fe followed by those for Co and Mn (0.34, 0.29 and 0.04834 kJ mol−1 K−1 respectively) obtained from the DSC analysis showed a significant correlation with the Se generation capability in the TEC devices. The distortion behaviour of the Mn complex was not suitable for Se generation in the TEC devices due to the reaction relaxation time, which shifted from high to low frequency, as found in our previous relaxation study.9
Power density
To prove the enhancement of TEC power generation by stability optimisation, a solution of the Fe(III)L16 complex was used to fill two fabricated TEC devices. The power density generated was compared with that generated by the less stable Fe(II)L14. The TEC devices had different electrode separations (1 mm and 0.3 mm). The temperature gradients observed for the TEC devices having 1 mm and 0.3 mm electrode separations were ΔT = 5 K and ΔT = 2 K, respectively, where the temperature applied at the hot side was 305 K and the temperature at the cold side was maintained by air convection. Each TEC device was connected to a resistor box as load to measure the power output. All measurements were done at steady state with a constant temperature gradient. Fig. 16 shows that the maximum power density (active electrode area = 1 cm2) for the TEC device having the 1 mm electrode separation was 5 times higher than the power density generated by the TEC device having the 0.3 mm electrode separation. The maximum power density for the isothermal TEC device filled with stable Fe(III)L16 (4.76 μW m−2) in this study was proven to be higher than the maximum power density found for the less stable Fe(II)L14 (2 μW m−2).9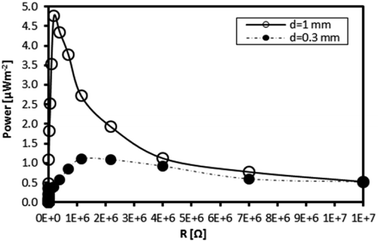 | ||
| Fig. 16 Power output density of the Fe L16 complex at ΔT = 5 K and ΔT = 2 K for TEC devices with electrode separations of 1 mm and 0.3 mm respectively. | ||
Conclusions
We have demonstrated Se enhancement through the stability optimisation of metal complexes by modulating ligand length and thus Jahn–Teller distortions. The Se of Co(III)L16 was 1.94 times higher than that of Co(II)L14 whilst the Se of Fe(III)L16 was 3.43 times higher than that of Fe(II)L14. The enhancement of molecular stability through ligand optimisation enhanced Se generation due to increased thermal stability, as shown from the strong endothermic peak in the DSC analysis. This was proven by the fact that no enhancement of Se generation was observed for the highly distorted Mn(II)L14 and Mn(III)L16 complexes. It was inferred that the high thermal stability was capable of enhancing natural convection and thus enhancing the entropy reaction in the TEC. Thus, this study gives a new perspective to the development of high Se TEC materials through ligand design strategies which are based on the optimisation of octahedral structures and their magnetic properties.Conflicts of interest
There are no conflicts to declare.Acknowledgements
The authors thank the University of Malaya for the research grants FG009-17AFR, GPF022A/2018, PG142-2016A and RK009-2018.Notes and references
- H. Y. Zhou, T. Yamada and N. Kimizuka, J. Am. Chem. Soc., 2016, 138, 10502–10507 CrossRef CAS PubMed.
- T. J. Abraham, D. R. MacFarlane and J. M. Pringle, Chem. Commun., 2011, 47, 6260–6262 RSC.
- H. Zhou and P. Liu, ACS Appl. Energy Mater., 2018, 1, 1424–1428 CrossRef CAS.
- S. Vassel and N. Vassel, Int. J. Heat Mass Transfer, 2017, 108, 2333–2337 CrossRef CAS.
- P. F. Salazar, S. Kumar and B. A. Cola, J. Appl. Electrochem., 2014, 44, 325–336 CrossRef CAS.
- E. V. Kuzminsky and O. A. Mashkin, Ukr. Khim. Zh., 1986, 52, 1055–1059 Search PubMed.
- H. Keppner, S. Uhl, E. Laux, L. Jeandupeux, J. Tschanz and T. Journot, Mater. Today: Proc., 2015, 2, 680–689 Search PubMed.
- J. T. Hupp and M. J. Weaver, Inorg. Chem., 1984, 23, 3639–3644 CrossRef CAS.
- M. M. I. M. Hasnan, N. Abdullah, S. M. Said, M. F. M. Salleh, S. A. M. Hussin and N. M. Shah, Electrochim. Acta, 2018, 261, 330–339 CrossRef CAS.
- N. Abdullah, N. L. M. Noor, A. R. Nordin, M. A. Halcrow, D. R. MacFarlane, M. A. Lazar, J. M. Pringle, D. W. Bruce, B. Donnio and B. Heinrich, J. Mater. Chem. C, 2015, 3, 2491–2499 RSC.
- N. Abdullah, M. H. Elsheikh, N. M. J. N. Ibrahim, S. M. Said, M. F. M. Sabri, M. H. Hassan and A. Marlina, RSC Adv., 2015, 5, 50999–51007 RSC.
- M. Peng, Z. Wen, M. Shao and X. Sun, J. Mater. Chem. C, 2017, 5, 7521–7526 RSC.
- X. Niu, H. Zhu, X. Liang, Y. Guo, Z. Li and Y. Mai, Appl. Surf. Sci., 2017, 426, 1213–1220 CrossRef CAS.
- N. B. H. Mohamed, N. B. Brahim, R. Mrad, M. Haouari, R. B. Chaâbane and M. Negrerie, Anal. Chim. Acta, 2018, 1028, 50–58 CrossRef PubMed.
- X. Ma, Q. Xiang, Y. Liao, T. Wen and H. Zhang, Appl. Surf. Sci., 2018, 457, 846–855 CrossRef CAS.
- G. Dai, H. Zou, X. Wang, Y. Zhou, P. Wang, Y. Ding, Y. Zhang, J. Yang and Z. L. Wang, ACS Photonics, 2017, 4, 2495–2503 CrossRef CAS.
- L. Cheng, Q. Xiang, Y. Liao and H. Zhang, Energy Environ. Sci., 2018, 11, 1362–1391 RSC.
- T. J. Abraham, D. R. MacFarlane and J. M. Pringle, Energy Environ. Sci., 2013, 6, 2639–2645 RSC.
- M. F. Dupont, D. R. MacFarlane and J. M. Pringle, Chem. Commun., 2017, 53, 6288–6302 RSC.
- V. N. Sokolov, A. A. Pribochenko and L. P. Safonova, Russ. J. Electrochem., 2006, 42, 969–973 CrossRef CAS.
- Y. Katayama, S. Nakayama, N. Tachikawa and K. Yoshii, J. Electrochem. Soc., 2017, 164, H5286–H5291 CrossRef CAS.
- S. Hayami, Y. Komatsu, T. Shimizu, H. Kamihata and Y. N. Lee, Coord. Chem. Rev., 2011, 255, 1981–1990 CrossRef CAS.
- T. A. Siddique, S. Balamurugan, S. M. Said, N. A. Sairi and W. M. D. W. Normazlan, RSC Adv., 2016, 6, 18266–18278 RSC.
- M. Inagaki, E. Itoh and A. Tanaka, Synth. Met., 1990, 35, 383–385 CrossRef CAS.
- S. W. Hasan, S. M. Said, M. F. M. Sabri, A. S. Abu Bakar, N. A. Hashim, M. M. I. M. Hasnan, J. M. Pringle and D. R. MacFarlane, Sci. Rep., 2016, 6 Search PubMed.
- A. Gunawan, H. C. Li, C. H. Lin, D. A. Buttry, V. Mujica, R. A. Taylor, R. S. Prasher and P. E. Phelan, Int. J. Heat Mass Transfer, 2014, 78, 423–434 CrossRef CAS.
- E. H. B. Anari, M. Romano, W. X. Teh, J. J. Black, E. Jiang, J. Chen, T. Q. To, J. Panchompoo and L. Aldous, Chem. Commun., 2016, 52, 745–748 RSC.
- L. Aldous, J. J. Black, M. C. Elias, B. Gelinas and D. Rochefort, Phys. Chem. Chem. Phys., 2017, 19, 24255–24263 RSC.
- N. Abdullah, N. L. M. Noor, A. R. Nordin, M. A. Halcrow, D. R. MacFarlane, M. A. Lazar, J. M. Pringle, D. W. Bruce, B. Donnio and B. Heinrich, J. Mater. Chem. C, 2015, 3, 2491–2499 RSC.
- S. Hayami, Y. Shigeyoshi, M. Akita, K. Inoue, K. Kato, K. Osaka, M. Takata, R. Kawajiri, T. Mitani and Y. Maeda, Angew. Chem. Int. Ed., 2005, 44, 4899–4903 CrossRef CAS PubMed.
| This journal is © The Royal Society of Chemistry 2019 |

