
 Open Access Article
 This Open Access Article is licensed under a Creative Commons Attribution-Non Commercial 3.0 Unported Licence
Solar driven reduction of CO2 using Pt–Cu/C as a catalyst in a photoelectrochemical cell: experiment and mechanism study
Xiaoxu Xuan,
Jun Cheng *,
Xiao Yang,
Junhu Zhou and
Kefa Cen
*,
Xiao Yang,
Junhu Zhou and
Kefa Cen
State Key Laboratory of Clean Energy Utilization, Zhejiang University, Hangzhou 310027, China. E-mail: juncheng@zju.edu.cn
First published on 5th April 2019
Abstract
Carbon supported nano-metal catalysts are expected to improve CO2 reduction selectivity and efficiency due to the addition of more active sites and enhancement of electron transport ability. In this study, HKUST-1 was pyrolyzed and decorated with Pt to prepare Pt–Cu/C catalysts. The catalytic effect of the catalysts with different Pt contents in the CO2 photoeletrochemical reduction reaction (CO2PRR) were compared. The total carbon atom conversion rate in CO2PRR experiments using Pt–Cu/C catalysts first increased to a peak when using 1.6 wt% Pt–Cu/C catalyst and then decreased with the increase of Pt content. The 1.6 wt% Pt–Cu/C catalyst showed good hydrogen evolution reaction (HER) inhibiting ability compared with other Pt–Cu/C catalysts. Density functional theory (DFT) calculations were conducted to give an insight into the CO2PRR mechanism on some possible active sites in Pt–Cu/C catalysts. The result demonstrated that HER was more likely to be inhibited on the Cu/Pt active surface and at the same time CO2PRR was promoted.
1. Introduction
Photoelectrochemical reduction of CO2, as an artificial photosynthesis method to solve both the problems of CO2 emissions and the shortage of clean energy, is attracting increasing attention.1–4 However, to date, the low activity of CO2 photoelectrochemical reduction (CO2PRR) catalysts still remains a big problem.5,6Heterogeneous catalysts have been widely used in various catalytic reactions,7–9 especially in CO2 reduction reactions.10,11 Previous studies demonstrated that the metal–metal interface played an important role in improving the activity and selectivity of the catalysts.5,12,13 The hybrid structures of the heterogeneous catalysts may lead to the enhancement of surface charge transfer ability, increasing the surface electron density and improving the adsorption of the intermediates at the surface.
Carbon supported metal nanoparticles heterogeneous catalysts are reported to have effectively catalytic ability to reduce CO2 to various products.2,14,15 The carbon supported Cu heterogeneous catalysts have been reported to have high catalytic efficiency in CO2PRR.6,16 By introducing noble metal to form noble metal–copper interface, the surface charge transfer ability will be enhanced, thus improving CO2PRR efficiency.
Metal organic frameworks (MOFs), with high surface area, hybrid features and tunable porosity, multi-functionality and good catalytic selectivity, have drawn increasing attention.2,17,18 The directly pyrolyzing of MOFs enables the easy synthesis of metal embedded in porous carbon catalyst.19,20
Herein, HKUST-1 was chosen as the precursor for synthesizing Pt–Cu/C catalyst in this research. A highly - dispersed HKUST-1 was synthesized using the one-pot thermal method. Then, the obtained Pt–Cu/C catalyst was achieved through pyrolyzation of pristine HKUST-1 under N2 ambient and reduction under H2 ambient. In order to study the effect of Pt content on the CO2PRR and find the optimum Pt content, Pt–Cu/C with various Pt contents were employed in the CO2PRR. Density functional theory (DFT) calculations were also conducted to clarify the mechanism of Pt–Cu/C catalytic effect on CO2PRR and inhibiting hydrogen evolution reaction.
2. Experiment
2.1 Preparation of and Pt-TNTs anode
Synthesis of Pt–Cu/C catalysts with various Pt contents. The pristine HKUST-1 was firstly synthesized based on a typical hydrothermal method. 0.93 g Cu(NO3)2·3H2O and 0.4 g PVP were dissolved in 30 mL DMF and ethanol mixture (VDMF
![[thin space (1/6-em)]](https://www.rsc.org/images/entities/char_2009.gif) :Vethanol = 1:1). 0.44 g 1,3,5-benzenetricarboxylic acid was dissolved in 30 mL DMF and ethanol mixture. Then the two as prepared mixtures were stirred for 10 min respectively, after which, the two mixtures were mixed together and stirred for another 30 min. The obtained mixture was then poured into a 200 mL Teflon-lined autoclave and kept under the temperature of 120 °C for 4 h. The obtained blue precipitate was washed by ethanol for several times to remove the extra reagents in the solution and then put into an 80 °C vacuum oven.
:Vethanol = 1:1). 0.44 g 1,3,5-benzenetricarboxylic acid was dissolved in 30 mL DMF and ethanol mixture. Then the two as prepared mixtures were stirred for 10 min respectively, after which, the two mixtures were mixed together and stirred for another 30 min. The obtained mixture was then poured into a 200 mL Teflon-lined autoclave and kept under the temperature of 120 °C for 4 h. The obtained blue precipitate was washed by ethanol for several times to remove the extra reagents in the solution and then put into an 80 °C vacuum oven.After drying for 24 h, the pristine HKUST-1 was put into a tube furnace and heated to 500 °C with a temperature rising rate of 5 °C min−1 under N2 atmosphere. The catalyst was kept under 500 °C for 3 h. HKUST-1 was pyrolyzed during the process and then the Cu/C catalyst was obtained.
Four Cu/C catalyst samples with the weight of 200 mg were then mixed with 20 mL of 0.1 g L−1, 0.2 g L−1, 0.3 g L−1 and 0.4 g L−1 H2PtCl6 solutions respectively. The four mixed solutions were put into an 80 °C drying oven for 2 h. In order to reduce Pt4+ to platinum, the dried catalysts were put into the tube furnace and heated to 350 °C with a temperature rising rate of 5 °C min−1 under H2 atmosphere and then kept under 350 °C for 2 h. The obtained catalysts were then marked as 1.2 wt% Pt–Cu/C, 1.6 wt% Pt–Cu/C, 1.8 wt% Pt–Cu/C and 2.3 wt% Pt–Cu/C according to the elemental mapping result.
Fabrication of Pt–Cu/C@CF cathode. 1.5 cm × 3 cm CF was used as cathode base. 45 mg of the four as prepared Pt–Cu/C catalysts were mixed with Nafion membrane solution and deionized water to prepare the inks. Then, the as prepared inks were brushed onto CF by using the drop-dry method.
Pt-TNTs (Pt-titanium nanotubes) anode. Pt-TNTs were synthesized follow the anode oxidation method. The residues on the surface of titanium foil were removed by ultrasonic before the oxidation-process. Then, the titanium foil was oxidized in the fluorine-containing ethylene glycol electrolyte (EG + 0.3% NH4F + 2 vol% H2O) for 3 h. The oxidized foil was washed with ethanol to remove extra reagents and placed into the muffle furnace to be calcined under the temperature of 450 °C for 3 h.
The TiO2 nanotubes will be turned into anatase after the calcination process. The obtained anatase TiO2 nanotubes on the titanium sheet was then deposited with Pt nanoparticles in H2PtCl6 solution (depositing current density: 2.5 mA cm−2) to improve its photocatalytic performance.
2.2 Characterization methods
X-ray diffraction (XRD) analysis was performed using an X'Pert PRO (PANalytical, Netherlands) diffractometer with Cu-Kα radiation. The morphology of Pt–Cu/C catalysts were characterized by field-emission scanning electron microscopy (FESEM) using SU-8010 (Hitachi, Japan) and Transmission Electron Microscope (TEM) using JEM-2100. Elemental mapping was conducted on the FESEM system equipped with an energy-dispersive X-ray (EDX) analytical system. The X-ray spectroscopy (XPS) analysis was conducted using a VG ESCALAB MARK II X-ray photoelectron spectrometer equipped with Mg-Kα radiation. Brunauer–Emmett–Teller (BET) analysis was conducted to measure the specific surface area of the catalyst on a Micromeritics ASAP 2020. Electrochemical characterizations were conducted on Ivium-4-stat electrochemical workstation.2.3 CO2 photoelectrochemical reduction in PEC
An H-shaped double chamber reaction cell was used to perform the CO2 photoelectrochemical reduction reaction. The two chambers was separated by a Nafion 117 membrane. Light was applied to anode Pt-TNTs to generate light current and 2 V voltage was applied between the anode and cathode during the reaction. The photocurrent was detected with Ivium-State electrochemical workstation, and sunlight was simulated using Perfectlight PLS-SXE300CUV xenon lamp.The anolyte was 0.5 M H2SO4, while the catholyte was 0.5 M NaHCO3 solution. The liquid and gas products were detected with Agilent GC7820A gas chromatography, while the acids in the liquid products were detected with Dionex Integrion HPIC.
2.4 Theoretical calculation method
DFT calculations in this research were performed using the plane-wave pseudopotential code Vienna Ab initio Simulation Package. The energy cut off of the system was set to 400 eV. The Brillouin zones of all the surfaces were sampled with a 3 × 3 × 1 gamma grid in optimization calculations. The self-consistent electronic convergence limit was set to 1 × 10⁻⁵ eV.Two models contain 4 layers of Pt (111) and in-plane periodicity of (3 × 3) Cu layer or CuO layer and a 4 × 4 × 4 Pt (111) periodic surface model are built for representing Cu/Pt, CuO/Pt interfaces and Pt surface respectively according to the characterization results.
3. Results and discussions
3.1 Characterizations of Pt–Cu/C catalysts with various Pt contents
XRD patterns of the Pt–Cu/C catalysts with various Pt contents were shown in Fig. 1(a). In Fig. 1(a), XRD patterns exhibited strong diffraction peaks at 43.3°, 50.4° and 74.2°, indicating the existence of Cu crystal in Pt–Cu/C catalyst. The magnified main characteristic peak of Cu [Fig. 1(b)] showed gradual sharpness of the peaks as the content of Pt decreased, indicating the decrease of crystal size of Cu particles as the Pt content increased. And the Cu particles in the four catalysts were calculated to be ∼110 nm, ∼100 nm, ∼80 nm and ∼60 nm respectively. Also, the characteristic peak showed slight shift to lower angle as the Pt content increased, this was due to the reason that the added Pt was alloyed with Cu nanoparticles, and the feature may be benefit to prevent Cu nanoparticles from alloying together. | ||
| Fig. 1 XRD patterns of 1.2 wt% Pt–Cu/C catalyst, 1.6 wt% Pt–Cu/C catalyst, 1.8 wt% Pt–Cu/C catalyst and 2.3 wt% Pt–Cu/C catalyst (a), magnified Cu characteristic peaks of the four catalysts (b). | ||
Diffraction peaks at 32.5°, 35.5°, 36.5°, 48.8°, 53.4°, 58.1°, 61.5°, 66.3° and 67.9° were also observed, and these peaks were corresponded to copper oxide and cuprous oxide.16,21,22 The diffraction peaks at 42.2° and 72.1° indicated the existence of Pt particles in the catalysts.
SEM micrographs of pristine HKUST-1 and Pt–Cu/C catalysts were exposed in Fig. 2. Accordingly, HKUST-1 [Fig. 2(a) and (b)] with octahedral shape was successfully synthesized, and Pt–Cu/C catalysts showed similar octahedral shape except that the surface of Pt–Cu/C catalyst was covered by nanoflakes. As the Pt content increased, more nanoflakes were observed on the surface. Elemental mapping was also conducted to evaluate the content of each element in the Pt–Cu/C catalysts. As shown in Table 1, the catalysts mainly contained four kinds of elements including Cu, Pt, C and O. The ratio of Pt atoms versus Cu atoms reached topmost of 0.0125 in 1.6 wt% Pt–Cu/C catalyst, indicating higher chance of Pt and Cu binding together in 1.6 wt% Pt–Cu/C catalyst compared with other Pt–Cu/C catalysts.
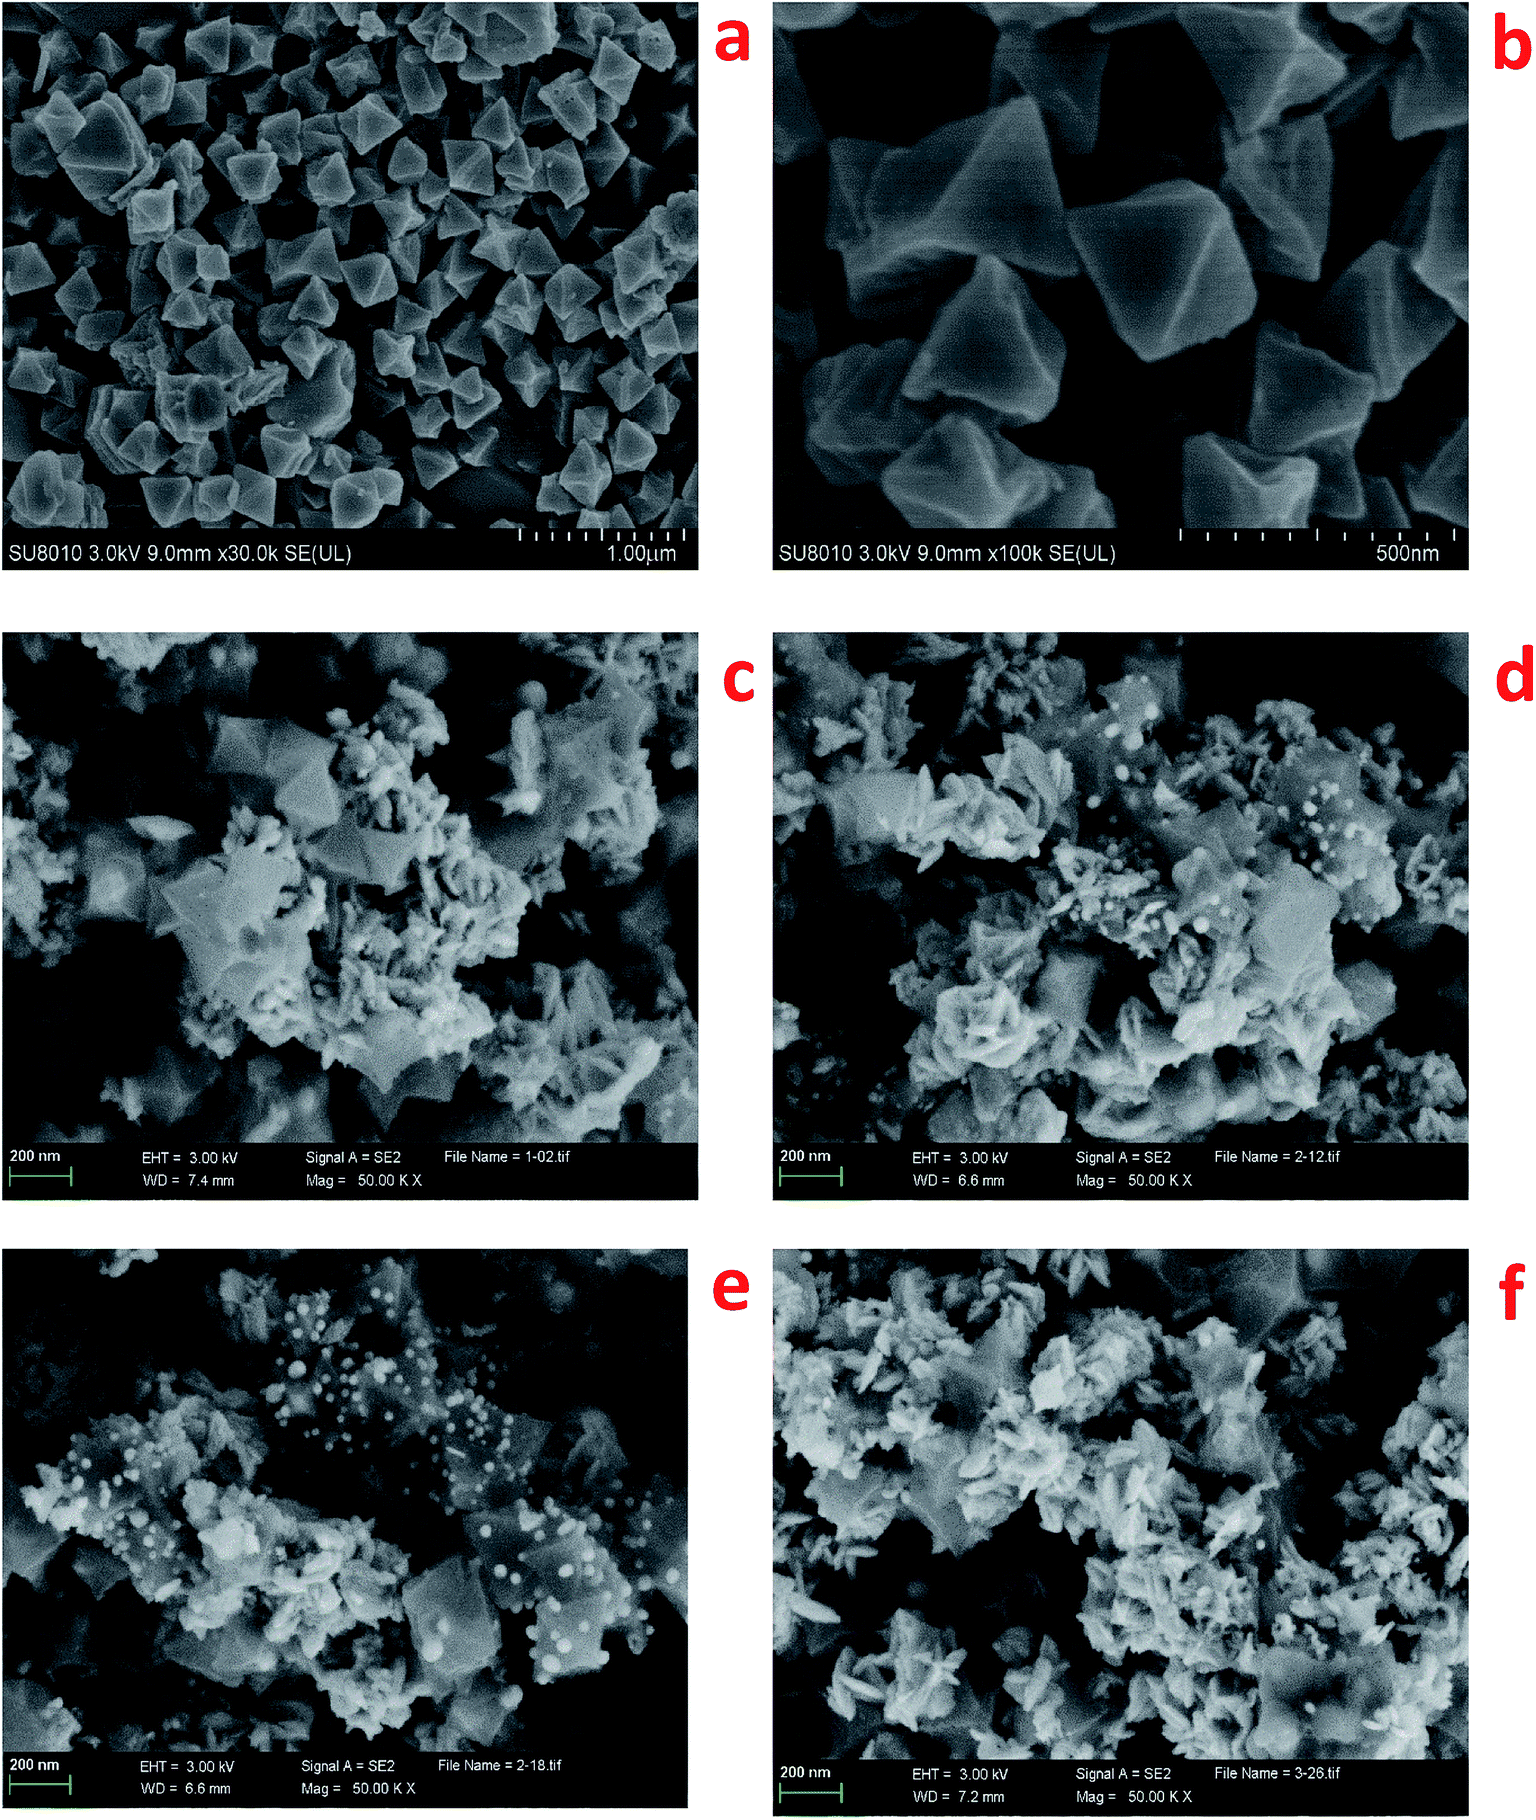 | ||
| Fig. 2 SEM micrographs of HKUST-1: ×30k (a), ×100k (b); Pt–Cu/C catalysts ×50k: 1.2 wt% Pt–Cu/C (c), 1.6 wt% Pt–Cu/C (d), 1.8 wt% Pt–Cu/C (e) and 2.3 wt% Pt–Cu/C (f). | ||
| Element | 1.2 wt% Pt–Cu/C (wt%) | 1.6 wt% Pt–Cu/C (wt%) | 1.8 wt% Pt–Cu/C (wt%) | 2.3 wt% Pt–Cu/C (wt%) |
|---|---|---|---|---|
| C | 40.2 | 43.33 | 35.21 | 25.04 |
| O | 16.74 | 12.21 | 10.22 | 7.78 |
| Cu | 41.86 | 42.83 | 52.73 | 64.93 |
| Pt | 1.2 | 1.63 | 1.84 | 2.25 |
To clarify the inner structure of the Pt–Cu/C catalysts, TEM characterization was conducted. According to Fig. 3, many nanopores were observed on the carbon base, indicating the porous property of the catalysts. Besides, many solid nanoparticles were embedded inside the Pt–Cu/C catalysts. And the nanoparticles in 1.2 wt% Pt–Cu/C, 1.6 wt% Pt–Cu/C, 1.8 wt% Pt–Cu/C were measured to be 150 nm, 90 nm, 70 nm respectively, which were corresponded to the XRD results, indicating that these solid nanoparticles were Cu nanoparticles. As many nanoflakes covered the surface of 2.3 wt% Pt–Cu/C catalyst, the nanoparticles inside the catalyst were difficult to be observed. As more nanoflakes appeared with the increase of Pt content, they would block the nanopores which lead to much lower mass transfer rate and reaction efficiency. To confirm the suspension, N2 sorption isotherms of the four catalysts were measured (Fig. 4). Accordingly, the BET surface area decreased from 94.1 m2 g−1 to 80.8 m2 g−1 as Pt content increased, which was in good agreement with the TEM characterization result.
 | ||
| Fig. 3 TEM micrographs of 1.2 wt% Pt–Cu/C (a), 1.6 wt% Pt–Cu/C (b), 1.8 wt% Pt–Cu/C (c) and 2.3 wt% Pt–Cu/C (d). | ||
 | ||
| Fig. 4 N2 sorption isotherms of the four Pt–Cu/C catalysts with various Pt contents. | ||
Elemental mapping (Fig. 5) was conducted to clarify the chemical compositions of the Pt–Cu/C catalyst. Accordingly, carbon formed the base of the catalyst with Cu nanoparticles inside the carbon matrix. Pt nanoflakes covered the surface of the catalyst. And oxygen could only be observed on partial area, which overlapped with the Cu area, indicating that these particles were CuxO. The presence of these oxides may be due to the reason that Cu nanoparticles were not stable and could easily be oxidized in the air.
 | ||
| Fig. 5 Elemental mapping of the Pt–Cu/C catalyst, TEM pattern (a), HAADF pattern of the Pt–Cu/C catalyst (b); C elemental mapping (c), Cu elemental mapping (d), Pt elemental mapping (e) and O elemental mapping of the selected area on the Pt–Cu/C catalyst (f). | ||
XPS measurement was performed to clarify the valence states and contents of the elements in Pt–Cu/C catalysts. C 1 s spectra of the four catalysts with various Pt contents were shown in Fig. 6. The XPS spectra were assigned to the corresponding species through a deconvolution fitting procedure. C1s XPS spectra for all the four catalysts were fitted into four components, located at around 281, 282, 283 and 285 eV, corresponding to C–Metal (C–M), C–C, C–O and C![[double bond, length as m-dash]](https://www.rsc.org/images/entities/char_e001.gif) O respectively. And according to the fitting result, 1.6 wt% Pt–Cu/C catalyst possessed the largest content of C–C (46.5% of the C element), which indicated better charge transfer ability.
O respectively. And according to the fitting result, 1.6 wt% Pt–Cu/C catalyst possessed the largest content of C–C (46.5% of the C element), which indicated better charge transfer ability.
 | ||
| Fig. 6 C 1 s XPS spectra of 1.2 wt% Pt–Cu/C catalyst (a), 1.6 wt% Pt–Cu/C catalyst (b), 1.8 wt% Pt–Cu/C catalyst (c), 2.3 wt% Pt–Cu/C catalyst (d). | ||
Cu 2p XPS spectra (Fig. 7) showed typical Cu 2p1/2 and Cu 2p3/2 peaks in all the four catalysts. The Cu 2p XPS spectrum of 1.2 wt% Pt–Cu/C [Fig. 7(a)] was fitted into two components, and the species with lower bonding energies (BE) was corresponded to Cu0, the other was assigned to Cu2+. With the increase of Pt content, Cu2+ satellite peaked at higher binding energy, indicating the increased content of Cu2+ species in 1.6 wt% Pt–Cu/C, 1.8 wt% Pt–Cu/C and 2.3 wt% Pt–Cu/C. Moreover, as the content of Pt increased, the peaks shifted to lower binding energies, indicating the increase of Cu–Pt bonds.
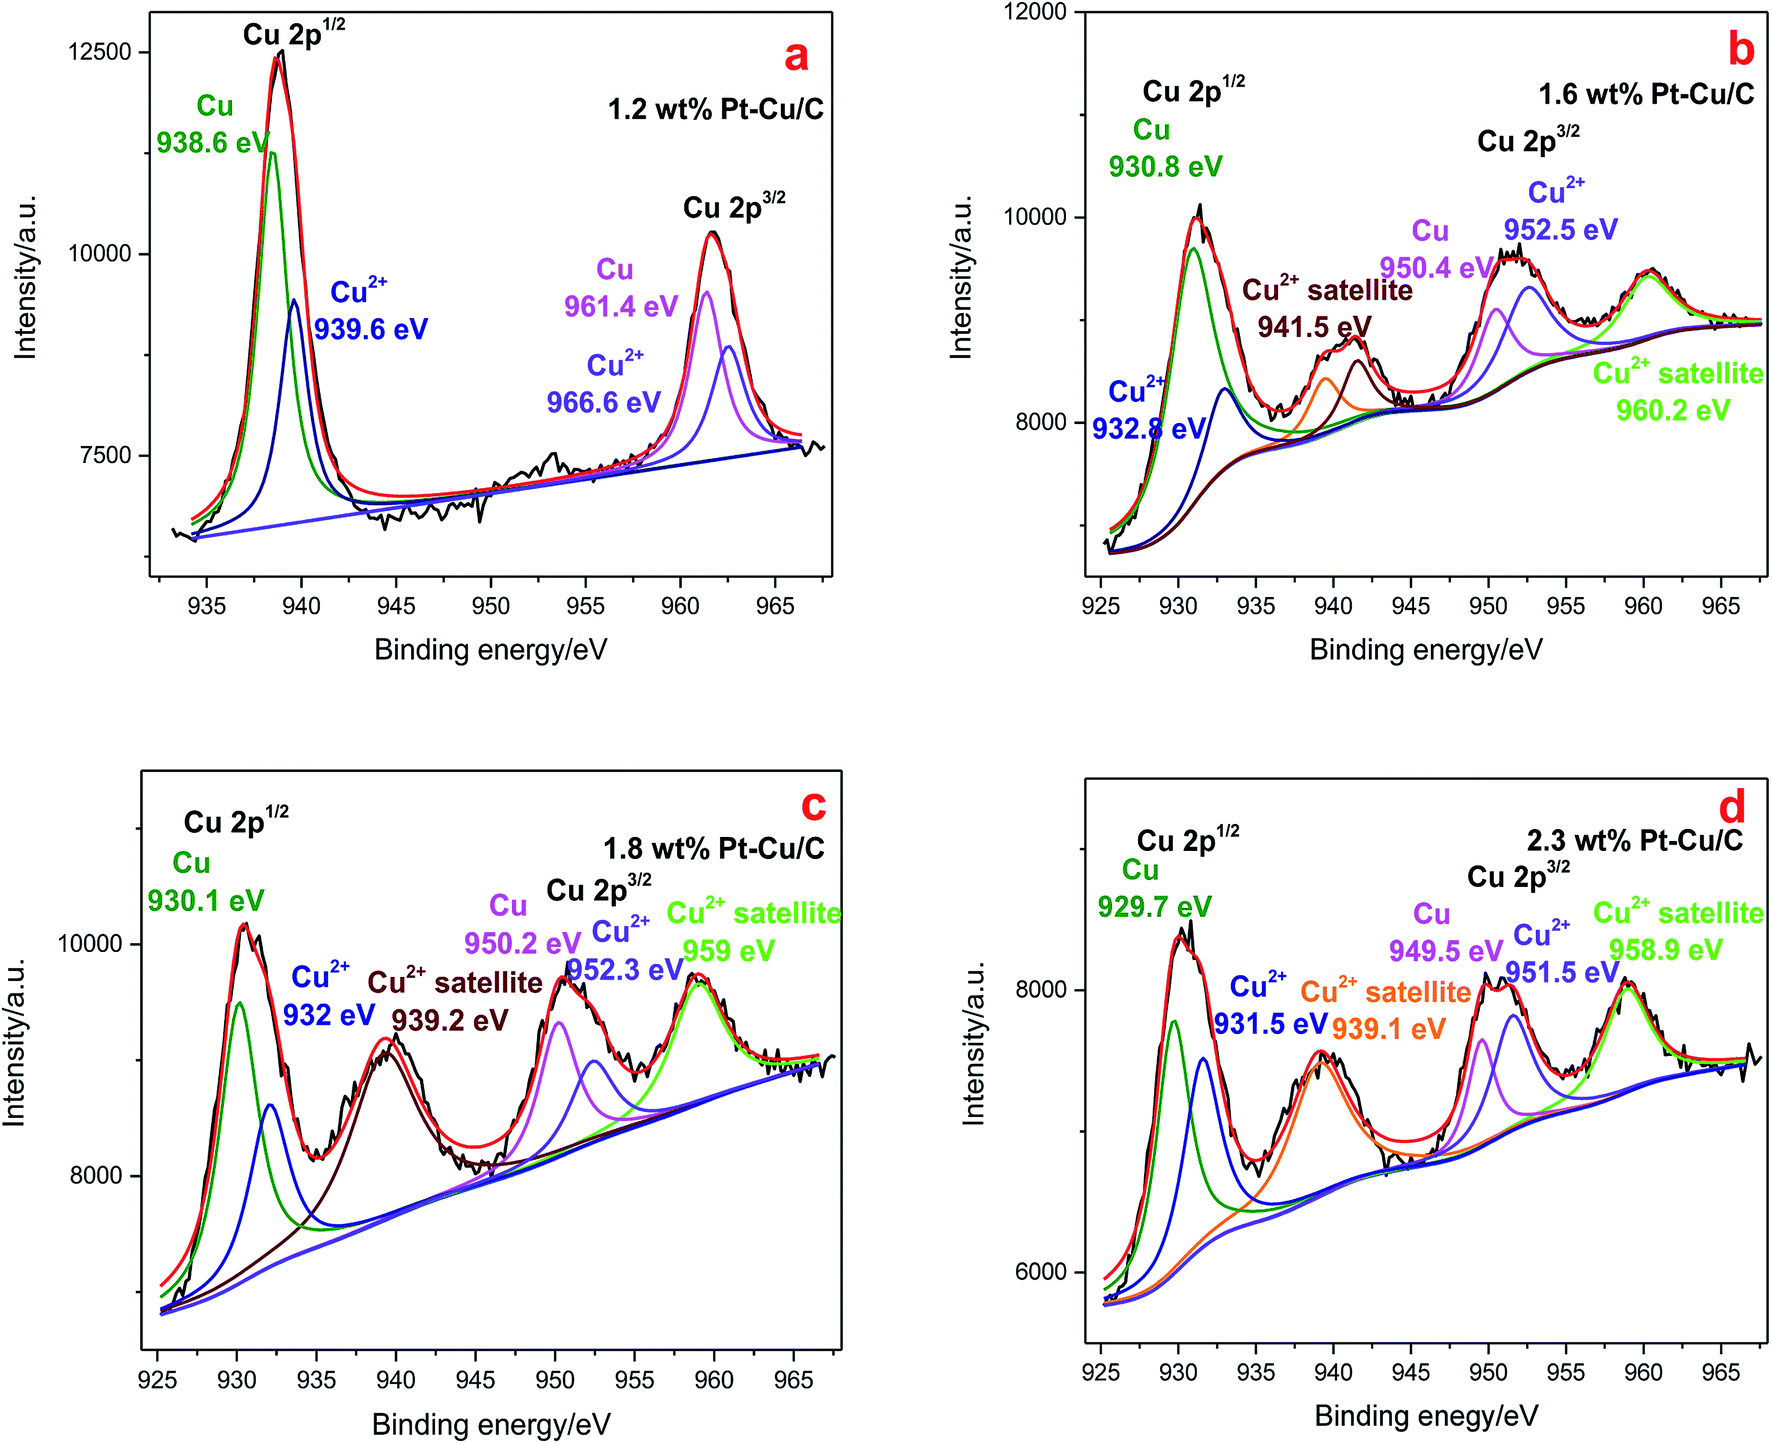 | ||
| Fig. 7 Cu 2p XPS spectra of 1.2 wt% Pt–Cu/C catalyst (a), 1.6 wt% Pt–Cu/C catalyst (b), 1.8 wt% Pt–Cu/C catalyst (c), 2.3 wt% Pt–Cu/C catalyst (d). | ||
The XPS spectra of the Pt 4f region are presented in Fig. 8. All the Pt–Cu/C catalysts curves were fitted to two peaks, indicating the existence of Pt nanoparticles in the reduced state. The binding energy of Pt 4f shifted to higher binding energy as the content of Pt increased, suggesting the stronger binding of Pt with Cu in the catalysts with higher Pt content.
 | ||
| Fig. 8 Pt 4f XPS spectra of 1.2 wt% Pt–Cu/C catalyst (a), 1.6 wt% Pt–Cu/C catalyst (b), 1.8 wt% Pt–Cu/C catalyst (c), 2.3 wt% Pt–Cu/C catalyst (d). | ||
3.2 CO2 photoelectrochemical reduction
The performance of Pt–Cu/C catalysts in CO2PRR was tested by employing the catalyst in a photoelectrochemical reduction cell (PEC). And the catalysts with various Pt contents were used to figure out the optimum Pt content of the catalyst in promoting CO2PRR efficiency. Control experiment with N2 purged using 1.6 wt% Pt–Cu/C as catalyst was also conducted to confirm that the products were all produced from CO2 reduction, the result showed that only H2 can be detected in the gas phase products and the H2 generation rate was 7.32 μmol h−1 cm−2, no liquid product was detected. The experimental results of CORPRR were shown in Fig. 9. | ||
| Fig. 9 Carbon conversion rates and H2 generation rate of CO2 photoelectrochemical reduction reaction on four catalysts (1.2 wt% Pt–Cu/C catalyst, 1.6 wt% Pt–Cu/C catalyst, 1.8 wt% Pt–Cu/C catalyst, 2.3 wt% Pt–Cu/C catalyst). | ||
The carbon atom conversion rate was calculated using the following equation,
 | (1) |
In which Mp is the molar amount of the product, np is the number of carbon atom in the product molecular, t is the reaction time and A is the area of the cathode.
Accordingly, 1.6 wt% Pt–Cu/C catalyst showed the best catalytic effect to reduce CO2 as the total carbon atom conversion rate reached 1139 nmol h−1 cm−2. Liquid products selectivity towards high-order organics including ethanol and propanol was high at first. However, when 2.3 wt% Pt–Cu/C was employed in the PEC system, more C1 organic (e.g. methanol) was generated.
The H2 generation rate increased from 2.17 μmol h−1 cm−2 to 10.98 μmol h−1 cm−2 with the increase of Pt content. Obviously, 1.6 wt% Pt–Cu/C showed the best catalytic activity as it had the highest total carbon atom conversion rate and a relatively low H2 generation rate.
Light and dark current densities of the PEC system using the four Pt–Cu/C catalysts with various Pt contents were shown in Fig. 10(a). It was demonstrated that the light current of the system was much higher than the dark current, indicating the compensation of light energy to the system in a CO2 photoelectrochemical reduction reaction cell. And the light current densities of the system when using 1.2 wt% Pt–Cu/C, 1.6 wt% Pt–Cu/C, 1.8 wt% Pt–Cu/C and 2.3 wt% Pt–Cu/C were 3.4 mA cm−2, 3.1 mA cm−2, 2.8 mA cm−2 and 2.6 mA cm−2 respectively. The adding of Pt to the catalysts would improve the electrochemical performance.
 | ||
| Fig. 10 Light and dark current densities of CO2 photoelectrochemical reduction system with four catalysts (1.2 wt% Pt–Cu/C catalyst, 1.6 wt% Pt–Cu/C catalyst, 1.8 wt% Pt–Cu/C catalyst, 2.3 wt% Pt–Cu/C catalyst) (a), stability test with 1.6 wt% Pt–Cu/C catalyst (b). | ||
Stability of the Pt–Cu/C catalyst [Fig. 10(b)] was also examined. As all the four catalysts had similar morphology and compositions, the stability test was conducted by using the 1.6 wt% Pt–Cu/C catalyst which had the highest catalytic activity during the CO2PRR. Accordingly, after 20 CV circles in NaHCO3 solution in a three electrode cell, an RSD of 3.61% was acquired. Indicating good stability of the catalyst.
CO was an important intermediate in CO2 reduction to various organics,24 to study the competition reactions of CO2PRR and H2 evolution on different surfaces, the free energy pathways of CO generation and H2 generation were compared [Fig. 11]. By comparing the free energies of the CO forming reaction and the H2 evolution reaction, it was clear that the step of 2H* → *H2 on Cu/Pt surface experienced an energy ascending process, and the free energy difference (2.7 eV) was the largest, indicating that H2 evolution reaction was strongly inhibited on Cu/Pt surface. Besides, Cu/Pt surface also showed best absorbed CO species selectivity as the free energy of the step of *COOH + H+ → *CO + H2O dropped sharply. Moreover, the binding energies of CO on Cu/Pt surface, CuO/Pt surface and Pt surface were calculated to be −1.05 eV, −0.47 eV and 0.73 eV respectively. Indicating the strongest bonding of CO on Cu/Pt surface, the adsorbed CO species on the catalyst surface then would take part in further C–C bonding reactions to form high-order organics.24,25 Herein, Cu/Pt surface was calculated to have the best catalytic activity in CO2PRR and at the same time inhibited hydrogen evolution. In conjunction with the CO2PRR experimental results and the elemental mapping result, it was supposed that the 1.6 wt% Pt–Cu/C catalyst had more Cu/Pt surface exposed compared to other catalysts. The reason why the CO2PRR carbon atom conversion rate first increased to a peak at 1.6 wt% Pt–Cu/C and then decreased as the Pt content kept increasing was that the adding of Pt lead to the formation of Cu/Pt surface at first and with the content of Cu/Pt surface increased, the absorbed CO species selectivity was improve and H2 evolution reaction was inhibited. However, with the Pt content kept increasing, the surface of the catalyst was covered by Pt rather than Cu/Pt surface, the H2 evolution reaction was then promoted and less absorbed CO species were produced, resulting in lower organics production.
 | ||
| Fig. 11 Relative free energy pathways of producing CO and H2 on Cu/Pt surface, CuO/Pt surface and Pt surface. | ||
4. Conclusions
In summary, HKUST-1 was pyrolyzed and decorated with Pt to fabricate Pt–Cu/C catalysts. The as prepared catalysts with various Pt contents were then employed in CO2PRR and their catalytic activity were compared. The experiment result showed that 1.6 wt% Pt–Cu/C catalyst had the best catalytic activity in CO2PRR. The total carbon atom conversion rate in CO2PRR experiments using Pt–Cu/C catalysts first increased to a peak of 1139 nmol h−1 cm−2 when using 1.6 wt% Pt–Cu/C catalyst and then decreased with the increase of Pt content. The mechanism of Pt–Cu/C catalysts on promoting CO2PRR was then studied through density functional theory (DFT) calculations. It was demonstrated that Cu/Pt surface had the highest absorbed CO species selectivity and lowest selectivity towards producing H2. In conjunction with the CO2PRR experimental results and the elemental mapping result, we could draw the conclusion that the 1.6 wt% Pt–Cu/C catalyst had more Cu/Pt surface exposed compared to other catalysts, the high content of Cu/Pt surface lead to the high activity for CO2PRR. But for 1.8 wt% Pt–Cu/C and 2.3 wt% Pt–Cu/C, as the Pt content increased, more surface of the catalyst was covered by Pt rather than Cu/Pt surface, resulting in the low organics production and high H2 generation rate.Conflicts of interest
There are no conflicts to declare.Acknowledgements
This study was supported by the National Natural Science Foundation-China (51676171), National Key Research and Development Program-China (2016YFE0117900).References
- S. Aoi, K. Mase, K. Ohkubo, T. Suenobu and S. Fukuzumi, ACS Energy Lett., 2017, 2, 532–536 CrossRef CAS.
- J. C. Cardoso, S. Stulp, J. F. de Brito, J. B. S. Flor, R. C. G. Frem and M. V. B. Zanoni, Appl. Catal., B, 2018, 225, 563–573 CrossRef CAS.
- H. Cho, W. D. Kim, K. Lee, S. Lee, G.-S. Kang, H.-L. Joh and D. C. Lee, Appl. Surf. Sci., 2018, 429, 2–8 CrossRef CAS.
- J. F. de Brito, A. R. Araujo, K. Rajeshwar and M. V. B. Zanoni, Chem. Eng. J., 2015, 264, 302–309 CrossRef.
- J. Ran, M. Jaroniec and S.-Z. Qiao, Adv. Mater., 2018, 30, 1704649 CrossRef PubMed.
- D. Raciti and C. Wang, ACS Energy Lett., 2018, 3, 1545–1556 CrossRef CAS.
- S. Gong, Z. Jiang, P. Shi, J. Fan, Q. Xu and Y. Min, Appl. Catal., B, 2018, 238, 318–327 CrossRef CAS.
- T. Wu, Y. Ma, Z. Qu, J. Fan, Q. Li, P. Shi, Q. Xu and Y. Min, ACS Appl. Mater. Interfaces, 2019, 11, 5136–5145 CrossRef CAS PubMed.
- T. Wu, J. Fan, Q. Li, P. Shi, Q. Xu and Y. Min, Adv. Energy Mater., 2018, 8, 1701799 CrossRef.
- Y. Wang, S. L. Marquard, D. Wang, C. Dares and T. J. Meyer, ACS Energy Lett., 2017, 2, 1395–1399 CrossRef CAS.
- T. Ma, Q. Fan, H. Tao, Z. Han, M. Jia, Y. Gao, W. Ma and Z. Sun, Nanotechnology, 2017, 28, 472001 CrossRef PubMed.
- X. G. Meng, L. Q. Liu, S. X. Ouyang, H. Xu, D. F. Wang, N. Q. Zhao and J. H. Ye, Adv. Mater., 2016, 28, 6781–6803 CrossRef CAS PubMed.
- N. Rui, Z. Wang, K. Sun, J. Ye, Q. Ge and C.-j. Liu, Appl. Catal., B, 2017, 218, 488–497 CrossRef CAS.
- E. Pipelzadeh, V. Rudolph, G. Hanson, C. Noble and L. Wang, Appl. Catal., B, 2017, 218, 672–678 CrossRef CAS.
- L. Wang, Y. Wang, Y. Cheng, Z. Liu, Q. Guo, H. Minh Ngoc and Z. Zhao, J. Mater. Chem. A, 2016, 4, 5314–5322 RSC.
- K. Zhao, Y. Liu, X. Quan, S. Chen and H. Yu, ACS Appl. Mater. Interfaces, 2017, 9, 5302–5311 CrossRef CAS.
- S. Liu, F. Chen, S. Li, X. Peng and Y. Xiong, Appl. Catal., B, 2017, 211, 1–10 CrossRef CAS.
- L. Ye, Y. Gao, S. Cao, H. Chen, Y. Yao, J. Hou and L. Sun, Appl. Catal., B, 2018, 227, 54–60 CrossRef CAS.
- C. Yan, H. Li, Y. Ye, H. Wu, F. Cai, R. Si, J. Xiao, S. Miao, S. Xie, F. Yang, Y. Li, G. Wang and X. Bao, Energy Environ. Sci., 2018, 1204–1210 RSC.
- J. Tang and J. Wang, Environ. Sci. Technol., 2018, 52, 5367–5377 CrossRef CAS PubMed.
- H. Xu, J.-X. Feng, Y.-X. Tong and G.-R. Li, ACS Catal., 2017, 7, 986–991 CrossRef CAS.
- P. Wang, J. Wang, X. F. Wang, H. G. Yu and J. G. Yu, Curr. Nanosci., 2015, 11, 462–469 CrossRef CAS.
- H. Hu, Y. Tang, Q. Hu, P. Wan, L. Dai and X. J. Yang, Appl. Surf. Sci., 2018, 445, 281–286 CrossRef CAS.
- J. H. Montoya, C. Shi, K. Chan and J. K. Norskov, J. Phys. Chem. Lett., 2015, 6, 2032–2037 CrossRef CAS PubMed.
- E. Bertheussen, A. Verdaguer-Casadevall, D. Ravasio, J. H. Montoya, D. B. Trimarco, C. Roy, S. Meier, J. Wendland, J. K. Norskov, I. E. L. Stephens and I. Chorkendorff, Angew. Chem., Int. Ed., 2016, 55, 1450–1454 CrossRef CAS.
| This journal is © The Royal Society of Chemistry 2019 |