 Open Access Article
Chitin nano-whiskers (CNWs) as a bio-based bio-degradable reinforcement for epoxy: evaluation of the impact of CNWs on the morphological, fracture, mechanical, dynamic mechanical, and thermal characteristics of DGEBA epoxy resin†
Muhammad A. S. Anwera,
Jintian Wanga,
Aaron (Qi) Guanb and
Hani E. Naguib *c
*c
aDepartment of Mechanical and Industrial Engineering, University of Toronto, 5 King's College Street, Toronto, Ontario, Canada
bBOCO Bio-Nanotechnologies Inc., 40 Pullman Court, Toronto, Canada
cDepartment of Mechanical and Industrial Engineering, Department of Materials Science and Engineering, Institute of Biomaterials and Biomedical Engineering, University of Toronto, 5 King's College Street, Toronto, Ontario, Canada. E-mail: naguib@mie.utoronto.ca
First published on 9th April 2019
Abstract
Chitin nano-whiskers (CNWs) are high performance nanomaterials that can be extracted from chitin, which is one of the most widely available bio-resources. Herein we investigate the effect of CNWs on the morphological, mechanical, dynamic mechanical and thermal properties of DGEBA epoxy. Optically transparent, bulk epoxy nano-composites with 0.25 wt%, 0.5 wt% and 0.75 wt% CNWs were evaluated in addition to neat epoxy. The composites were prepared based on a modified slurry compounding method. CNWs appear to be well dispersed within the epoxy matrix with increasing tendency for clustering as the CNW content is increased. The addition of 0.25 wt% CNWs to neat epoxy results in a decrease in the glass transition temperature and an increase in the tensile strength, modulus, damping and thermal degradation temperature. All the composites evaluated with CNWs showed distinct crack arrest events upon initiation of the first major crack growth during fracture toughness testing. Composites with 0.75 wt% CNWs showed the highest damping and an increase in the fracture toughness and resilience over neat epoxy.
Introduction
Nowadays research on nanocomposite materials has evolved into a rapidly developing stage for their demonstrated improvement in several material characteristics. Much of the improvements in nanocomposites compared to conventional composites is a result of the much larger interfacial area of interaction between the polymer matrix and the nanofiller reinforcement. Various types of nanofibers, nanoparticles or nanoplatelets have been used as nanoscale fillers in composites for enhancement of the characteristics. A wide rage of property enhancements has been shown from mechanical, electrical, and thermal, to barrier and other properties.1–6 However, it has been reported that some of the most common nanoscale fillers such as carbon nanotubes and carbon nanofibers employ a highly energy intensive life cycle.7 Some studies have shown that the life cycle energy costs required to produce a single kg of SWCNTs is on the order of a few terajoules.8 In addition to this, many of the nanoscale fillers have long degradation times in the environment, which negatively contributes to the already growing issue of sustainability worldwide. Thus, while most of these nanocomposites take advantage of nanofillers for performance enhancement, environmental and energy concerns in their utilization is drawing increasing attention towards bio-based materials, many of which are much less energy intensive and more sustainable. As a result, a significant body of research interest is based on the substitution of nanofillers in nanocomposites with those from more renewable and sustainable resources, while maintaining comparable performance enhancements.9–11A large wealth of literature has been dedicated to the use of cellulose nanofibers, a crystalline form of cellulose, as reinforcement to polymer matrices. Cellulose nanofibers can be extracted from cellulose, which is the primary structural component of the cell walls of plants and is the most abundant bio-polymer. These nanofibers posses high aspect ratio, strength, stiffness and bio-degradability which has been shown to impart enhancements on many of the composites reinforced by them.12–14 Analogous to cellulose, chitin is also a primary structural component of cell walls in fungi and the exoskeleton of arthropods. Being the second most abundant natural polymer after cellulose, compared with which chitin possesses similar polysaccharide structure but with replacement of the hydroxyl group with an acetyl amine group.15,16 The most abundant resource for chitin extraction is from crustacean shells. Enormous amounts of chitin are produced globally from shell waste.17 As with cellulose, chemical methods employed involve acid and alkaline treatments to remove the protein, calcium carbonate and astaxanthin to have a pure chitin nano-whisker suspension.18 The structure of the chitin molecule has acetyl-glucosamine monomers connected by β-(1→4)-linkages as repeating units to form crystalline whiskers.19 The form “whisker” of chitin nanofiber is illustrated by its rod-like structure with dimensions of 200–500 nm in length and 10–20 nm in width depending on the source.20
Chitin nano-whiskers posses a high modulus of 200 GPa, providing it great potential to be considered as an appropriate substitution for conventional nanofillers.21 The improvement of mechanical properties has been demonstrated through evaluation of various chitin nano-whisker composites. Lu's group reported that chitin reinforced soybean isolate thermoplastic has indicated an increase in both the tensile strength and Young's modulus.22 Mitsuhiro's group reported a higher storage modulus for SPE-Lys/CNF and SPE-Cys/CNF bio-composites compared to those neat epoxy composites.23 Jirawat's group reported α-chitin whisker-reinforced poly(vinyl alcohol) (PVA) nanocomposite has Young's modulus higher by about 4–8 times over that of the neat PVA mat.24
Epoxy resins are one of the most widely utilized polymers due to their high resistance to chemical attack, easy processability, high mechanical properties, thermal properties and strong adhesion to substrates. As a result, it is widely utilized in structural applications, such as resins for composites. Many of the conventional aircraft structural components are being replaced with epoxy-carbon fiber composites, where epoxy is utilized as the resin.25,26 Therefore, a significant amount of academic and industrial research has been dedicated to enhancement of the characteristics of epoxy.27–29 It has been demonstrated that nano-filler addition to epoxy has resulted in enhancement of the fracture, mechanical, thermal and electrical characteristics. However, a significant aspect of this enhancement lies in overcoming the high inter-adhesion due to van der Waals forces and dispersing the fillers into the epoxy matrix. Numerous studies have targeted the reduction of the difference in surface polarity and surface tension between epoxy matrix and fillers to increase the effectiveness of transmission of dispersive forces to the fillers. Specifically, chitin nano-whiskers are highly hydrophilic and are usually obtained as a dispersion in water. Since epoxies are generally insoluble in water, specific methods are required to isolate chitin without agglomeration/clustering first before dispersion into epoxy. Freeze drying has been commonly utilized to obtain chitin powder, which can then be dispersed into the matrix resin.15,30,31 However, freeze drying is a time-consuming process and the effective de-agglomeration is dependant on the rate of freezing, which is difficult to control.32–34 Solvent exchange is another process whereby the water can be gradually exchanged with another solvent in which epoxy can be dissolved. This exchange would facilitate a more gradual change in surface tension as the water diffuses out and the solvent and epoxy diffuse into the domains. Wang et al. fabricated composites of chitin nano-whiskers in epoxy through slurry compounding; first re-dispersing the CNWs from water into ethanol followed by mixing of DGEBA with the CNWs-ethanol solution and heated stirring to vaporize the ethanol. They found a significant increase in the tensile properties with the addition of 2.5 wt% CNWs.35
Literature on the use of CNWs in epoxy is extremely limited. To the best of our understanding, no investigation has been performed evaluating the effect of CNWs on the fracture, mechanical, thermal, and morphological characteristics of DGEBA epoxy resin. In this study, chitin nano-whisker suspension prepared by chemical methods has been processed with epoxy resin using a slurry compounding-based approach to fabricate optically transparent, bulk nanocomposites with different concentrations of CNWs. These composites are characterized for their thermal degradation, calorimetric, mechanical, dynamic mechanical and morphological characteristics for delineating a structure property relationship of the CNWs epoxy nanocomposites.
Materials and methods
Materials
Epoxy resin used for this study was a reaction product of epichlorohydrin and bisphenol-A obtained from Hexion (Epon 828) (epoxide equivalent weight: 185). Triethylenetetramine (TETA) also obtained from Hexion (EPIKURE 3234) (amine value: 1410–1460) was used as the curing agent in the ratio 100![[thin space (1/6-em)]](https://www.rsc.org/images/entities/char_2009.gif) :
:![[thin space (1/6-em)]](https://www.rsc.org/images/entities/char_2009.gif) 13 (resin
13 (resin![[thin space (1/6-em)]](https://www.rsc.org/images/entities/char_2009.gif) :
:![[thin space (1/6-em)]](https://www.rsc.org/images/entities/char_2009.gif) curing agent) parts by mass. Chitin nano-whiskers were a commercial grade obtained from BOCO Bio-Nanotechnologies in the form of an aqueous suspension. In order to measure the concentration of CNWs in the solution, TGA was utilized before using CNWs for composite fabrication experiments.
curing agent) parts by mass. Chitin nano-whiskers were a commercial grade obtained from BOCO Bio-Nanotechnologies in the form of an aqueous suspension. In order to measure the concentration of CNWs in the solution, TGA was utilized before using CNWs for composite fabrication experiments.
Fabrication methodology
The chitin nano-whiskers (CNWs) used was in the form of CNWs-water suspension (supplied by BOCO technology Inc., Canada). The morphology of the CNWs was confirmed by AFM imaging during characterization and is presented in Fig. 1. The concentration of CNWs in the water suspension was measured using thermogravimetric analysis (TGA) to be around 3.57 wt%. For this, the CNWs suspension is heated to 150 °C and kept isothermally for 30 minutes to ensure water evaporation. The concentration was determined from the average of the results from different sections of the same batch.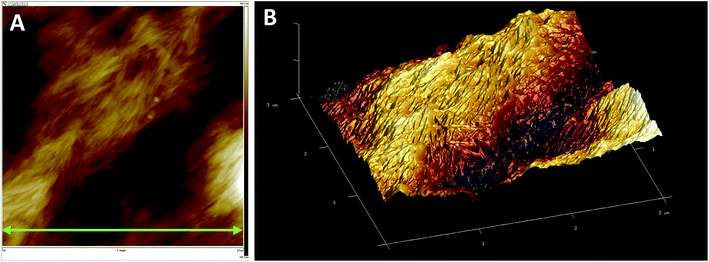 | ||
| Fig. 1 AFM morphology of dried CNWs suspension; (A) 2D height map and (B) 3D height map. The scale drawn in (A) is 3 μm. | ||
A modified “slurry” compounding method was employed by addition of ethanol to DGEBA in a ratio of 2.6![[thin space (1/6-em)]](https://www.rsc.org/images/entities/char_2009.gif) :
:![[thin space (1/6-em)]](https://www.rsc.org/images/entities/char_2009.gif) 1 (ethanol
1 (ethanol![[thin space (1/6-em)]](https://www.rsc.org/images/entities/char_2009.gif) :
:![[thin space (1/6-em)]](https://www.rsc.org/images/entities/char_2009.gif) DEGBA) to the amount of epoxy resin to dissolve the chitin suspension in the epoxy. Calculated amounts of CNWs solution was added to the DGEBA–ethanol mixture to achieved the final desired weight content of CNWs in epoxy. The resulting solution of CNWs (and the associated water), DGEBA, and ethanol were left for mechanical stirring at 60 °C to vaporize the ethanol and water content. This was confirmed through TGA characterization (less than 1% variance in the volatile content with respect to DGEBA). After adding the TETA curing agent in a ratio of 13
DEGBA) to the amount of epoxy resin to dissolve the chitin suspension in the epoxy. Calculated amounts of CNWs solution was added to the DGEBA–ethanol mixture to achieved the final desired weight content of CNWs in epoxy. The resulting solution of CNWs (and the associated water), DGEBA, and ethanol were left for mechanical stirring at 60 °C to vaporize the ethanol and water content. This was confirmed through TGA characterization (less than 1% variance in the volatile content with respect to DGEBA). After adding the TETA curing agent in a ratio of 13![[thin space (1/6-em)]](https://www.rsc.org/images/entities/char_2009.gif) :
:![[thin space (1/6-em)]](https://www.rsc.org/images/entities/char_2009.gif) 100 by weight (TETA
100 by weight (TETA![[thin space (1/6-em)]](https://www.rsc.org/images/entities/char_2009.gif) :
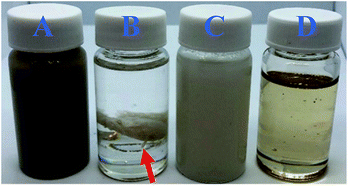
:![[thin space (1/6-em)]](https://www.rsc.org/images/entities/char_2009.gif) DGEBA), the solution was stirred manually and degassed for 15 minutes to remove entrapped air bubbles. The composites were casted in silicone rubber molds and cured overnight, followed by post curing at 100 °C for 24 hours. The evolution of optical characteristics of the suspension as it progressed through the various stages in processing are presented in Fig. 2. Fig. 3 displays pictures of the polished final epoxy CNWs nanocomposites obtained after post curing. Table 1 summarizes the naming methodology for the CNWs nano-composites fabricated for this study.
DGEBA), the solution was stirred manually and degassed for 15 minutes to remove entrapped air bubbles. The composites were casted in silicone rubber molds and cured overnight, followed by post curing at 100 °C for 24 hours. The evolution of optical characteristics of the suspension as it progressed through the various stages in processing are presented in Fig. 2. Fig. 3 displays pictures of the polished final epoxy CNWs nanocomposites obtained after post curing. Table 1 summarizes the naming methodology for the CNWs nano-composites fabricated for this study.
| Designation | wt% CNWs | wt% epoxy |
|---|---|---|
| Epon 828/epoxy | — | 100 |
| 0.25 wt% CNWs | 0.25 | 99.75 |
| 0.5 wt% CNWs | 0.5 | 99.5 |
| 0.75 wt% CNWs | 0.75 | 99.25 |
Morphological characterization
Scanning electron microscopy (JEOL, JSM 1000) was used to evaluate the morphological characteristics of the composites. Exposed sections from the fracture surfaces of the SENB tested specimens were used for imaging. The samples were sputter coated for 120 seconds at around 5 mA with a gold ion current for imaging. For AFM imaging, aqueous diluted CNWs solution were casted onto glass covered, metallic examination slides and air-dried and mounted on the piezo-crystal for imaging (Multimode 8). For transmission electron microscopy, 85 nm thick sections were cut on a Leica EM UC7 ultramicrotome. These samples were then stained with uranyl acetate and viewed in an FEI Tecnai 20 TEM at 120 kV.Fracture and tensile testing
For fracture testing, rectangular samples of dimensions (8 mm × 16 mm × 76.2 mm) were fabricated for testing using the ASTM D5045 standard. The notches were machined centrally and perpendicular to the 76.2 mm length and parallel to the 8 mm side using a 45° chevron form mill. Prior to testing, a sharp razor blade was slid over the notch to create the pre-crack. The samples were placed on a three point bending test setup and loaded at a rate of 1 mm min−1 perpendicular to the notch. The plane strain fracture toughness, KIC, was calculated using the following equations from ASTM D5045:The parameters in the expressions are as indicated in the ASTM D5045 standard. GIC of the nano-composites was also calculated in accordance with the suggested methodology presented in the ASTM D5045 standard.36
Tensile testing was performed on dog-bone shaped samples fabricated according to ASTM D638 and loaded via screw action side grips on a tensile micro-tester (Instron 5848). The loading rate was set to 5 mm min−1.
For isothermal dynamic mechanical analysis, rectangular bars of 76.2 mm length, 16 mm width and variable thickness were tested in a dynamic mechanical analyzer (DMA Q800). These samples were tested at room temperature at a strain of 0.03% in a frequency sweep from 5–50 Hz. For temperature ramp dynamic mechanical testing, rectangular bars of around 2 mm thickness, 15 mm width and 60 mm length were heated in the DMA at a heating rate of 2 °C min−1 at a frequency of 1 Hz. The storage modulus, loss modulus and tan delta variation with temperature were recorded.
Differential scanning calorimetry and thermogravimetric analysis
DSC was used to characterize the glass transition behaviour of the nanocomposites. Thin slices from cured samples for tensile testing were extracted with a blade and placed in crimped aluminum pans for testing on a heat–cool–heat cycle, in a differential scanning calorimeter (DSC Q2000, TA Instruments). A heating/cooling rate of 10 °C min−1 was applied to heat the samples to 200 °C followed by a cooling to 0 °C, and then heating again to 200 °C. The first heating cycle was to ensure the completion of any remaining cure reaction, before the second heating cycle from where the glass transition temperature was measured. For thermogravimetric testing, thin slices were taken from the samples fabricated for tensile testing and placed in tared platinum pans to be tested in a thermogravimetric analyzer (TGA Q50, TA Instruments). Ramp tests were performed under nitrogen purge by heating the samples at a rate of 20 °C min−1. Pure chitin samples were also analyzed by first drying a small amount of the CNWs suspension in a TGA followed by DSC & TGA testing in accordance with the procedure for neat epoxy and CNWs nano-composites.Results and discussions
Morphological characterization
The AFM 2D and 3D height images of air-dried CNWs from suspension are presented in Fig. 1. As a result of the large amount of pendant hydroxyl groups on chitin, drying of CNWs results in irreversible clustering (agglomeration) due to hydrogen bonding and cross-linking. These clusters can be seen in the AFM image where individual CNWs pack together to form elongated stacks. The approximate diameter and length of the individual CNWs within these clusters is 20–30 nm and 200–400 nm respectively. This provides an aspect ratio close to 10, which is in agreement with our previous morphological investigations of these CNWs.37 Fig. 4 shows the internal morphology of the epoxy CNWs nanocomposites with 0.25 wt%, 0.5 wt% and 0.75 wt% CNWs. The fracture surface of neat epoxy displays a mirror like surface which is characteristic of brittle failure. This is a result of crack propagation, with very little resistance, in the plane perpendicular to the mode I tensile stresses generated during testing. The presence of CNWs on the fracture morphology can be clearly seen as highlighted in Fig. 4. With the addition of CNWs, the fracture surface displays considerably greater roughness, primarily as a result of crack deflection, where the crack deflects along planes not perpendicular to the direction of the applied stresses. This is a result of variation of the material strength and stiffness along the interfaces and interphases between the CNWs and epoxy matrix, resulting in generation of localized off axis stresses. However, the density of ridges at 0.5 wt% CNWs is less than that of 0.25 wt% and 0.75 wt% CNWs. Studies have indicated that changes in the amount and dispersion level of the nanofillers can disrupt the uniformity of the ridges.38 The presence of CNWs as individualized whiskers and in the form of clusters is also highlighted in Fig. 4. As a result of the low aspect ratio of CNWs, significant pullout effect is not observed, and the CNWs appear as high contrast points on the SEM images of the fractographs. Clusters of CNWs are more evident on the fractographs as closely spaced points, in addition to regions with a fibrous texture which appears due to the crack deflecting along the edges of the CNWs and the CNWs-epoxy interfaces. These clustered regions appear as stacks of the CNWs, which is also seen in the AFM scan in Fig. 1. With increasing content of CNWs from 0.25–0.75 wt%, the cluster density of the CNWs increases and the dispersion reduces. An important feature in the micrographs of all the CNWs epoxy nanocomposites is the high amount of adhesion between the CNWs and the epoxy matrix. This is evident from the absence of any apparent gaps in the filler–matrix interface. Fig. 5 presents the TEM images of the epoxy-CNWs nanocomposites. The TEM images also confirm the presence of distinct CNWs clusters within the epoxy matrix. These clusters appear similar in morphology to the AFM images of dried CNWs in Fig. 1. However, in general, the clusters of CNWs appear well incorporated into the epoxy matrix as can be seen through the largely continuous interfaces between the CNWs and epoxy. The cluster sizes appear variable with domains ranging from a few nano-meters to a 100 nm or more in size. The cluster size increases with increase in weight percent of the CNWs from 0.25 wt% to 0.75 wt%, indicating greater difficulty in dispersion of the nanofillers. The size of the nano-fillers also affects nano-composite transparency. As seen in Fig. 3, the high transparency of the nano-composites despite the thickness of the samples shown is evident, especially at 0.25 wt%. High transparency is a result of two primary factors: (1) size of the nanofiller inclusions and (2) refractive index matching between the filler and the matrix.39 In order for visible light photons to bypass the filler inclusions without scattering, the size of the inclusions must be below 100 nm. From the TEM images in Fig. 5, the inclusion sizes increase with increasing weight percentage of the fillers. Despite this, the high transparency of the nanocomposites even at 0.75 wt% CNWs is indicative of also good index of refraction matching between of neat epoxy and CNWs.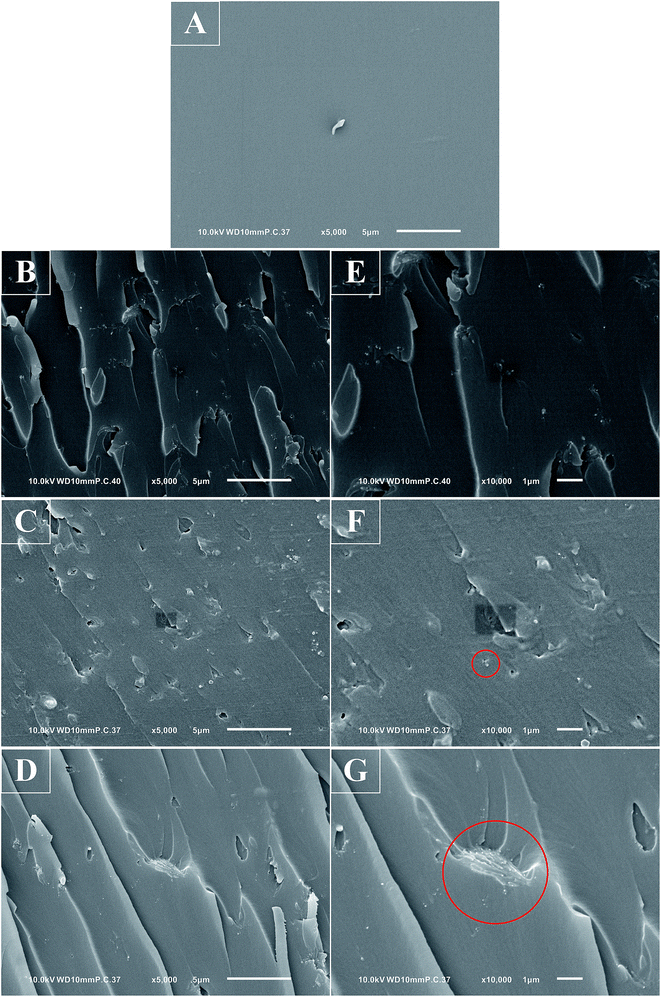 | ||
| Fig. 4 SEM fractographs of epoxy CNWs nanocomposites from SENB testing. (A) Neat epoxy, (B & E) 0.25 wt% CNWs, (C & F) 0.5 wt% CNWs, (D & G) 0.75 wt% CNWs. The red circles highlight CNWs clusters. | ||
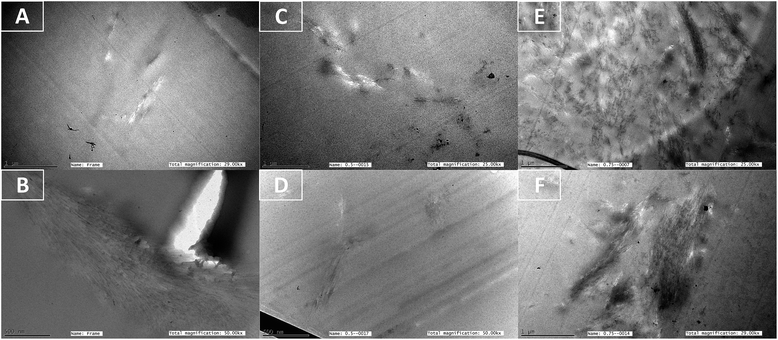 | ||
| Fig. 5 TEM micrographs of epoxy CNWs nanocomposites: (A & B) 0.25 wt% CNWs, (C & D) 0.5 wt% CNWs, and (E & F) 0.75 wt% CNWs. The sections were negatively stained with uranyl acetate. | ||
Fracture, mechanical and dynamic mechanical characteristics
Fig. 6 presents the tensile characteristics of the epoxy CNWs nano-composites. With the addition of CNWs, the modulus and tensile strength increase upto a maximum of 23% and 12% with respect to neat epoxy, with the addition of just 0.25 wt% CNWs. This is a result of the significantly higher stiffness and strength of the added CNWs as compared to the epoxy matrix. Upon the addition of CNWs content greater that 0.25 wt%, both the modulus and the tensile strength continue to drop with the lowest being at 0.75 wt% CNWs, amongst the CNWs reinforced epoxy nanocomposites. This is a result of the increased tendency for clustering at higher CNWs content as seen in the SEM and TEM images in Fig. 4 and 5. The tensile strain to failure as seen in Fig. 6C displays an opposite trend with the addition of CNWs as compared with the modulus and the strength. The strain to failure initially drops with the addition of 0.25 wt% CNWs followed by an increase with further addition, with the maximum observed at 0.75 wt% CNWs content. The clustering at higher CNWs contents, as observed, has the potential to undergo relative sliding at higher stresses. This sliding would result in “pseudo-ductility” and an increase in the strain to failure as observed. As a consequence of the larger strain to failure, the average energy to failure of epoxy with 0.75 wt% CNWs is the highest amongst the evaluated compositions as seen in Fig. 6D.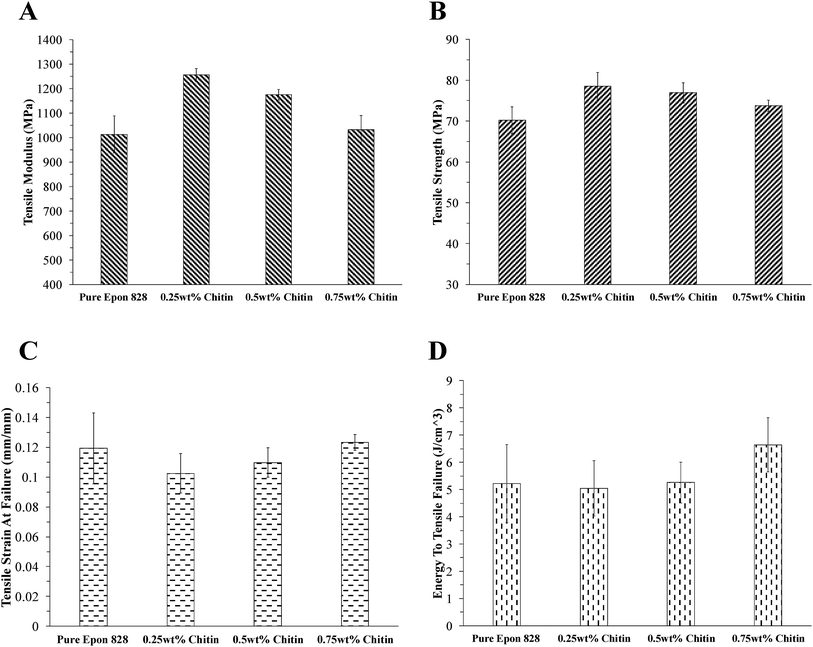 | ||
| Fig. 6 Tensile characteristics of epoxy CNWs nanocomposites: (A) tensile modulus, (B) tensile strength, (C) tensile strain at failure, and (D) energy to tensile failure. | ||
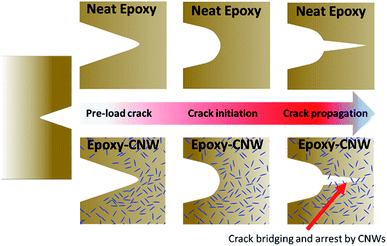
Fig. 7A presents the load deflection curves from the fracture toughness testing of the CNWs epoxy nanocomposites. All the load–displacement curves display an almost linear behaviour upto first initiation of fracture at maximum load. For neat epoxy, the load increases to a maximum followed by sudden drop in load corresponding to catastrophic crack growth and failure. However, with the addition of just 0.25 wt% CNWs in the epoxy nanocomposites, multiple crack arrest events can be observed after the initial onset of crack propagation at maximum load. These crack arrest events are due to greater reduction in the crack propagation velocity (crack deceleration) as compared with the rate of increase in the applied load above critical stress. Since the applied displacement rate was the same for all the compositions evaluated, the larger amount of crack arrest events in the CNWs reinforced composites was a result of rapid reduction in stress intensity factor to below critical levels; at-least at a rate greater than the rate of applied load.37 This rapid reduction in the stress intensity factor to below critical levels is a result the multiple crack deflection, crack bridging and crack pinning events by the presence of CNWs as already seen in the SEM images as explained in the proceeding discussion. Fig. 7B plots the KIC, critical stress intensity factor, of the epoxy CNWs nano-composites based on the maximum load obtained before onset of catastrophic crack growth (neat epoxy) or first major crack growth event (epoxy CNWs nanocomposite). From the KIC data, the addition of CNWs to neat epoxy does not significantly change the critical stress intensity factor, except for 0.75 wt% CNWs, which shows around an 8% increase in the KIC over neat epoxy. From the rough surface of the SEM images and the multiple crack arrest events shown in Fig. 7A, it would be expected that, KIC would also show a notable increase with the addition of CNWs. However, in-order for CNWs induced extrinsic reinforcement mechanisms to operate effectively, the size scale of the reinforcement needs to be on the same order as that of the crack tip. As seen from the SEM and TEM micrographs (Fig. 4 and 5), the CNWs formed extremely small nanometer sized clusters (∼100 nm) within the epoxy matrix. This indicates that CNWs can only participate in sub-micron crack tip process zones. During the initial stages of loading, the stresses at the crack tip build upto critical stress intensity before the onset of the first major crack growth. This provides a window of time for viscoelastic-plastic processes to operate at the crack tip, resulting in crack tip blunting. It is believed due to this blunting during the initial part of the loading, and their relatively small size, the CNWs are unable to participate in extrinsic processes which operate ahead of the crack tip such as crack bridging and pullout. In this case, the fracture toughness would depend more on the resilience (bulk energy to failure) of the material within the blunted crack tip as compared to potential for extrinsic reinforcement. Once the crack starts propagating, it accelerates towards the local speed of sound. As a result, large increases in strain rates are encountered within the materials in the vicinity of the crack tip; the viscoelastic deformation in the dynamically moving crack tip is reduced, resulting in reduced crack blunting and size of the moving crack tip. If the reduction in the size of the dynamically moving crack tip is lower than the reinforcement, extrinsic reinforcement mechanisms be allowed to operate ahead of the crack tip. It is believed that this is the reason that the addition of CNWs to epoxy results in notable fracture reinforcement after the initial major crack propagation, as seen from the multiple crack arrest events. The proposed mechanism is summarized in Fig. 8.
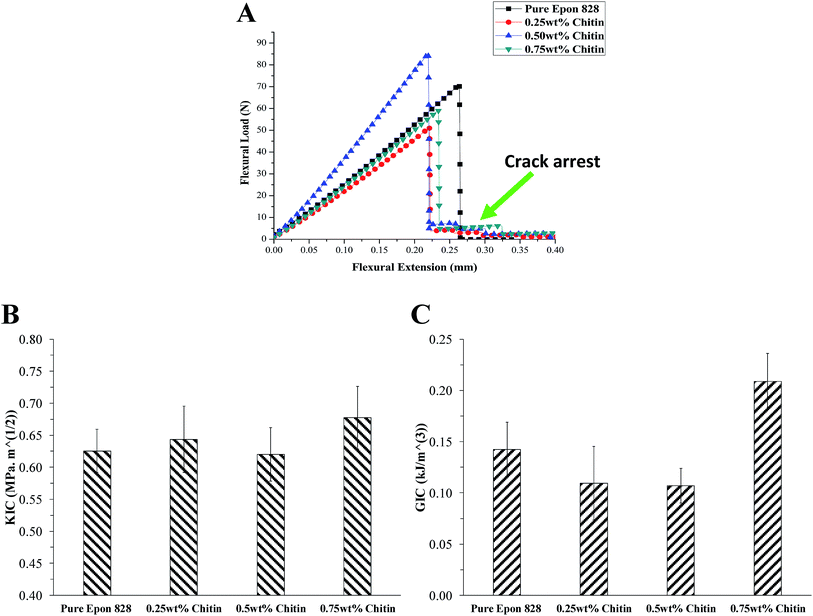 | ||
| Fig. 7 (A) Flexure load–extension curves from SENB testing. Crack arrest upon initiation of first major fracture is clearly seen in composites of epoxy with CNWs. (B) KIC and (C) GIC. | ||
KIC is a measure of the stress concentration at the crack tip before the first major crack growth. In contrast, GIC is a measure of the energy absorbed to the first major crack growth. The GIC results of the polymer CNWs nano-composites are presented in Fig. 7C. From this, we see that the GIC initially drops with the addition of 0.25 wt% CNWs, followed by an increase with increasing weight content of CNWs upto 0.75 wt%. Two possible ways that CNWs can influence the region ahead of the crack tip is by: (1) stiffening due to the addition of the CNWs particles themselves and (2) “plasticity” due to CNWs fibril sliding. The former influence prevents crack blunting, while the latter promotes blunting and energy distribution at the crack tip. As the CNWs content is increased from 0.25 wt% to 0.75 wt%, the CNWs cluster density and size clearly increase as seen in the TEM images (Fig. 5). The result of this is greater intra-cluster CNWs fibril sliding, resulting in more energy dissipation and increase in GIC at 0.75 wt% CNWs. This behaviour in GIC with different CNWs content agrees with the resilience data obtained from tensile testing (Fig. 6). Indeed, both these quantities fundamentally measure energy absorption to a characteristic failure onset point, and hence the similarity.
The mechanical and fracture enhancements imparted to neat epoxy by CNWs, as obtained in the current study, compare favourably with that of other zero-dimensional (spherical), 1-dimensional and 2-dimensional nanofillers such as nano-rubbers, CNTs, and graphene respectively. Nano-rubbers have been shown to reinforce crack tips by promoting gross plastic deformation ahead of the crack tip.40,41 In contrast, CNTs and Graphenes have been shown to reinforce through mechanisms like crack bridging behind the crack tip.42–46 The aspect ratio of CNWs is between that of spherical nanoparticles and carbon nanotubes. This results in the possibility of hybridizing the reinforcement effects from both these types of nanoparticles (promotion of matrix plastic deformation and crack bridging) through the addition of CNWs. In addition to this, intra cluster CNWs fibril sliding provides another form of energy dissipation, especially at higher weight percentages like 0.75 wt%, where larger CNWs cluster are clearly visible from the TEM images (Fig. 5). A description on the possible toughening mechanisms has already been presented in the preceding discussion and in Fig. 8.
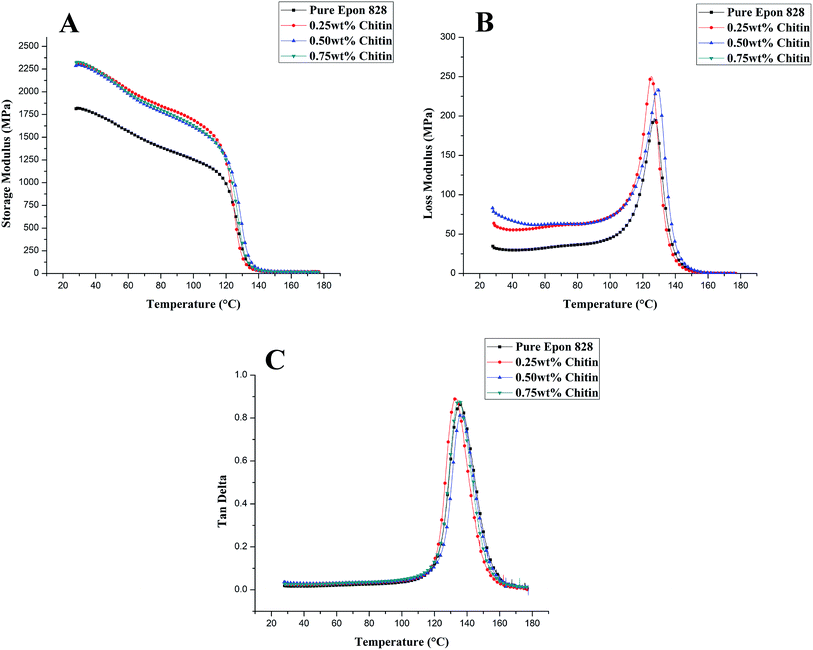
Fig. 9 shows the isothermal dynamic mechanical characteristics of neat epoxy and the epoxy CNWs nano-composites. These characteristics were obtained at a single frequency during an isothermal frequency sweep of the composites. Upon application of a sinusoidal stress, purely elastic materials display a sinusoidal strain response exactly in phase and purely viscous materials display a sinusoidal strain response 90° out of phase. Most materials however are viscoelastic and display a response out of phase between 0° and 90°, to an applied stress signal. The storage modulus and loss modulus represent the amount of energy stored in elastic deformation or lost to viscous flow respectively per unit deformation per unit time. Tan delta is the ratio of the loss modulus to the storage modulus. In the current work, the Kelvin–Voigt model was used to obtain the storage modulus, loss modulus and tan delta. In this model, the storage modulus is related to the Young's modulus and the loss modulus is related to the viscosity of the out of phase deformation component.
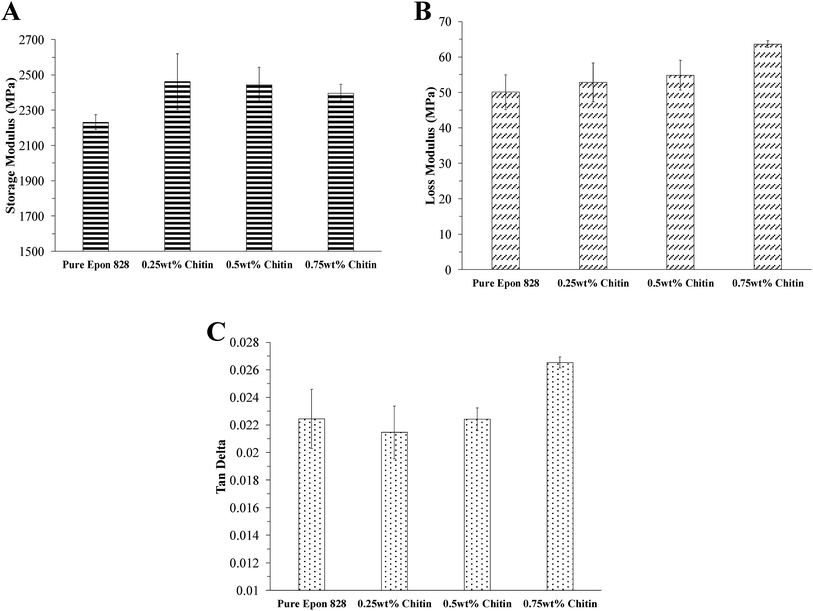 | ||
| Fig. 9 Isothermal dynamic mechanical characteristics of epoxy CNWs nanocomposites obtained at 10 Hz frequency: (A) storage modulus, (B) loss modulus and (C) tan delta. | ||
In accordance with the trends observed for the tensile modulus, the storage modulus increases with increasing CNWs content upto a maximum at 0.25 wt% CNWs, followed by subsequent decrease with the addition of 0.5 wt% and 0.75 wt% CNWs. As with the young's modulus, the increase in the storage modulus is a result of the greater stiffness of the added CNWs as compared with the epoxy matrix. The loss modulus in general shows a slight increase with increase in the CNWs content in epoxy, with the highest average loss modulus being at 0.75 wt%. The average tan delta of neat epoxy reduces with the addition of 0.25 wt% CNWs followed by subsequent increases with the addition of 0.5 wt% and 0.75 wt% CNWs, with the highest tan delta obtained for 0.75 wt% CNWs. Generally, it is expected that stiffer materials display higher loss moduli as a result of greater stresses required per unit viscous strain per unit time. However, other factors can effect this general behaviour, one being interfacial sliding whereby sliding at the interfaces between the particles and the matrix require large out of phase stress components resulting in higher loss modulus and tan delta.47,48 Thus it is believed that the lower storage modulus and higher loss modulus & tan delta of 0.75 wt% CNWs in comparison with the other CNWs epoxy nanocomposites is a result of sliding and energy dissipation between the adjacent CNWs nano-whiskers. This also follows from the preceding discussion where the morphology of 0.75 wt% CNWs displayed the largest clustered stacks and the highest fracture toughness and resilience.
Fig. 10 shows the temperature ramp dynamic mechanical characteristics of the epoxy CNWs nanocomposites. As compared to neat epoxy, the storage modulus of epoxy CNWs nanocomposites before the onset of glass transition is clearly higher with the addition of CNWs as compared with neat epoxy. This is a result of the stiffening affect of the CNWs nanoparticles as discussed above in the results of the isothermal DSC scans.49 The glass transition temperature in many polymers is associated with the release of additional degrees of freedom and local relaxation of polymer chains. In epoxies and other thermoset materials, the glass transition temperature itself depends significantly on the degree of cure, as greater degree of cure (or conversion) results in higher molar mass. During the initial stages of cure through gelation, the rate of curing depends on the rate of chemical reaction since the characteristic timescale related to the local mobility of functional groups is still much shorter than the characteristic timescale for producing chemical reactions. Upon vitrification, the glass transition temperature increases to above the reaction temperature and the further crosslinking becomes significantly more limited by the rate of diffusion of functional groups rather than the rate of chemical reaction itself. The addition of nanoparticles to this crosslinking medium influences chemical conversion by: (i) providing a surface as a catalyst for increasing the degree of cure and (ii) restriction diffusion of functional groups. The former influence tends to speed up chemical conversion before vitrification and the latter tends to restrict further conversion beyond vitrification. Besides these two methods of influence, nanoparticles can also create a zone of influence around their surface known as interphase which restricts the mobility of the matrix within this phase. This restricted mobility can also contribute towards higher glass transition temperatures, especially since nanoparticles posses large surface areas. As a result of the above competing factors, many studies have shown that the addition of nanoparticles like CNTs to epoxy results in either a reduction, increase or unaffected glass transition.50
From the DMA results in Fig. 10, there are only slight changes in the glass transition temperature with the addition of CNWs. However, it is interesting to note that the addition of 0.25 wt% CNWs to neat epoxy reduces the glass transition temperature by 1.83 °C; while the addition of 0.5 wt% and 0.75 wt% CNWs to neat epoxy raises the glass transition again to 1.94 °C and 0.01 °C above neat epoxy. Furthermore, there is a possibility that the pendant amine groups on chitin would react with the epoxide groups on DGEBA, resulting in stoichiometric imbalance between these two groups. However, FTIR spectra of the epoxy CNWs nanocomposites indicates no significant difference in the cross linking with the addition of CNWs (ESI Fig. S1†). This indicates that CNWs addition does not significantly imbalance epoxy stoichiometry. The reduction in glass transition temperature with the addition of 0.25 wt% CNWs specifically, is also displayed in the results from the DSC analysis, as discussed in the proceeding section.
Differential calorimetric and thermal degradation analysis
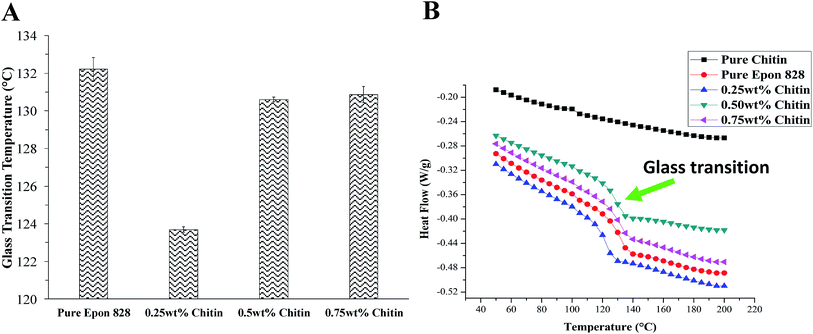
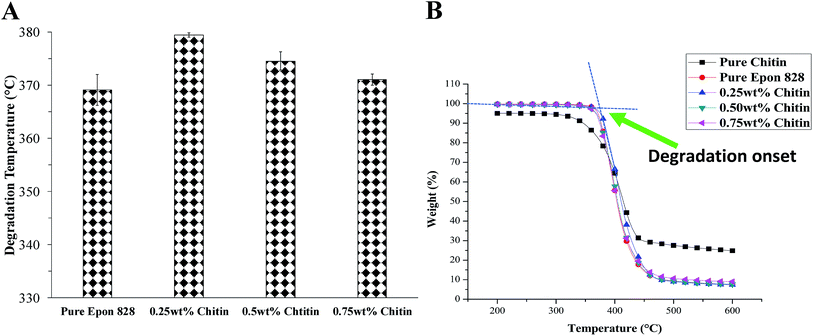
Fig. 11 presents the data from the thermal calorimetric analysis of the epoxy CNWs nanocomposites, neat epoxy and pure chitin. Pure CNWs does not show any significant glass transition temperature except for a slight drop in the baseline between 100 °C and 105 °C. Neat epoxy and all the epoxy CNWs nano-composites show a noticeable glass transition temperature occurring as a knee in the heat flow curve. The addition of 0.25 wt% CNWs in the nanocomposites results in a decrease in the glass transition temperature from 132.2 °C to 123.7 °C. This is then followed by an increase to 130.6 °C and 130.9 °C at 0.5 wt% and 1 wt% CNWs content in epoxy respectively. The magnitude of the changes and exact glass transition temperature as obtained from the DSC differ from that of the DMA as discussed above. While both these techniques probe thermodynamic changes (release of molecular degrees of freedom) occurring at glass transition, they measure fundamentally different quantities. Specifically, the DMA measures time dependant mechanical response as captured by the loading frequency. This time dependence plays a significant role in the activation of co-operative chain motion, which is an essential component of softening at the glass transition. In contrast with the DMA, the DSC is not particularly well suited for measuring glass transition temperature of highly crosslinked polymers such as epoxies. The reason for this is due to the small changes in heat capacity as the temperature crosses the glass transition for these types of polymer systems. Hence high heating rates are required in the DSC to obtain heat capacity differences holding significance. At high heating rates, the possibility of non-uniform temperature distribution within the polymer system is higher. In contrast, the DMA testing through the glass transition results in several orders of magnitude change in the storage modulus, loss modulus and tan delta occurs. As the result, the DMA can be run at much lower heating rates. In the current study, the samples were heated at 10 °C min−1 in the DSC vs. 2 °C min−1 in the DMA. However, even with these differences, both the DMA and DSC results indicate that the glass transition temperature reduces at 0.25 wt% CNWs content followed by an increase at higher weight percentages of CNWs. From the TEM micrographs (Fig. 5), 0.25 wt% CNWs composites appear to have noticeably smaller CNWs clusters as compared to 0.5 wt% and 0.75 wt% CNWs composites. This reduction in cluster size is believed to have an affect on co-operative chain motion, thus displaying a uniquely different behaviour of the glass transition temperature at 0.25 wt% CNWs compared to other CNWs contents.Fig. 12 presents the thermal degradation behaviour of the epoxy CNWs nano-composites along with neat epoxy and chitin nano-whiskers. For pure CNWs, initial weight loss and degradation upto 200 °C corresponds to loss of adsorbed water molecules and other volatiles from within the CNWs structure. This is followed by a second major degradation event between 312 °C and 447 °C, resulting in a loss of more than 65 wt% of the initial mass. This corresponds to the elimination of side groups and degradation of the polymer backbone.51 In the case of neat epoxy, a single step degradation occurs between 364 °C and 472 °C resulting in the loss of 89% of the initial mass of epoxy. With the addition of 0.25 wt% CNWs, the degradation temperature of neat epoxy increases from 369.1 °C to 379.4 °C. However, the degradation temperature drops to 374.5 °C and 371 °C with the addition of 0.5 wt% and 0.75 wt% CNWs in epoxy respectively. As with the change in the observed glass transition temperature, there is a notable increase in the degradation temperature at 0.25 wt% CNWs followed by a decrease at higher CNWs contents. Despite the lower degradation temperature of both neat epoxy and CNWs. This is indicative of microstructural/chemical modification of the epoxy due to the size scale of CNWs dispersion at 0.25 wt%.
Conclusions
In this study, we used a slurry compounding based method to develop optically transparent chitin nano-whiskers (CNWs)-epoxy nano-composites followed by characterization of their morphological, mechanical, dynamic mechanical, calorimetric and thermal degradation properties. The composite morphology contains increasingly larger clusters at higher weight contents of CNWs. From our investigation, composites with 0.25 wt% CNWs show the highest enhancement in the young's modulus and tensile strength whereas the highest KIC and GIC is obtained for composites with 0.75 wt% CNWs. All the composites of epoxy with CNWs showed crack arrest tendency after first major crack propagation, whereas neat epoxy showed glassy fracture without any crack arrest. The highest resilience (energy to tensile failure) and strain to break is also obtained for composites with 0.75 wt% CNWs. It is believed that the higher resilience is one of the primary reasons for increase in the crack tip ductility and the fracture toughness with the addition of 0.75 wt% CNWs. The SEM and TEM morphologies revealed larger clustered regions of CNWs in the case of epoxy with 0.75 wt% CNWs; a possible mechanism for increase in the fracture resistance and resilience is the inter-fibril sliding within the CNWs clusters. Dynamic mechanical analysis also shows the greatest damping for epoxy with 0.75 wt% CNWs as compared to the other compositions. The glass transition (Tg) and thermal degradation temperature show an increase and decrease respectively with the addition of 0.25 wt% CNWs to neat epoxy.Conflicts of interest
There are no conflicts to declare.Acknowledgements
The authors of this work would like to gratefully acknowledge the support from National Sciences and Engineering Research Council of Canada (NSERC) [funding reference number(s): PGSD2-504550-2017; USRA-526502-2018], Canada Foundation for Innovation (CFI), and Canada Research Chairs (CRC).References
- J. Araki, Y. Yamanaka and K. Ohkawa, Chitin-chitosan nanocomposite gels: reinforcement of chitosan hydrogels with rod-like chitin nanowhiskers, Polym. J., 2012, 44(7), 713 CrossRef CAS.
- J. A. King, D. R. Klimek, I. Miskioglu and G. M. Odegard, Mechanical properties of graphene nanoplatelet/epoxy composites, J. Appl. Polym. Sci., 2013, 128(6), 4217–4223 CrossRef CAS.
- Y. Rachmadini, V. B. C. Tan and T. E. Tay, Enhancement of mechanical properties of composites through incorporation of CNT in VARTM-a review, J. Reinf. Plast. Compos., 2010, 29(18), 2782–2807 CrossRef CAS.
- M. M. Shokrieh and R. Rafiee, A review of the mechanical properties of isolated carbon nanotubes and carbon nanotube composites, Mech. Compos. Mater., 2010, 46(2), 155–172 CrossRef CAS.
- S. Pavlidou and C. D. Papaspyrides, A review on polymer–layered silicate nanocomposites, Prog. Polym. Sci., 2008, 33(12), 1119–1198 CrossRef CAS.
- K. Lau, C. Gu and D. Hui, A critical review on nanotube and nanotube/nanoclay related polymer composite materials, Composites, Part B, 2006, 37(6), 425–436 CrossRef.
- R. Arvidsson, D. Kushnir, B. A. Sandén and S. Molander, Prospective life cycle assessment of graphene production by ultrasonication and chemical reduction, Environ. Sci. Technol., 2014, 48(8), 4529–4536 CrossRef CAS PubMed.
- V. Khanna, B. R. Bakshi and L. J. Lee, Carbon nanofiber production: life cycle energy consumption and environmental impact, J. Ind. Ecol., 2008, 12(3), 394–410 CrossRef CAS.
- P. Kumar, K. P. Sandeep, S. Alavi, V. D. Truong and R. E. Gorga, Preparation and characterization of bio-nanocomposite films based on soy protein isolate and montmorillonite using melt extrusion, J. Food Eng., 2010, 100(3), 480–489 CrossRef CAS.
- H. P. S. A. Khalil, A. H. Bhat and A. F. I. Yusra, Green composites from sustainable cellulose nanofibrils: a review, Carbohydr. Polym., 2012, 87(2), 963–979 CrossRef.
- S. Kalia, A. Dufresne, B. M. Cherian, B. S. Kaith, L. Avérous and J. Njuguna, et al., Cellulose-based bio-and nanocomposites: a review, Int. J. Polym. Sci., 2011, 2011, 837875 Search PubMed.
- R. J. Moon, A. Martini, J. Nairn, J. Simonsen and J. Youngblood, Cellulose nanomaterials review: structure, properties and nanocomposites, Chem. Soc. Rev., 2011, 40(7), 3941–3994 RSC.
- M. A. S. Azizi Samir, F. Alloin and A. Dufresne, Review of recent research into cellulosic whiskers, their properties and their application in nanocomposite field, Biomacromolecules, 2005, 6(2), 612–626 CrossRef PubMed.
- I. Siró and D. Plackett, Microfibrillated cellulose and new nanocomposite materials: a review, Cellulose, 2010, 17(3), 459–494 CrossRef.
- E. Khor and L. Y. Lim, Implantable applications of chitin and chitosan, Biomaterials, 2003, 24(13), 2339–2349 CrossRef CAS PubMed.
- M. Mincea, A. Negrulescu and V. Ostafe, Preparation, modification, and applications of chitin nanowhiskers: a review, Rev. Adv. Mater. Sci., 2012, 30(3), 225–242 CAS.
- P. Visakh and S. Thomas, Preparation of Bionanomaterials and their Polymer Nanocomposites from Waste and Biomass, Waste Biomass Valorization, 2010, 1(1), 121–134 CrossRef CAS , available from: http://resolver.scholarsportal.info/resolve/18772641/v01i0001/121_pobatpnfwab.
- A. Morin and A. Dufresne, Nanocomposites of chitin whiskers from Riftia tubes and poly (caprolactone), Macromolecules, 2002, 35(6), 2190–2199 CrossRef CAS.
- M. I. Ofem, A. J. Anyandi and E. B. Ene, Properties of chitin reinforces composites: a review, Nigerian Journal of Technology, 2017, 36(1), 57–71 Search PubMed.
- I. Aranaz, M. Mengíbar, R. Harris, I. Paños, B. Miralles and N. Acosta, et al., Functional characterization of chitin and chitosan, Curr. Chem. Biol., 2009, 3(2), 203–230 CAS.
- J. Li, J. Revol and R. H. Marchessault, Effect of degree of deacetylation of chitin on the properties of chitin crystallites, J. Appl. Polym. Sci., 1997, 65(2), 373–380 CrossRef CAS.
- Y. Lu, L. Weng and L. Zhang, Morphology and properties of soy protein isolate thermoplastics reinforced with chitin whiskers, Biomacromolecules, 2004, 5(3), 1046–1051 CrossRef CAS PubMed.
- M. Shibata, J. Fujigasaki, M. Enjoji, A. Shibita, N. Teramoto and S. Ifuku, Amino acid-cured bio-based epoxy resins and their biocomposites with chitin-and chitosan-nanofibers, Eur. Polym. J., 2018, 98, 216–225 CrossRef CAS.
- J. Junkasem, R. Rujiravanit and P. Supaphol, Fabrication of α-chitin whisker-reinforced poly (vinyl alcohol) nanocomposite nanofibres by electrospinning, Nanotechnology, 2006, 17(17), 4519 CrossRef CAS.
- E. C. Botelho, R. A. Silva, L. C. Pardini and M. C. Rezende, A review on the development and properties of continuous fiber/epoxy/aluminum hybrid composites for aircraft structures, Mater. Res., 2006, 9(3), 247–256 CrossRef CAS.
- C. Soutis, Fibre reinforced composites in aircraft construction, Prog. Aerosp. Sci., 2005, 41(2), 143–151 CrossRef.
- A. A. Azeez, K. Y. Rhee, S. J. Park and D. Hui, Epoxy clay nanocomposites–processing, properties and applications: a review, Composites, Part B, 2013, 45(1), 308–320 CrossRef CAS.
- J. H. Hodgkin, G. P. Simon and R. J. Varley, Thermoplastic toughening of epoxy resins: a critical review, Polym. Adv. Technol., 1998, 9(1), 3–10 CrossRef CAS.
- J.-P. Pascault and R. J. J. Williams, Epoxy polymers: new materials and innovations, John Wiley & Sons, 2009 Search PubMed.
- M. N. Ravi Kumar, A review of chitin and chitosan applications, React. Funct. Polym., 2000, 46(1), 1–27 CrossRef.
- J. Wu and J. C. Meredith, Assembly of chitin nanofibers into porous biomimetic structures via freeze drying, ACS Macro Lett., 2014, 3(2), 185–190 CrossRef CAS.
- J. Lee and Y. Cheng, Critical freezing rate in freeze drying nanocrystal dispersions, J. Controlled Release, 2006, 111(1–2), 185–192 CrossRef CAS PubMed.
- W. Abdelwahed, G. Degobert, S. Stainmesse and H. Fessi, Freeze-drying of nanoparticles: formulation, process and storage considerations, Adv. Drug Delivery Rev., 2006, 58(15), 1688–1713 CrossRef CAS PubMed , available from: http://resolver.scholarsportal.info/resolve/0169409x/v58i0015/1688_fonfpasc.
- M. J. Choi, S. Briancon, J. Andrieu, S. G. Min and H. Fessi, Effect of freeze-drying process conditions on the stability of nanoparticles, Drying Technol., 2004, 22(1–2), 335–346 CrossRef CAS.
- M. Wang, H. Xue, Z. Feng, B. Cheng and H. Yang, Increase of tensile strength and toughness of bio-based diglycidyl ether of bisphenol A with chitin nanowhiskers, PLoS One, 2017, 12(6), e0177673 CrossRef PubMed.
- ASTM D5045-14, Standard, Test Methods for Plane-Strain Fracture Toughness and Strain Energy Release Rate of Plastic Materials, ASTM International, West Conshohocken, PA, 2014, http://www.astm.org Search PubMed.
- Q. Guan and H. E. Naguib, Fabrication and Characterization of PLA/PHBV-Chitin Nanocomposites and their Foams, J. Polym. Environ., 2014, 22(1), 119–130 CrossRef CAS.
- M. S. Konsta-Gdoutos, Z. S. Metaxa and S. P. Shah, Multi-scale mechanical and fracture characteristics and early-age strain capacity of high performance carbon nanotube/cement nanocomposites, Cem. Concr. Compos., 2010, 32(2), 110–115 CrossRef CAS , available from: http://resolver.scholarsportal.info/resolve/09589465/v32i0002/110_mmafcaohpcnn.
- Y. Kim, R. Jung, H.-S. Kim and H.-J. Jin, Transparent nanocomposites prepared by incorporating microbial nanofibrils into poly(l-lactic acid), Curr. Appl. Phys., 2009, 9(1, suppl.), S69–S71 CrossRef , available from: http://www.sciencedirect.com/science/article/pii/S1567173908001934.
- L.-X. Gong, L. Zhao, L.-C. Tang, H.-Y. Liu and Y.-W. Mai, Balanced electrical, thermal and mechanical properties of epoxy composites filled with chemically reduced graphene oxide and rubber nanoparticles, Compos. Sci. Technol., 2015, 121, 104–114 CrossRef CAS.
- L.-C. Tang, X. Wang, Y.-J. Wan, L.-B. Wu, J.-X. Jiang and G.-Q. Lai, Mechanical properties and fracture behaviors of epoxy composites with multi-scale rubber particles, Mater. Chem. Phys., 2013, 141(1), 333–342 CrossRef CAS.
- L.-Z. Guan, L. Zhao, Y.-J. Wan and L.-C. Tang, Three-dimensional graphene-based polymer nanocomposites: preparation, properties and applications, Nanoscale, 2018, 10(31), 14788–14811 RSC.
- J. Zang, Y. Wan, L. Zhao and L. Tang, Fracture Behaviors of TRGO-Filled Epoxy Nanocomposites with Different Dispersion/Interface Levels, Macromol. Mater. Eng., 2015, 300(7), 737–749 CrossRef CAS.
- L.-X. Gong, Y.-B. Pei, Q.-Y. Han, L. Zhao, L.-B. Wu and J.-X. Jiang, et al., Polymer grafted reduced graphene oxide sheets for improving stress transfer in polymer composites, Compos. Sci. Technol., 2016, 134, 144–152 CrossRef CAS.
- L. Tang, H. Zhang, J. Han, X. Wu and Z. Zhang, Fracture mechanisms of epoxy filled with ozone functionalized multi-wall carbon nanotubes, Compos. Sci. Technol., 2011, 72(1), 7–13 CrossRef CAS.
- Y.-J. Wan, L.-C. Tang, L.-X. Gong, D. Yan, Y.-B. Li and L.-B. Wu, et al., Grafting of epoxy chains onto graphene oxide for epoxy composites with improved mechanical and thermal properties, Carbon, 2014, 69(suppl. C), 467–480 CrossRef CAS , available from: http://www.sciencedirect.com/science/article/pii/S0008622313012050.
- M. A. S. Anwer and H. E. Naguib, Study on the morphological, dynamic mechanical and thermal properties of PLA carbon nanofibre composites, Composites, Part B, 2016, 91, 631–639 CrossRef CAS.
- K. Holeczek, P. Kostka and N. Modler, Dry Friction Contribution to Damage-Caused Increase of Damping in Fiber-Reinforced Polymer-Based Composites, Adv. Eng. Mater., 2014, 16(10), 1284–1292 CrossRef CAS.
- L.-C. Tang, Y.-J. Wan, D. Yan, Y.-B. Pei, L. Zhao and Y.-B. Li, et al., The effect of graphene dispersion on the mechanical properties of graphene/epoxy composites, Carbon, 2013, 60, 16–27 CrossRef CAS.
- A. Allaoui and N.-E. El Bounia, How carbon nanotubes affect the cure kinetics and glass transition temperature of their epoxy composites?–a review, eXPRESS Polym. Lett., 2009, 3(9), 588–594 CrossRef CAS.
- P. Kumar Balasubramani and J. O. Iroh, Mechanism and kinetics of curing of diglycidyl ether of bisphenol a (DGEBA) resin by chitosan, Polym. Eng. Sci., 2017, 57(8), 865–874 CrossRef CAS.
Footnote |
| † Electronic supplementary information (ESI) available. See DOI: 10.1039/c9ra00769e |
| This journal is © The Royal Society of Chemistry 2019 |

