 Open Access Article
A reinforced thermal barrier coat of a Na–tannic acid complex from the view of thermal kinetics†
Sunghyun Nam *a,
Michael W. Easson
 a,
Brian D. Condona,
Matthew B. Hillyera,
Luyi Sun
 b,
Zhiyu Xiac and
Ramaswamy Nagarajanc
aUnited States Department of Agriculture, Agricultural Research Service, Southern Regional Research Center, 1100 Robert E. Lee Boulevard, New Orleans, LA 70124, USA. E-mail: sunghyun.nam@ars.usda.gov; Fax: +1 504 286 4390; Tel: +1 504 286 4229
bPolymer Program, Institute of Materials Science and Department of Chemical & Biomolecular Engineering, University of Connecticut, 97 North Eagleville Road, Storrs, CT 06269, USA
cDepartment of Plastics Engineering, University of Massachusetts, 185 Riverside Street, Lowell, MA 01854, USA
First published on 8th April 2019
Abstract
The poor burning resistance of cotton necessitates the control of its pyrolytic reactions, but many approaches have relied on the use of synthetically engineered chemicals. Herein, we show how a natural polyphenol from plants—tannic acid—acts with sodium ions to create a robust thermal barrier coat on cotton, with a focus on thermal kinetics. The kinetic information, combined with thermal and spectral analyses, revealed that the outer layer of galloyl units in tannic acid decomposes via a two-step reaction, producing a multicellular char of crosslinked aromatic rings, followed by the blowing of carbonaceous cells into a further expanded structure. This intumescent function of tannic acid was found to be enhanced upon its complexation with sodium ions, which greatly increased the activation energy for the first step of the reaction of tannic acid, to promote the formation of a stable char. The resulting blown char coated the cotton fiber below the thermal decomposition temperature of cellulose and was sustained throughout the decomposition. The enhanced thermal barrier performance of the Na–tannic acid complex was demonstrated by the reduced heat release capacity of cotton, the value of which was only about one-third that of tannic acid itself, and the inhibition of flame generation on cotton.
1. Introduction
The ease with which cotton—which is used in the majority of textiles—burns has always been considered a hazard.1 To prevent the danger posed by flammable textiles, governments have promulgated safety regulations for carpets, mattresses, children's sleepwear, and upholstery textiles. For example, mattresses sold in the U.S. must meet Federal Flammability Standards 16 CFR 1632 and 1633, as regulated by the U.S. Consumer Product Safety Commission. As a consequence, the use of flame-retardant fabrics continues to grow, and the global market for such fabrics is forecasted to be worth USD 6 billion by 2024.2 High-performing flame retardants do save lives and minimize property damage; however, their negative environmental and health impacts have been repeatedly reported. Many commercial flame retardants involve toxic chemical procedures and leach out into the air, surface water, and skin and are linked to asthma and cancer.3–6 Since the persistence, bioaccumulation, and toxic nature of halogenated flame retardants have been recognized, the development focus for cotton-based materials has been on phosphorus-containing products, such as hydroxymethylphosphonium salts and N-methylol phosphonopropionamide derivatives.7 These phosphorus compounds, however, are not free from toxicity, as indicated, e.g., by the release of formaldehyde during their usage.8Concerns over toxicity and the environmental impact associated with conventional synthetic flame retardants have generated demand for natural, inherently heat-resistant materials. Tannic acid, which is a natural polyphenol extracted from various plants, is one such molecule. Its structure is composed of a central glucose molecule esterified at all five hydroxyl moieties with two gallic acid molecules, thus forming a double layer of galloyl units. Tannic acid is water-soluble and possesses antioxidant,9,10 antibacterial,10–12 and anticarcinogenic properties,13,14 and thus it is used in a wide range of food and biomedical applications. The loading of tannic acid on silica improved antibacterial performance and hemorrhage control for wound healing applications.11 The oxidative coupling of tannic acid played an important role in extending the antibacterial and antioxidant activities of active networks for packaging.10 As a natural phenolic crosslinker, molecular glue, and antimicrobial agent, tannic acid has also been employed in the fabrication of tissue adhesives.12 The thermal stability of condensed tannins has been recognized when utilizing them in the fabrication of rigid foams.15 They exhibited good thermal insulating performance for use in interior and exterior wooden doors and wall panels.16,17 From an application standpoint, the thermal degradation process of tannic acid was examined using a series of thermal and analytical techniques.18 According to the proposed degradation mechanism, the outer galloyl units in tannic acid decomposed at 230–400 °C, producing volatile 1,2,3-benzenetriol and carbon dioxide, and subsequently the inner galloyl units decomposed at 400–750 °C, forming crosslinked aromatic structures. It was also proposed that the condensation of crosslinked aromatic rings at temperatures above 700 °C was responsible for the production of intumescent char. The thermal barrier function of tannic acid has been tested in two types of textile material. The treatment of tannic acid onto cotton fabrics significantly reduced the consumption of cotton and preserved the fiber morphology during pyrolysis.19 For nylon, which melts during burning, the coating of tannic acid in a crosslinked form (tannic acid terephthalate) impeded flame propagation along the fabric.20 The intumescent char embedded into the molten fibers prevented the inflamed melts from dripping.
Despite several studies suggesting the potential of tannic acid as a new bio-based flame retardant, the mechanism of its intumescence has not yet been established. For example, the temperature (>700 °C) reported for the formation of the intumescent char is too high to protect cotton from thermal damage, which occurs mainly at 300–400 °C. In this study, we investigated how tannic acid develops intumescence during its thermal decomposition and showed a simple, easy way to improve its performance. The type of char is closely linked to decomposition rates, chemical transformations, and the generation of gaseous and solid products.21 Here, we devoted special attention to the kinetics of thermal reactions, in particular the activation energy (Ea), through dynamic thermogravimetric analysis. Based on a three-dimensional diffusion mechanism for the thermal decomposition of condensed phase flame-retardants, Ea is evaluated for volatile evolution, i.e., the higher the value of Ea, the slower the volatile evolution, thus reflecting the formation of thermally stable char.22,23 Calculating the Ea values corresponding to individual thermal reactions of tannic acid, along with monitoring the morphology and chemical structure of the char, provided insight into the chemistry of its pyrolysis that created char expansion. The enhanced heat and flame protection from tannic acid upon complexing with sodium ions was demonstrated via the conducting of open flammability tests.
2. Experimental
2.1. Materials
American upland raw cotton fiber was acquired from the national registry. Tannic acid (C76H52O46), Triton X-100, and acetic acid (glacial, ≥99.85%) were purchased from Sigma-Aldrich. Sodium hydroxide (NaOH) was purchased from J. T. Baker. All chemicals were used as received. Deionized water was used as a solvent.2.2. Sample preparation
Hydroentangled nonwoven cotton fabrics were fabricated in the nonwoven pilot plant at the Southern Regional Research Center. The details of nonwoven fabrication using cotton processing and pilot-scale nonwoven production equipment have been described in the literature.24 To eliminate the effects of the noncellulosic components of cotton fiber on the thermal reactions of cellulose,25,26 alkaline scouring was carried out according to a published procedure.27 Scoured fabric was immersed in an aqueous solution containing various concentrations of tannic acid and NaOH for 5 min. For the complexation of tannic acid with sodium ions, a mixed solution of tannic acid and NaOH was agitated for 5 min before immersing the fabric. The treated fabric was passed through a laboratory padder (Werner Mathis, Concord, NC), at a pressure of 68.9 kPa (10 psi) and a padder speed of 2 m min−1, and air-dried at room temperature. Increased immersion times (10 and 30 min) and an increased drying temperature (70 °C) did not significantly influence the TG thermograms of the treated cotton (Fig. S1 and S2, respectively†). Cotton fabric samples treated with 20% tannic acid alone, 1% NaOH alone, and a mixture of 20% tannic acid and 1% NaOH were denoted as cotton-T, cotton-N, and cotton-TN, respectively.2.3. Characterization
Thermogravimetric (TG) and differential thermogravimetric (DTG) analyses were carried out using a TGA Q500 thermal gravimetric analyzer (TA Instruments) under a nitrogen atmosphere. The nitrogen flow into the furnace was maintained at a rate of 90 mL min−1. Approximately 5 mg of sample placed in a platinum pan was heated from 30 ± 5 °C to 900 °C at a heating rate of 10 °C min−1. TG and DTG thermograms were analyzed using Universal Analysis 2000 software (TA Instruments). Three measurements were performed. For the stepwise isothermal experiments, the temperature was increased to 500 °C at a heating rate of 20 °C min−1. Isothermal mode was applied immediately when the weight-loss rate was greater than 8% min−1, and heating continued while the weight-loss rate decreased to less than 0.05% min−1. For the thermal kinetics study, each sample was analyzed at four heating rates—1, 2, 5, and 10 °C min−1.Images of the samples, which were removed from the TG furnace at the desired temperature, were taken using a KH-8700 digital microscope (Hirox) in reflection mode and a scanning electron microscope (XL 30, Philips). The samples for SEM imaging were coated with a gold-palladium alloy using a vacuum sputter coater and observed at an acceleration voltage of 10–12 keV and a beam current of 0.5 nA.
The combustion properties were evaluated using a microscale combustion calorimeter (MCC) (MCC-2, Deatak) according to the ASTM D 7309-13 protocol. Approximately 5 mg of ground fiber sample was placed in a ceramic cup and weighed on an analytical balance (XP205, Mettler-Toledo). The sample was then heated to 650 °C at a heating rate of 1 °C s−1 in a stream of nitrogen flowing at 80 cm3 min−1. The volatile thermal decomposition products formed in the pyrolyzer were swept along by the nitrogen gas stream and fully mixed with an oxygen stream at 20 cm3 min−1 in a combustor, where the decomposed products were completely oxidized at 900 °C for 10 s. The oxygen depletion involved in the combustion was determined in terms of the oxygen concentration and flow rate of the combustion gases to measure the heat release rate (HRR). The parameters obtained using MCC Curve Fit v.2 software (Deatak) are as follows: the specific HRR (W g−1) obtained by dividing the HRR by the initial sample mass; the peak heat release rate (PHRR, W g−1), which is the maximum specific HRR; the temperature at the PHRR (TPHRR, °C); the heat release capacity (HRC, J g−1 K), obtained by dividing the PHRR by the heating rate; the total heat release (THR, J g−1), which is the area under the specific HRR peak; and char content, which is determined by weighing the sample before and after pyrolysis. Average values of three measurements are presented.
ATR-FTIR spectra were obtained using a Vertex 70v FTIR spectrometer (Bruker Daltonics) equipped with a MIRacle ATR accessory (Pike Technologies) that incorporated a diamond crystal plate as the reflector. Three measurements at different locations for each sample were conducted over the spectrum range of 4000–600 cm−1 at a resolution of 4 cm−1 and over 32 scans. All spectra are given in terms of transmittance and no ATR correction was applied.
Raman spectra were measured using a DXR2 Raman microscope (Thermo Scientific) with the following instrument settings: a 780 nm laser with an output power of 5 mW; a 10× confocal microscope objective with a 3 μm spot diameter; 5 cm−1 spectral resolution; and a 50 μm slit width over a 2 s integration time. Three measurements at separate locations were conducted over the spectral range of 250–2000 cm−1.
Experiment design using Design-Expert® version 9.0.3.1 (Stat-Ease) was carried out to examine the effects of two factors—the concentrations of tannic acid and sodium hydroxide—on the HRC and char yield of cotton. The experimental design used was balanced. Lack-of-fit tests were performed to validate the model.
Flame resistance was examined using a vertical flammability tester (VC-1, Govmark), according to the test method ASTM D6413-99, and a 45° angle flammability tester (TC 45, Govmark), according to the ASTM D1230-10 protocol. A standardized flame was applied to the fabric for 12 and 5 seconds for the vertical and 45° angle flammability tests, respectively. The times that the flame and glow sustained for on the fabric after the removal of the flame (denoted as the after flame time and afterglow time, respectively) were measured. Average values of three measurements were presented. The burning behavior of samples during these tests was recorded using a digital camera (RX100, Sony). The limiting oxygen index (LOI) was measured using a LOI chamber (Dynisco), according to the ASTM D2863-00 protocol.
2.4. Determination of activation energy
The activation energy for the thermal decomposition of samples was determined via the differential isoconversional method of Friedman,28 using AKTS-Thermokinetics software (version 4.46). This method is based on the following fundamental kinetic equation, which describes the rate of conversion, dα/dt, as a function of two time-dependent variables—temperature (T) and the conversion of the reaction (α). The value of α varies from 0 to 1 from initiation to completion.
 | (1) |
 | (2) |
 | (3) |
 | (4) |
Obtaining the natural logarithm of both sides of eqn (4) yields the following equation, which expresses dα/dt. as a function of the reciprocal temperature at any value of α:
 | (5) |
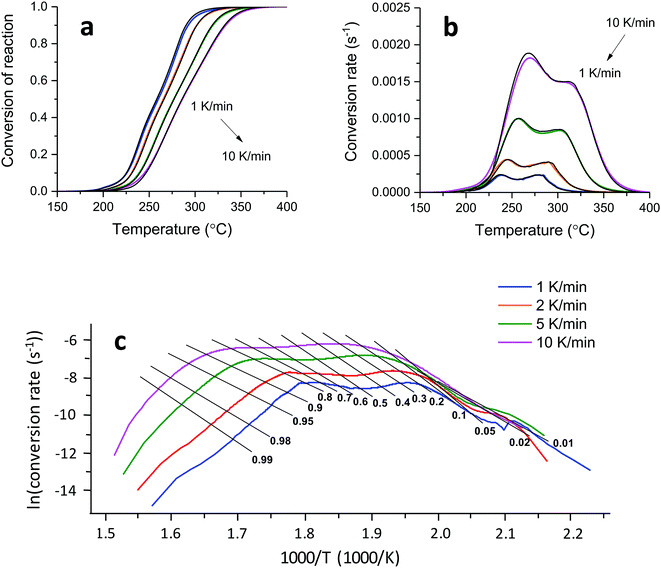
At any fixed value of α, f(α) is a constant, and thus the dependence of dα/dt on 1/T at a given value of α leads to a straight line, with the slope equal to −Ea(α)/R and the intercept equal to ln(A(α)f(α)). The obtained differential isoconversional results can be applied to simulate the time taken to reach a given value of α(tα) using the following expression:
 | (6) |
3. Results and discussion
3.1. Thermal properties of tannic acid
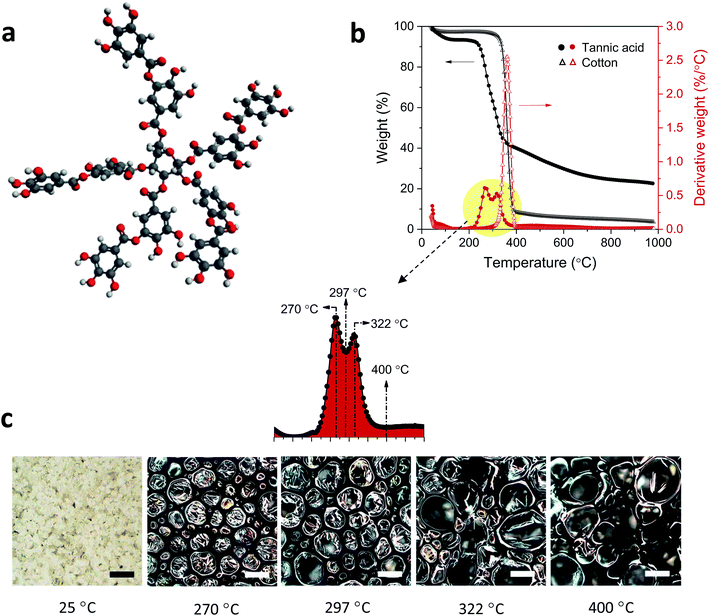
Tannic acid consists of a central core of glucose and two (inner and outer) layers of five gallic acid units (Fig. 1a). These three substructures are all connected through ester linkages. The approximate molar masses (in percentages) of the core, inner layer, and outer layer are 5.6%, 44.7%, and 49.7%, respectively. Fig. 1b shows TG and DTG thermograms of tannic acid compared with those of cotton. The corresponding thermal parameters are summarized in Table 1. Tannic acid started to decompose at around 190 °C, which is 120 °C lower than the onset decomposition temperature (To) of cotton cellulose. The weight loss from tannic acid at To (WLo) resulting from the removal of moisture was greater than that from cotton (6.7% versus 4.0%). In the DTG analysis, tannic acid developed a doublet peak centered at 269.5 °C and 321.6 °C, whereas cotton exhibited a single peak at 361.3 °C. The decomposition of the five outer-layer gallic acid units in tannic acid has been reported to occur via decarboxylation in the temperature range of 230–400 °C.18 It is suspected that the observed doublet results from the overlapping decomposition of various gallic acid units from distinct branches.| Tannic acid | Cotton | Cotton-T | Cotton-N | Cotton-TN | ||
|---|---|---|---|---|---|---|
| a T: temperature; o: onset decomposition; m: maximum decomposition rate; e: end of major decomposition; WL: weight loss. Figures in parentheses are standard deviations of the three measurements.b Char amount measured at 700 °C. | ||||||
| TG | To (°C) | 189.0 (0.7) | 309.8 (1.1) | 212.0 (2.3) | 190.0 (0.9) | 189.8 (0.9) |
| WLo (%) | 6.7 (1.2) | 4.0 (1.2) | 3.6 (0.8) | 3.9 (2.2) | 5.4 (1.5) | |
| Tm (°C) | 269.5 (2.1) | 361.3 (0.5) | 344.1 (1.1) | 336.1 (1.2) | 343.1 (0.8) | |
| WLm (%) | 21.2 (1.5) | 50.7 (1.2) | 51.2 (2.5) | 48.9 (2.2) | 46.7 (1.1) | |
| Te (°C) | 352.2 (1.7) | 390.5 (0.7) | 368.3 (3.1) | 364.3 (0.9) | 365.3 (0.5) | |
| WLe (%) | 56.8 (0.8) | 91.1 (2.2) | 73.5 (2.7) | 69.1 (1.1) | 58.8 (0.6) | |
| Char yieldb (%) | 26.4 (2.3) | 5.2 (0.4) | 15.9 (1.2) | 19.2 (1.1) | 27.5 (1.0) | |
| MCC | HRC (J g−1 K) | 141.2 (1.1) | 268.5 (5.3) | 168.0 (1.7) | 116.0 (3.5) | 49.7 (0.8) |
| PHRR (W g−1) | 198.0 (6.8) | 351.0 (9.3) | 223.7 (1.2) | 154.3 (5.8) | 61.4 (1.2) | |
| TPHRR (°C) | 282.5 (3.5) | 382.8 (2.7) | 353.5 (1.5) | 351.2 (2.3) | 355.3 (1.7) | |
| THR (kJ g−1) | 7.2 (0.1) | 12.2 (0.2) | 8.8 (0.2) | 5.6 (0.1) | 4.1 (0.3) | |
| Char yield (%) | 21.2 (1.5) | 6.7 (0.8) | 16.5 (0.5) | 22.5 (0.2) | 33.9 (0.5) | |
Further examination using the stepwise isothermal mode was carried out to discern the thermal process of tannic acid decomposition at higher resolution. As shown in Fig. 2, the two consecutive decomposition processes were separated clearly over time and temperature through maintaining the TG furnace temperature at about 276 °C. The first decomposition fully evolved and ended with 42.1% weight loss, followed by the second process involving 8.7% weight loss. Calculations based on the molar mass (Table 2) indicate that the weight losses resulting from the two-step decomposition could be correlated with equivalent numbers of galloyl units. The weight loss from the first decomposition was close to the molar mass of four galloyl units, including the ester group. The loss of water molecules due to the condensation of phenolic hydroxyl groups or the decarboxylation of inner galloyl units may account for the extra molar mass. The second DTG peak corresponds to the mass loss of one galloyl unit, including the ester group. Differences in the steric structure and inconsistent inter/intramolecular forces between galloyl units may lead to such complex decomposition behavior.
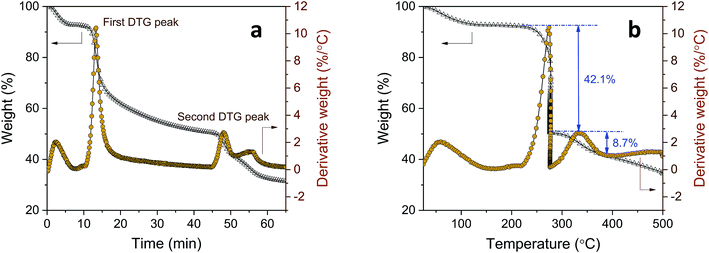 | ||
| Fig. 2 The TG stepwise isothermal analysis of tannic acid: (a) weight loss versus time; and (b) weight loss versus temperature. | ||
| Temperature range (°C) | Weight loss (%) | Corrected weight lossa (%) | Molar mass with respect to tannic acid (g mol−1) | Equivalent number of galloyl units based on molar mass | |
|---|---|---|---|---|---|
| a Weight loss corrected for moisture content. | |||||
| First DTG peak | 220–277 | 42.1 ± 0.3 | 45.5 ± 0.6 | 774 ± 10 | 4.6 ± 0.1 |
| Second DTG peak | 277–395 | 8.7 ± 0.2 | 9.5 ± 0.1 | 162 ± 2 | 1.0 ± 0.1 |
| Outer galloyl units including ester group | — | — | — | 169 | 1 |
3.2. Intumescence of tannic acid
Another noticeable difference observed from the DTG thermograms is that the maximum weight-loss rate of tannic acid is lower by a factor of four than that of cotton. This slower decomposition process resulted in the production of a large amount of char: 26.4% (5.2% for cotton) at 700 °C. The char yield is a good indicator of heat and mass transfer resistance during pyrolysis,21 i.e., the higher the char yield, the greater the thermal stability. Fig. 1c shows optical microscopy images at the characteristic DTG temperatures of tannic acid. When heating to the first DTG peak temperature (270 °C), tannic acid—a light yellow powder with a granule size of about 45 μm—was charred and greatly expanded to form a black dome-shaped structure consisting of a mass of round and brittle cells. The sizes of these cells varied greatly, from 20 to 300 μm in diameter. After the first decomposition (297 °C), the small cells further expanded, producing a more uniformly sized cellular structure. At the second DTG peak temperature (322 °C), some cells merged into larger cells with a loss of size uniformity. Finally, large cells (200–350 μm) were predominantly observed at the end of the second decomposition (400 °C).The development of intumescence is closely linked to chemical transformations during pyrolysis. Fig. 3 shows ATR-FTIR and Raman spectra of tannic acid heated at incremental temperatures. At Tm (270 °C), the bands at 1533 cm−1 and 1512 cm−1 corresponding to aromatic C![[double bond, length as m-dash]](https://www.rsc.org/images/entities/char_e001.gif) C stretching were diminished, indicating the dissociation of some gallic acid units and the formation of crosslinked aromatic structures with a lower dipole moment. Changes in other bands, such as O–H stretching at 3300 cm−1, C
C stretching were diminished, indicating the dissociation of some gallic acid units and the formation of crosslinked aromatic structures with a lower dipole moment. Changes in other bands, such as O–H stretching at 3300 cm−1, C![[double bond, length as m-dash]](https://www.rsc.org/images/entities/char_e001.gif) O stretching at 1701 cm−1, aromatic C–O symmetric stretching at 1606 cm−1, aromatic C–O asymmetric stretching at 1309 cm−1 and 1175 cm−1, C–O–C stretching at 1019 cm−1, and C–H out-of-plane deformation at 754 cm−1, were relatively small. However, these characteristic bands became less intense at 322 °C and almost unrecognizable at 400 °C due to the loss of most of the galloyl units. Since the inner and outer galloyl units share almost identical functional groups, the decomposition of the outer galloyl units was barely discernable.
O stretching at 1701 cm−1, aromatic C–O symmetric stretching at 1606 cm−1, aromatic C–O asymmetric stretching at 1309 cm−1 and 1175 cm−1, C–O–C stretching at 1019 cm−1, and C–H out-of-plane deformation at 754 cm−1, were relatively small. However, these characteristic bands became less intense at 322 °C and almost unrecognizable at 400 °C due to the loss of most of the galloyl units. Since the inner and outer galloyl units share almost identical functional groups, the decomposition of the outer galloyl units was barely discernable.
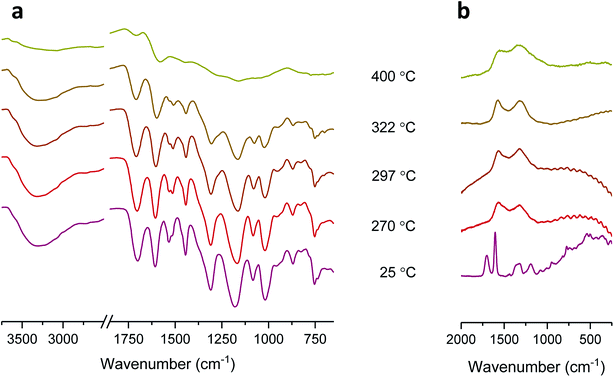 | ||
| Fig. 3 (a) ATR-FTIR spectra and (b) Raman spectra of tannic acid heated at its DTG characteristic temperatures. Samples without heat treatment were denoted as registering a temperature of 25 °C. | ||
Unlike the ATR-FTIR spectra, the Raman spectra exhibited dramatic changes at low temperatures. According to a previously published assignment,29 the two most intense peaks at 1700 cm−1 and 1606 cm−1 represent conjugated C![[double bond, length as m-dash]](https://www.rsc.org/images/entities/char_e001.gif) O and aryl C
O and aryl C![[double bond, length as m-dash]](https://www.rsc.org/images/entities/char_e001.gif) C stretching from the aromatic ring, respectively. The peaks at 1320 cm−1 and 1186 cm−1 were assigned to the O–H deformation and C–O stretching of phenols, respectively. At 270 °C, as Raman is most sensitive to symmetric covalent bonds with low dipole moments, the D-band at 1322 cm−1 and G-band at 1572 cm−1 became predominant; however, the polar C
C stretching from the aromatic ring, respectively. The peaks at 1320 cm−1 and 1186 cm−1 were assigned to the O–H deformation and C–O stretching of phenols, respectively. At 270 °C, as Raman is most sensitive to symmetric covalent bonds with low dipole moments, the D-band at 1322 cm−1 and G-band at 1572 cm−1 became predominant; however, the polar C![[double bond, length as m-dash]](https://www.rsc.org/images/entities/char_e001.gif) O, aryl C
O, aryl C![[double bond, length as m-dash]](https://www.rsc.org/images/entities/char_e001.gif) C, phenolic O–H, and C–O peaks were no longer recognizable. The appearance of the D-band and G-band indicates the formation of C–C bonds (sp2) with microcrystalline graphite-like ordered structures and an aromatic ring quadrant breathing mode, respectively.30–35 As the temperature increased to 400 °C, the D-band and G-band became broad, indicating the formation of more cross-linked aromatic structures in the residue. Therefore, it can be concluded that the observed intumescent char resulted from the decomposition of outer galloyl units.
C, phenolic O–H, and C–O peaks were no longer recognizable. The appearance of the D-band and G-band indicates the formation of C–C bonds (sp2) with microcrystalline graphite-like ordered structures and an aromatic ring quadrant breathing mode, respectively.30–35 As the temperature increased to 400 °C, the D-band and G-band became broad, indicating the formation of more cross-linked aromatic structures in the residue. Therefore, it can be concluded that the observed intumescent char resulted from the decomposition of outer galloyl units.
3.3. Thermal decomposition kinetics
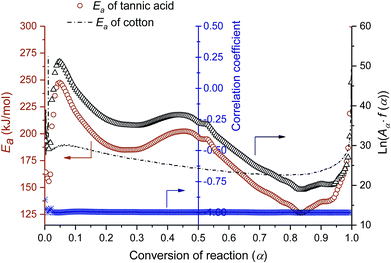
A kinetic analysis—calculating Ea values for the condensed phased decomposition reaction—can provide insight into the formation of a stable char, because the rate-determining step involves the diffusion of volatiles to or from the residual char.22 The differential isoconversional method used in this study does not rely on mathematical reaction models, so it avoids the risk of pre-assuming inappropriate reaction functions and thus leads to the more precise determination of Ea.36 Kinetic interpretation of the dynamic thermogravimetric data was carried out using a degree of conversion between 0 and 1. Fig. 4a and b show the dependencies of the conversion and the conversion rates of tannic acid, respectively, on temperature. The thermal reaction decelerated when α was close to 0 and 1. The reaction rate reached its maximum as the conversion reached its intermediate extent. As the heating rate increased, α and dα/dt shifted toward higher temperatures. Fig. 4c shows the differential isoconversional analysis, producing straight lines in plots of the logarithm of the conversion rate as a function of the reciprocal temperature (Eq. (5)). The analysis was conducted using 0.0001 intervals of α, and fifteen examples were selected for visual representation. The linear correlation coefficients were all greater than 0.99 over the entire conversion range, signifying the feasibility of this method.Fig. 5 shows the Ea values calculated from the slopes of the linear functions plotted as a function of α. The Ea values greatly varied as the reaction progressed, confirming the multistep decomposition process of tannic acid. Two local Ea maxima were observed near α = 0.05 and α = 0.4, reaching 247 and 202 kJ mol−1, respectively. The higher Ea values in the early stage indicate that the decomposition of four galloyl units produced fewer volatiles, favoring the formation of stable char. The subsequent decrease of Ea suggests that the evolution of volatiles was promoted during the dissociation of the rest of the outer galloyl layer. The resulting gaseous products, such as carbon dioxide (nonflammable), were considered responsible for blowing the char. These kinetic results support the intumescence development process proposed from the chemical and morphological analyses of the condensed phase. The resulting thermal resistance of tannic acid is demonstrated by its HRC (143 J g−1 K), which is almost half the HRC of cotton (Table 1).
3.4. Complexation of tannic acid
The effects of the complexation of tannic acid with sodium ions on the thermal barrier performance were examined. A total of 16 formulations in the concentration ranges of 0–20% for tannic acid and 0–1% for NaOH (two independent variables) were constructed for the experimental design. Using three replicates, two response variables (the HRC and char yield) of treated cotton fabric were measured. Fig. 6a and b show the two- and three-dimensional response surface plots of the HRC and char yield, respectively. Both response variables were described best via cubic models, as shown in eqn (7) and (8).| YH = 243.9 − 8.9T − 282.7N − 6.1TN + 1.2T2 + 1.53.9N2 + 0.4T2N − 0.1T3 | (7) |
| YC = 8.5 + 1.4T + 12.7N + 0.9TN − 0.2T2 + 31.1N2 − 0.2T2 − 0.1T2N − 29.6N3 | (8) |
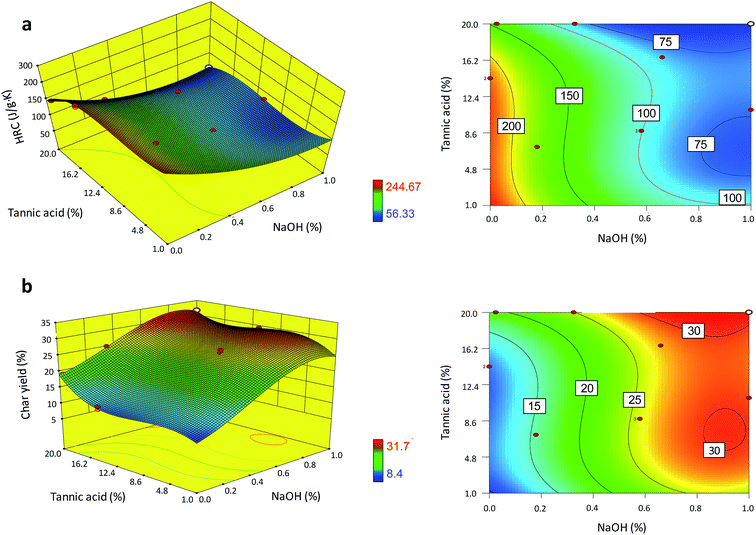 | ||
| Fig. 6 Three- and two-dimensional response surface plots of the (a) HRC and (b) char yield of cotton nonwoven fabric as a function of the concentrations of tannic acid and NaOH. | ||
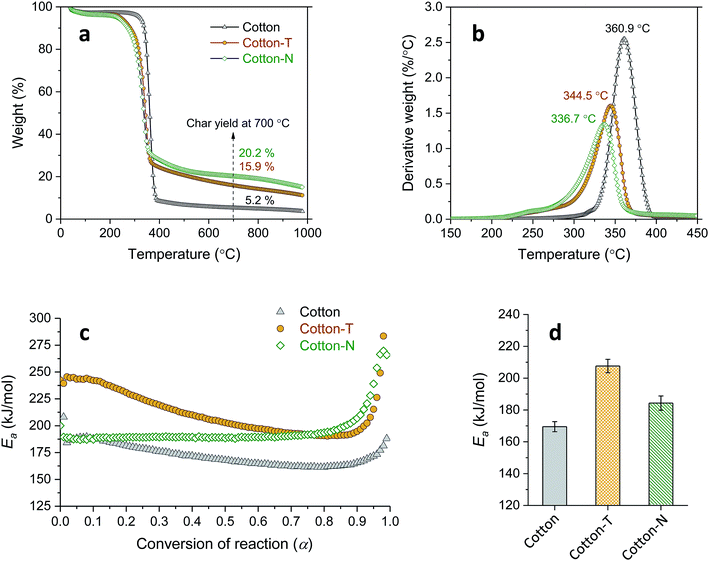
To better understand the interaction between the components, the individual effects of tannic acid and sodium ions were first examined. Fig. 7a and b show that both treatment with tannic acid and NaOH (cotton-T and cotton-N, respectively) similarly decreased the Ti and Tm values of cotton and diminished the weight-loss rate, resulting in an increase in the char yield. Despite the similarities between their effects on the TG and DTG thermograms, tannic acid and sodium ions influenced Ea differently (Fig. 7c). The cotton control exhibited slightly decreasing and monotonous behavior in terms of Ea at around 170 kJ mol−1. The relative steadiness of Ea during the course of the thermal decomposition of cotton cellulose has also been observed elsewhere.37 Treatment with tannic acid alone increased Ea to a similar extent as the reaction progressed, yielding the same decaying function. On the other hand, treatment with NaOH alone raised Ea at higher conversion values to maintain Ea at around 190 kJ mol−1 until α reached nearly 0.9. This altered evolution pattern of Ea is in accordance with the catalytic action of sodium ions, modifying the thermal reaction routes of cellulose.25,26 Sodium ions adsorbed onto cotton facilitate the dehydration reaction of cellulose at low temperatures but suppress the accelerated depolymerization reaction at high temperatures. This in turn indicates that tannic acid enhances the thermal stability of cotton primarily by forming a physical barrier of intumescent char, rather than by modifying the thermal reactions of cellulose. The average Ea value obtained at α = 0.1–0.9 was observed in the following order of magnitude: tannic acid treatment > NaOH treatment > cotton control.
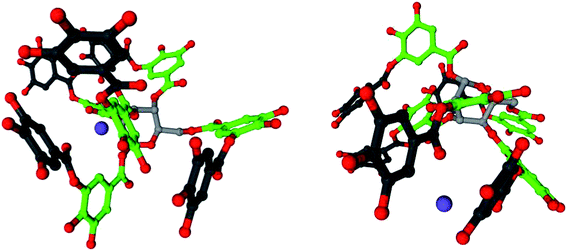
Tannins have excellent metal-binding capabilities.38 The hydroxyl groups of galloyl units in tannic acid readily adsorb sodium ions, forming a complex. Fig. 8 shows models of the complex with two sodium ions in a mixture of 20% tannic acid and 1% NaOH in water, which were visualized using Cinema 4D. The geometry of tannic acid was optimized using the semi-empirical method AM1 level of theory, and Hückel electrostatic potential maps were calculated using WebMO.39 The molecules were simulated using an SPC/E water model and CHARMM27 all-atom force field within the molecular dynamics simulation software GROMACS,40–42 using SwissParam for topology and parameters.43 The sodium ions were positioned near the hydroxyl groups of the galloyl units in the outer layer, as determined using the electrostatic potential map.
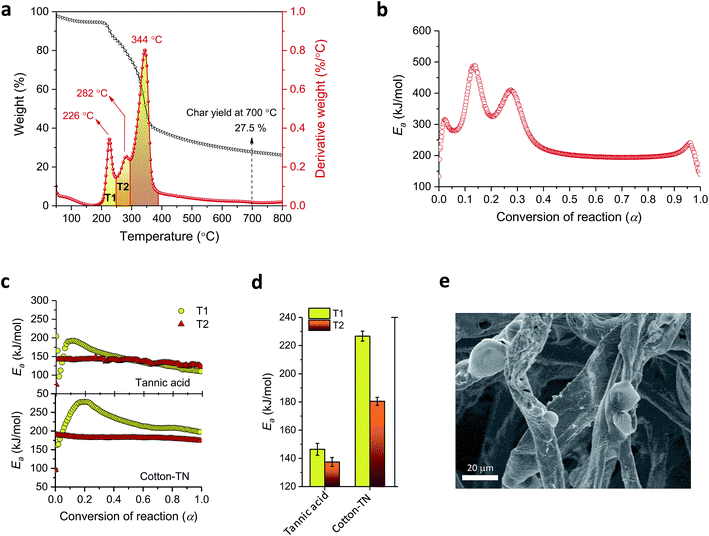
Fig. 9a shows TG and DTG thermograms of cotton treated with a mixture of 20% tannic acid and 1% NaOH (cotton-TN). As the addition of NaOH increased the adsorption of tannic acid onto cotton, the characteristic DTG doublet of tannic acid was detectable on the left shoulder of the peak from cellulose. Sodium ions shifted the DTG peaks of tannic acid to lower temperatures, i.e., from 270 °C to 226 °C for the first peak and from 322 °C to 282 °C for the second peak. The resulting char yield was 28%, which was 73% and 43% greater than those obtained from individual treatment with tannic acid and NaOH, respectively. It is noted that this char yield exceeded the char yield of tannic acid itself (Table 1), indicating the synergistic action of sodium ions on the control of thermal consumption.
Fig. 9b shows the Ea profile along with the thermal reaction progress for cotton-TN. Ea largely varied below α = 0.4 as a result of the decomposition of tannic acid, and then remained steady during the decomposition of cellulose. Ea for tannic acid appeared to increase when it was complexed with sodium ions. The Ea values corresponding to the first and second DTG peaks of tannic acid for cotton-TN (denoted as the T1 and T2 regions, respectively, in Fig. 9a) were individually calculated and compared with those for pure tannic acid (Fig. 9c). For pure tannic acid, the Ea values at T1 increased in the early stages of the reaction and gradually decreased as the reaction proceeded, whereas the Ea values for T2 were constant throughout the reaction. These distinctive Ea behaviors suggest that the decomposition of the four galloyl units involved more complex competitive or consecutive reactions rather than the subsequent decomposition of one galloyl unit at a time. The complexation with sodium ions did not significantly alter the patterns in the variation of Ea but greatly increased their magnitudes. The Ea values at T1 and T2 for cotton-TN were greater than the values at T1 and T2 for tannic acid itself. In particular, the Ea values at T1 were increased by 55% when complexing with sodium ions, indicating the greater effect of sodium ions on the first-step decomposition of the galloyl units.
3.5. Thermal barrier coating of the Na–tannic acid complex
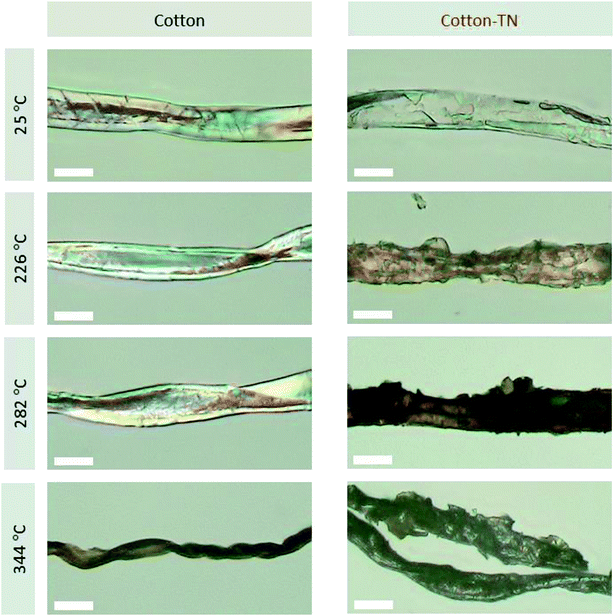
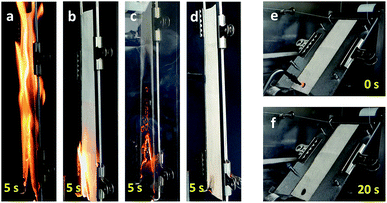
The thermal barrier performance of the Na–tannic acid complex was further examined by observing the fiber morphology at the DTG characteristic temperatures of cotton-TN (Fig. 10). Under the optical microscope, a cotton fiber exhibited its intrinsic (flat and twisted) ribbon-like structure and birefringence. After treatment, a thin film on the surface of the fiber was observed. When heated to 226 °C (the first DTG peak temperature), the entire surface of the fiber was coated by the expanded char of tannic acid. At 282 °C (the second DTG peak temperature), the char layer was further blown and exhibited a darker color. During the decomposition of tannic acid up to 282 °C, the cotton control showed no significant change in morphology. At 344 °C (Tm of cotton-TN), however, the cotton control fiber shrank dramatically and twisted along the fiber length. In contrast to such high consumption of the cotton control fiber, the cotton-TN fiber maintained its morphology during the major decomposition of cellulose. The char reinforced by sodium ions served as an effective protective barrier to hinder the diffusion of volatiles and heat to the underlying fiber, suppressing the combustion of the cotton fabric. The blown char layer remained at 400 °C (Fig. 9e), which was less observable following treatment with tannic acid alone (Fig. S3†).The synergistic effects of tannic acid and sodium ions, which were indicated by the HRC of cotton-TN—almost one-third that of the HRC of tannic acid itself (Table 1)—were demonstrated via open flammability tests. Table 3 presents a summary of the vertical and 45° angle flammability test results and LOI values for cotton, cotton-T, cotton-N, and cotton-TN fabric. Photographs of samples taken during vertical and 45° angle flammability testing are presented in Fig. 11. In the vertical flammability test, the cotton control immediately caught fire, even before the standard flame was placed onto the fabric, and most of the fabric was consumed by the rapid propagation of the flame within 12 s. Individual treatment with tannic acid or NaOH changed the burning behavior of cotton in a different manner. Tannic acid doubled the after flame time (i.e., slower propagation of the flame), whereas NaOH suppressed the flame and greatly increased the afterglow time from 6 to 95 s. Similar alterations to the flammability of cotton were observed in 45° angle flammability testing (Fig. S4†). On the other hand, a mixture of tannic acid and NaOH considerably suppressed the flammability of cotton, producing no flame on cotton and extending the afterglow time to 24 min before the complete consumption of the sample in the vertical flammability test. A ESI Video† showing the difficulty of ignition and the inhibition of flame generation on the cotton-TN sample is available. In the 45° angle flammability test, no ignition occurred on cotton-TN (Fig. 11f). This synergistic action of the Na–tannic acid complex was manifested by the LOI—individual treatment with tannic acid or NaOH yielded LOI values close to the value of the cotton control (18%), but a mixture of the two increased the LOI to 26%.
| Cotton | Cotton-T | Cotton-N | Cotton-TN | ||
|---|---|---|---|---|---|
| a Figures in parentheses are standard deviations from three measurements.b Used by the Consumer Product Safety Commission.c Textiles are considered by the trade to be generally acceptable for apparel based on an average time of flame spread of 3.5 s or more and no ignition.d Did not ignite. | |||||
| Vertical flammability | After flame time (s) | 12.2 (1.1) | 27.2 (2.5) | 4.3 (0.5) | 0.0 (0.0) |
| After glow time (s) | 6.3 (0.9) | 1.2 (0.5) | 95.2 (4.7) | 1450.4 (10.5) | |
| 45° angle flammability | Classificationb | Class 1c | Class 1 | Class 1 | Class 1 |
| After flame time (s) | 12.5 (2.3) | 28.3 (2.6) | 0.0 (0.0) | DNId | |
| Afterglow time (s) | 4.2 (1.1) | 1.2 (0.5) | 156.4 (3.5) | ||
| LOI (%) | 18.0 (0.0) | 22.0 (0.0) | 18.0 (0.0) | 25.7 (0.6) | |
4. Conclusions
Intumescence is an effective strategy for protecting materials from heat and flame, but it requires the formulation of several active components and the consolidation of these with a binder. This study showed that tannic acid, a plant-based polyphenol, itself has the potential of intumescence. Despite its nearly symmetric structure, the thermal decomposition of tannic acid was disproportionate, producing blown char via a two-step reaction. Four galloyl units in the outer layer of tannic acid were first decomposed and transformed into a multicellular char, and the subsequent decomposition of the one remaining galloyl unit further expanded the char. Thermal kinetic analysis using the differential isoconversional method indicates that the thermal barrier function of the char can be enhanced by the complexation of tannic acid with sodium ions. The introduction of low concentrations of sodium ions raised the activation energy for the thermal decomposition of tannic acid, releasing volatile species, and thus facilitated the formation of a thermally stable char. Na–tannic acid complexation effectively protected cotton against heat, as demonstrated by the 80% decrease in the heat release capacity of cotton and the inhibition of flame generation in open flammability tests. These results helped advance our understanding of the intumescence process of tannic acid and showed its synergistic action with sodium ions. They also suggest the suitability of an examination of the possible benefits of complexation with other metal ions for improving the thermal properties of tannic acid.Conflicts of interest
There are no conflicts of interest to declare. This research received no specific grant from any funding agency in the public, commercial, or not-for-profit sectors. The USDA is an equal opportunity provider and employer. The authors declare no competing financial interests.References
- M. G. Kamath, G. S. Bhat, D. V. Parikh and B. D. Condon, Processing and characterization of flame retardant cotton blend nonwovens for soft furnishings to meet federal flammability standards, J. Ind. Text., 2009, 38, 251–262 CrossRef CAS.
- Flame resistant fabrics market size - Growth analysis report 2024, Global Market Insights, Inc., Delaware, USA, October 2017 Search PubMed.
- I. Saito, A. Onuki and H. Seto, Indoor organophosphate and polybrominated flame retardants in Tokyo, Indoor Air, 2007, 17, 28–36 CrossRef CAS.
- A. Bacaloni, C. Cavaliere, P. Foglia, M. Nazzari, R. Samperi and A. Laganà, Liquid chromatography/tandem mass spectrometry determination of organophosphorus flame retardants and plasticizers in drinking and surface waters, Rapid Commun. Mass Spectrom., 2007, 21, 1123–1130 CrossRef CAS PubMed.
- K. Hoffman, A. Lorenzo, C. M. Butt, S. C. Hammel, B. B. Henderson, S. A. Roman, R. P. Scheri, H. M. Stapleton and J. A. Sosa, Exposure to flame retardant chemicals and occurrence and severity of papillary thyroid cancer: a case-control study, Environ. Int., 2017, 107, 235–242 CrossRef CAS PubMed.
- G. Meng, Y. Feng, Z. Nie, X. Wu, H. Wei, S. Wu, Y. Yin and Y. Wang, Internal exposure levels of typical POPs and their associations with childhood asthma in Shanghai, China, Environ. Res., 2016, 146, 125–135 CrossRef CAS PubMed.
- A. R. Horrocks, Flame retardant challenges for textiles and fibers: new chemistry versus innovatory solutions, Polym. Degrad. Stab., 2011, 96(3), 377–392 CrossRef CAS.
- A. K. R. Choudhury, Principles of Textile Finishing, Woodhead Publishing, 2017 Search PubMed.
- S. Maqsood and S. Benjakul, Preventive effect of tannic acid in combination with modified atmospheric packaging on the quality losses of the refrigerated ground beef, Food Control, 2010, 21, 1282–1290 CrossRef CAS.
- A. S. Glaive, T. Modjinou, D. L. Versace, S. Abbad-Andaloussi, P. Dubot, V. Langlois and E. Renard, Design of antibacterial and sustainable antioxidant networks based on plant phenolic derivatives used as delivery system of carvacrol or tannic acid, ACS Sustainable Chem. Eng., 2017, 5, 2320–2329 CrossRef CAS.
- C. Wang, H. Zhou, H. Niu, X. Ma, Y. Yuan, H. Hong and C. Liu, Tannic acid-loaded mesoporous silica for rapid hemostasis and antibacterial activity, Biomater. Sci., 2018, 6, 3318–3331 RSC.
- J. Guo, W. Sun, J. P. Kim, X. Lu, Q. Li, M. Lin, O. Mrowczynski, E. B. Rizk, J. Cheng, G. Qian and J. Yang, Development of tannin-inspired antimicrobial bioadhesives, Acta Biomater., 2018, 72, 35–44 CrossRef CAS PubMed.
- T. Koide, H. Kamei, Y. Hashimoto, T. Kojima and M. Hasegawa, Tannic acid raises survival rate of mice bearing syngeneic tumors, Cancer Biother.Radiopharm., 1999, 14, 231–234 CrossRef CAS PubMed.
- C. J. Bridgeman, T. U. Nguyen and V. Kishore, Anticancer efficacy of tannic acid is dependent on the stiffness of the underlying matrix, J. Biomater. Sci., Polym. Ed., 2018, 29, 412–427 CrossRef CAS.
- A. Celzard, V. Fierro, G. Amaral-Labat, A. Pizzi and J. Torero, Flammability assessment of tannin-based cellular materials, Polym. Degrad. Stab., 2011, 96, 477–482 CrossRef CAS.
- G. Tondi, A. Pizzi and R. Olives, Natural tannin-based rigid foams as insulation for doors and wall panels, Maderas Cienc. Technol., 2008, 10, 219–227 CAS.
- G. Tondi, W. Zhao, A. Pizzi, G. Du, V. Fierro and A. Celzard, Tannin-based rigid foams: A survey of chemical and physical properties, Bioresour. Technol., 2009, 100, 5162–5169 CrossRef CAS.
- Z. Xia, A. Singh, W. Kiratitanavit, R. Mosurkal, J. Kumar and R. Nagarajan, Unraveling the mechanism of thermal and thermo-oxidative degradation of tannic acid, Thermochim. Acta, 2015, 605, 77–85 CrossRef CAS.
- S. Nam, B. D. Condon, Z. Xia, R. Nagarajan, D. J. Hinchliffe and C. Madison, Intumescent flame-retardant cotton produced by tannic acid and sodium hydroxide, J. Anal. Appl. Pyrolysis, 2017, 126, 239–246 CrossRef CAS.
- Z. Xia, W. Kiratitanavit, P. Facendola, S. Thota, S. Yu, J. Kumar, R. Mosurkal and R. Nagarajan, Fire resistant polyphenols based on chemical modification of bio-derived tannic acid, Polym. Degrad. Stab., 2018, 153, 227–243 CrossRef CAS.
- T. P. Nevell and S. H. Zeronian, Cellulose Chemistry and its Applications, Halsted Press, John Wiley, New York, 1985 Search PubMed.
- A. A. Faroq and G. J. Milnes, Thermogravimetric analysis study of the mechanism of pyrolysis of untreated and flame retardant treated cotton fabrics under a continuous flow of nitrogen, Polym. Degrad. Stab., 1994, 44, 323–333 CrossRef CAS.
- M. A. Khattab, The inhibition of spontaneous ignition by flame-retarding cotton fabrics, J. Appl. Polym. Sci., 1990, 41, 3069–3078 CrossRef CAS.
- A. P. S. Sawhney, B. Condon, M. Reynolds, R. Slopek and D. Hui, Advent of greige cotton nonwovens made using a hydro-entanglement process, Text. Res. J., 2010, 80, 1540–1549 CrossRef CAS.
- S. Nam, B. D. Condon, M. B. Foston and S. Chang, Enhanced thermal and combustion resistance of cotton linked to natural inorganic salt components, Cellulose, 2014, 21, 791–802 CrossRef CAS.
- S. Nam, B. D. Condon, Y. Liu and Q. He, Natural resistance of raw cotton fiber to heat evidenced by the suppressed depolymerization of cellulose, Polym. Degrad. Stab., 2017, 138, 133–141 CrossRef CAS.
- A. P. S. Sawhney, M. Reynolds, B. Condon, R. Slopek and C. Allen, A comparative study of nonwoven fabrics made with two distinctly different forms of greige cotton lint, Text. Res. J., 2011, 81, 1484–1492 CrossRef.
- H. L. Friedman, Kinetics of thermal degradation of char-forming plastics from thermogravimetry application to phenolic plastic, J. Polym. Sci., Part C: Polym. Lett., 1964, 6, 183–195 CrossRef.
- D. R. Pompeu, Y. Larondelle, H. Rogez, O. Abbas, J. A. F. Pierna and V. Baeten, Characterization and discrimination of phenolic compounds using Fourier transform Raman spectroscopy and chemometric tools, Biotechnol., Agron., Soc. Environ., 2018, 22, 13–28 Search PubMed.
- Y. Wang, D. C. Alsmeyer and R. L. McCreery, Raman spectroscopy of carbon materials: structural basis of observed spectra, Chem. Mater., 1990, 2, 557–563 CrossRef CAS.
- M. A. Tamor and W. C. Vassell, Raman ‘‘fingerprinting’’ of amorphous carbon films, J. Appl. Phys., 1998, 76, 3823–3830 CrossRef.
- X. Li, J. I. Hayashi and C. Z. Li, FT-Raman spectroscopic study of the evolution of char structure during the pyrolysis of a Victorian brown coal, Fuel, 2006, 85, 1700–1707 CrossRef CAS.
- A. C. Ferrari, Raman spectroscopy of graphene and graphite: Disorder, electron–phonon coupling, doping and nonadiabatic effects, Solid State Commun., 2007, 143, 47–57 CrossRef CAS.
- D. M. Keown, X. Li, J. I. Hayashi and C. Z. Li, Characterization of the structural features of char from the pyrolysis of cane trash using Fourier transform-Raman spectroscopy, Energy Fuels, 2007, 21, 1816–1821 CrossRef CAS.
- M. Asadullah, S. Zhang, Z. Min, P. Yimsiri and C. Z. Li, Effects of biomass char structure on its gasification reactivity, Bioresour. Technol., 2010, 101, 7935–7943 CrossRef CAS PubMed.
- M. E. Brown, M. Maciejewski, S. Vyazovkin, R. Nomen, J. Sempere, A. Burnham, J. Opfermann, R. Strey, H. L. Anderson, A. Kemmler, R. Keuleers, J. Janssens, H. O. Desseyn, C. R. Li, T. B. Tang, B. Roduit, J. Malek and T. Mitsuhashi, Computational aspects of kinetic analysis: Part A: The ICTAC kinetics project-data, methods and results, Thermochim. Acta, 2000, 355, 125–143 CrossRef CAS.
- L. Cabrales and N. Abidi, On the thermal degradation of cellulose in cotton fibers, J. Therm. Anal. Calorim., 2010, 102(2), 485–491 CrossRef CAS.
- N. Slabbert, Complexation of condensed tannins with metal ions, in Plant Polyphenols, ed. R. W. Hemingway and P. E. Laks, Plenum Press, New York, 1992, pp. 421–436 Search PubMed.
- J. R. Schmidt and W. F. Polik, WebMO, version 18.1.001e, WebMO LLC, Holland, MI, USA, 2018, http://www.webmo.net, accessed July, 2018 Search PubMed.
- H. J. C. Berendsen, D. van der Spoel and R. van Drunen, GROMACS: a message-passing parallel molecular dynamics implementation, Comput. Phys. Commun., 1995, 91, 43–56 CrossRef CAS.
- D. van der Spoel, E. Lindahl, B. Hess, G. Groenhof, A. E. Mark and H. J. C. Berendsen, GROMACS: fast, flexible, and free, J. Comput. Chem., 2005, 26, 1701–1718 CrossRef CAS PubMed.
- S. Pronk, S. Páll, R. Schulz, P. Larsson, P. Bjelkmar, R. Apostolov, M. R. Shirts, J. C. Smith, P. M. Kasson, D. van der Spoel, B. Hess and E. Lindahl, GROMACS 4.5: a high-throughput and highly parallel open source molecular simulation toolkit, Bioinformatics, 2013, 29, 845–854 CrossRef CAS PubMed.
- V. Zoete, M. A. Cuendet, A. Grosdidier and O. Michielin, SwissParam: a fast force field generation tool for small organic molecules, J. Comput. Chem., 2011, 32, 2359–2368 CrossRef CAS PubMed.
Footnote |
| † Electronic supplementary information (ESI) available: Effects of immersion time and drying temperature; SEM images of chars; open flame test results; and a vertical flammability test video are available. See DOI: 10.1039/c9ra00763f |
| This journal is © The Royal Society of Chemistry 2019 |

