DOI:
10.1039/C9RA00663J
(Paper)
RSC Adv., 2019,
9, 12319-12324
Dielectric relaxation of the double perovskite oxide Ba2PrRuO6
Received
25th January 2019
, Accepted 15th April 2019
First published on 23rd April 2019
Abstract
Samples of Ba2PrRuO6 were prepared by the solid state reaction method and the structure was characterized by X-ray diffraction (XRD). Scanning electron microscopy (SEM) and dielectric measurements were performed in order to investigate the morphology and electric properties of the ceramics. X-ray diffraction data reveal that the Ba2PrRuO6 samples are of the cubic crystal structure with the space group Fm![[3 with combining macron]](https://www.rsc.org/images/entities/char_0033_0304.gif) m at room temperature. The dielectric properties were studied in the range of 20 Hz to 1 MHz in the temperature range from 10 K to 300 K. Strong dispersion in frequency and a rapid increase in ε′ are observed when T > 150 K. The observed steps of the ε′(T) curves are correlated with the peaks of the tan
m at room temperature. The dielectric properties were studied in the range of 20 Hz to 1 MHz in the temperature range from 10 K to 300 K. Strong dispersion in frequency and a rapid increase in ε′ are observed when T > 150 K. The observed steps of the ε′(T) curves are correlated with the peaks of the tan![[thin space (1/6-em)]](https://www.rsc.org/images/entities/char_2009.gif) δ(T) curves, with the peak temperature shifting to higher values as the frequency increases. Impedance spectroscopy studies indicate the presence of grain and grain boundary relaxations in the sample at high temperatures, while at low temperatures only grain relaxation can be observed. Both grain and grain boundary relaxation times follow the Arrhenius law with activation energies of 0.16 eV and 0.17 eV, respectively.
δ(T) curves, with the peak temperature shifting to higher values as the frequency increases. Impedance spectroscopy studies indicate the presence of grain and grain boundary relaxations in the sample at high temperatures, while at low temperatures only grain relaxation can be observed. Both grain and grain boundary relaxation times follow the Arrhenius law with activation energies of 0.16 eV and 0.17 eV, respectively.
1. Introduction
The double perovskite oxides with the chemical formula A2BB′O6, where A is a large cation such as Ba2+, Sr2+, or Ca2+ and the B and B′ cations are transition metals, have attracted a lot of research activities in recent years because of their intriguing properties and technological applications in electronic devices, sensors, fuel cells, magnetic memory, capacitors and other devices.1–6 Ruthenium-containing double perovskites A2LnRuO6 (A = alkaline earth element; Ln = lanthanide) have been studied extensively due to their interesting structural, transport and magnetic properties.7–16 In A2LnRuO6, the B-site is occupied either by rare earth or transition metal ions and determines the magnetic properties. The Ba2LnRuO6 compounds contain an ordered arrangement of Ln3+/Ru5+ ions and exhibit various antiferromagnetic ordering at low temperatures. For non-magnetic Ln3+ ions such as Y3+, La3+, and Lu3+, antiferromagnetic interaction is due to the ordering of the Ru5+ ions only.7,8,17 The ordering of the Ru5+ is dominated by the relative strength of the nearest neighbor Ru5+ ions through the Ru–O–O–Ru pathway and the next-nearest neighbour Ru5+ ions through the Ru–O–Ln–O–Ru pathway. For magnetic Ln3+ ions (Ln = Pr, Nd, Sm, Eu, Tb, Dy, Ho, Er, Tm and Yb), long range magnetic ordering of the Ln3+ ions is also observed.9,13,18–21
The crystal and magnetic properties of Ba2PrRuO6 have been studied previously.9,22,23 The crystal structure of Ba2PrRuO6 was reported to be cubic (space group Fmm) at room temperature.22,24 Neutron diffraction study revealed the occurrence of antiferromagnetic transition with TN = 117 K, with the magnetic moments of 2.2 and 2.0 μB for Pr3+ ions and Ru5+ ions at low temperature, respectively.9 Although relaxation behavior has been studied previously on other complex double perovskite ceramics.23 To date, there has been no report about the ac electrical properties of Ba2PrRuO6 in the literature. Properties of polycrystalline ceramic materials depend on microstructure where the grain and grain boundary properties may be significantly different from each other. It is often observed that the electrical response from a material is not intrinsic and dominated by many extrinsic factors such as grain boundary, surface layers and electrode-material interface. Therefore, it is important to study the electrical properties in correlation the microstructure through grain and grain boundary analyses. In this paper, we report dielectric and impedance studies on Ba2PrRuO6.
2. Experimental
Polycrystalline Ba2PrRuO6 samples were prepared using the solid state reaction method. Stoichiometric amount of high purity powders of BaCO3 (99.95%) and RuO2 (99.99%) and Pr6O11 (99.99%) were preheated at 120 °C for 8 hours and then mixed thoroughly in an agate mortar with a pestle. The mixed powder was put in the furnace and heated to 900 °C for 12 hours, with a ramping rate 5 °C min−1. The powder was then increased to 1200 °C with an increasing rate of 2 °C min−1, and kept at that temperature for 72 hours. The powder was then cooled down with a cooling rate of 2 °C min−1 to 900 °C and followed by furnace cooled to room temperature.
After the heating procedure, the mixture was added with 5% (weight percentage) polyvinyl alcohol (PVA) as the binder and reground thoroughly, pressed into disks of 1 cm in diameter and 1 mm in thickness. The disks were then sintered with the same procedure as described above. The structure of the samples were checked at room temperature with powder X-ray (XRD) using the Cu-Kα radiation. Morphology and the grain size distribution of the sintered pellets were studied using a scanning electron microscope (SEM) HITCHI S-2400. Temperature-dependent dielectric measurements were performed with the measuring frequency range from 20 Hz to 1 MHz using HP-4284A LCR meter. Silver paste was applied on both sides of the pellet samples. The experimental temperature is between 10 K and 300 K with the sample placed in an OFHC sample holder in a closed-cycle refrigerator (CTI-Cryogenics model 22).
3. Results and discussions
Shown in Fig. 1(a) is the powder XRD data of the polycrystalline Ba2PrRuO6 sample. The XRD pattern can be indexed to the cubic crystal structure with space group Fmm. The refined lattice constants are a = b = c = 0.8482 nm. The obtained values are close to that reported.22,23 Typical SEM micrograph of the Ba2PrRuO6 sample is shown in Fig. 1(b). The micro-graph reveals that the sample studied consists of grains micro-meter size with considerable porosity. The morphology and grain size are similar to that reported previously for Ba2HoRuO6.25
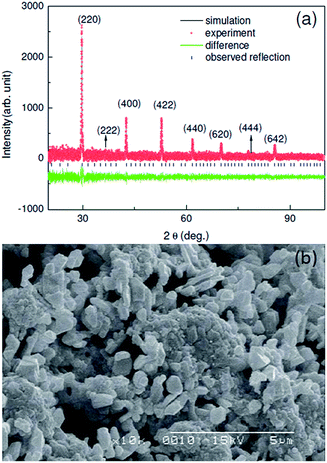 |
| | Fig. 1 (a) The X-ray diffraction patterns of the polycrystalline Ba2PrRuO6 sample. (b) The SEM micrograph of the Ba2PrRuO6 sample. | |
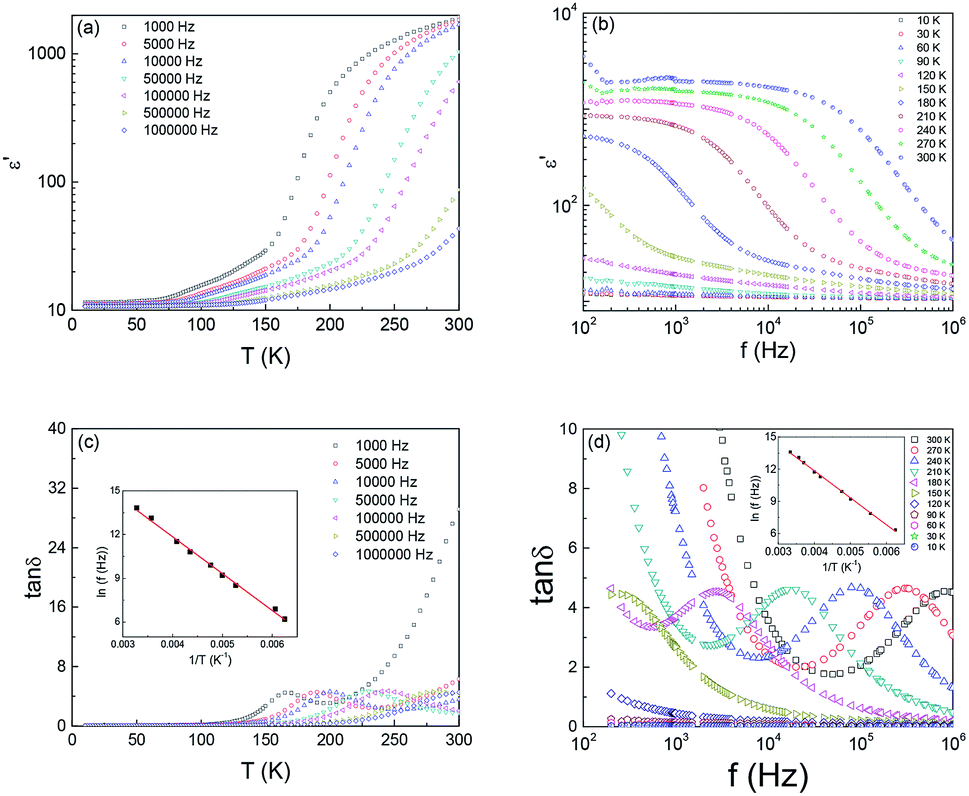
The real part of dielectric permittivity ε′ as a function of temperature T at selected test frequency f for Ba2PrRuO6 between 10 K and 300 K are depicted in Fig. 2(a). The ε′(T) curves exhibit distinct behaviours in different temperature regions. At the lowest temperature, ε′ is almost frequency independent and approaches a value of ∼11 at 10 K. For 10 K < T < 150 K, ε′ increases monotonically with increasing T and frequency dispersion develops. Strong dispersion in frequency and rapid increase in ε′ is observed for T > 150 K. The obtained value of ε′ is ∼2000 at 1 kHz at 300 K, which decreases with increasing f to a value of 50 at 1 MHz. The origin for the observed large value of the dielectric response at room temperature can be attributed to the extrinsic effect such as inhomogeneous microstructures or grain boundary effect.
 |
| | Fig. 2 (a) Real part of dielectric permittivity ε′ as a function of temperature T at selected test frequency f for Ba2PrRuO6. (b) ε′ vs. frequency f of the sample at various temperatures. (c) The loss tangent tanδ vs. T curves with various test frequencies between 10 K and 300 K. (d) Frequency dependence of the dielectric loss (tanδ) at different temperatures between 10 K and 300 K. Insets of (c) and (d): f versus the reciprocal of the peak temperature Tp obtained from the tanδ curves. | |
Fig. 2(b) shows the real part of the dielectric permittivity ε′ vs. frequency f of the sample at various temperatures between 10 K and 300 K. As can be seen in the figure, the ε′(f) curves exhibit two distinct plateaus, separated by an inflection region, for T > 180 K. The inflection region shifts toward low frequency and then gradually disappears below 150 K. The low frequency plateau is attributed to the grain boundary response while the high frequency dispersion is due to the grain response. The rapid increase in ε′ below 200 Hz for T > 200 K is due to the electrode. Depicted in Fig. 2(c) are the loss tangent tanδ versus T curves with various test frequencies f. The tanδ curves exhibit a peak corresponding to the rapid increase of ε′(T). Plotted in Fig. 2(d) are the frequency dependence curves of the dielectric loss (tanδ) at different temperatures between 10 K and 300 K. The peak temperature shifts to higher temperature as the test frequency increases.
The test frequency f versus the reciprocal of the peak temperature obtained from the tanδ curves, Tp, is plotted in the insets of Fig. 2(c) and (d). It is clear that the experimental can be fitted well with the Arrhenius relation
| | |
f = f0exp(−Ea/kBT),
| (1) |
where
f0 is the pre-exponential term,
Ea is the activation energy, and
kB is the Boltzmann constant. The obtained fitting parameters are
Ea = 0.205 eV and
f0 = 1.31 × 10
9 Hz.
Fig. 3(a) shows the frequency dependence of the real part of impedance Z′ for various temperatures between 60 K and 300 K. It shows that the value of Z′ increases dramatically with decreasing T. It is also clear that Z′ decreases with an increase in frequency, which indicates the enhancement of the ac conductivity with increasing frequency. For T > 130 K, a temperature dependent Z′ plateau from the low frequency region, followed by a negative slope at high frequency region is observed. At higher temperatures (T > 180 K), the Z′(f) curves disclose two distinct plateaus develop at higher frequencies. The segments of nearly constant Z′ become dominant as the temperature increases, suggesting the enhanced relaxation behaviour.26,27 Shown in Fig. 3(b) is the variation of the imaginary part of impedance Z′′ of Ba2PrRuO6 sample as a function of frequency for different temperatures. The Z′′(f) curves reveal two sets of peaks, the low frequency peaks are responsible for grain boundary contribution and the high frequency peaks corresponds to the grain response. The peak positions can be expressed as fgb ∼ 1/(2πRgbCgb) and fg ∼ 1/(2πRgCg), respectively.28 With increasing temperature, the maximum shifts towards higher frequency. The Arrhenius law can be applied for both relaxations,
| | |
τgb = τgb0exp(−Egb/kBT), τgb = 1/2πfgb
| (2) |
| | |
τg = τg0exp(−Eg/kBT), τg = 1/2πfg
| (3) |
where
τgb0 and
τg0 are the characteristic times,
Egb and
Eg are the activation energies for the grain boundary and grain, respectively, and
fgb and
fg are the maximum frequencies of the grain boundaries and grains.
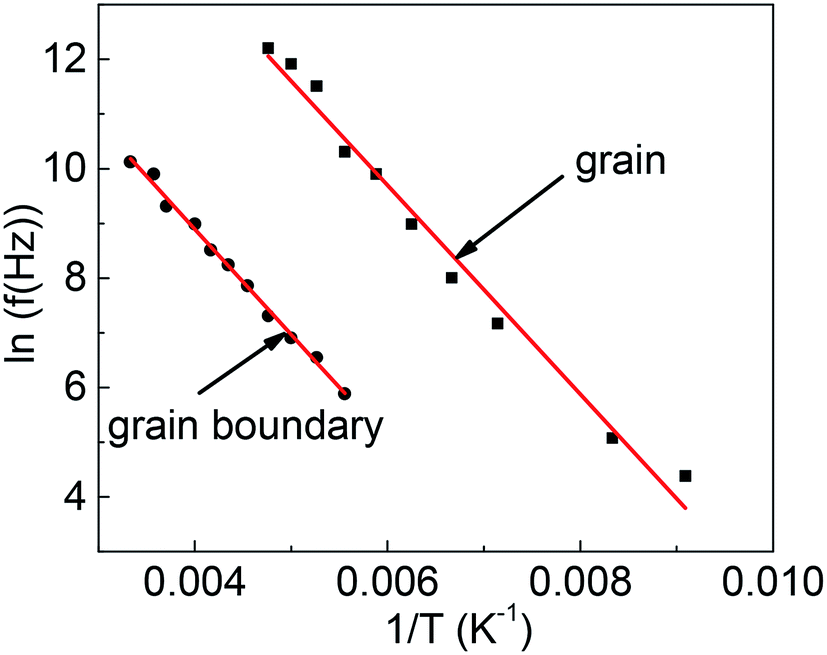
Fig. 4 shows the grain and grain boundary relaxation times
τg and
τgb, respectively, obtained from the maximum frequencies
versus the reciprocal of the temperature. The activation energies determined from the slopes are
Egb ∼ 0.17 eV for grain boundary and
Eg ∼ 0.16 eV for the grain.
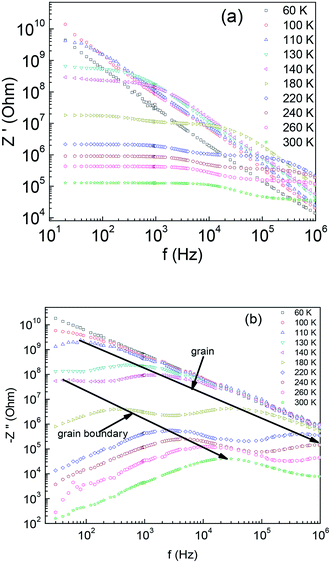 |
| | Fig. 3 The frequency dependence of (a) the real part of the impedance Z′ and (b) the imaginary part of the impedance −Z′′ of Ba2PrRuO6 for various temperatures between 60 K and 300 K. | |
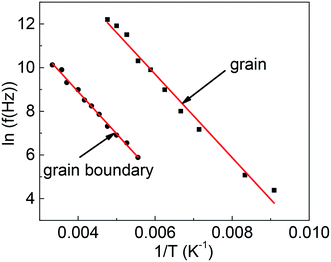 |
| | Fig. 4 The Arrhenius relation of the measuring frequency vs. 1/T for grains and grain boundaries of Ba2PrRuO6. The solid lines are the linear fitting. | |
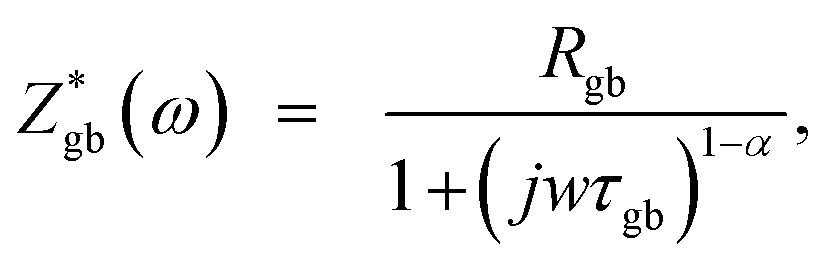
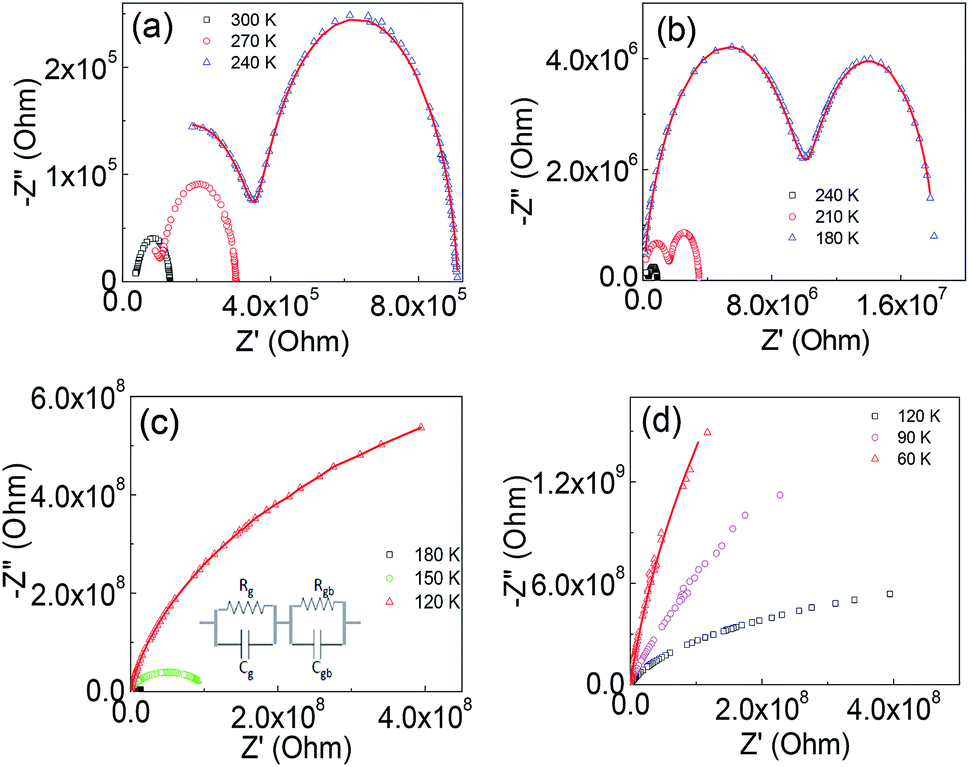
The Nyquist plots for Ba2PrRuO6 samples at various temperatures are shown in Fig. 5(a–d). At 300 K, only one asymmetric semicircle is observed and impedance data can be described by the Cole–Cole equation,29,30
| |
 | (4) |
where
Rgb,
τgb and
ω are the grain boundary resistance, the relaxation time for the sample and the angular frequency, respectively. The Cole–Cole parameter
α is the measure of distribution of the relaxation time.
 |
| | Fig. 5 (a–d) Complex plane impedance plots for Ba2PrRuO6 sample at selected temperatures: (a) 240, 270, 300 K (b) 180, 210, 240 K (c) 120, 150, 180 K (d) 60, 90, 120 K. The solid lines represent the fitting from the equivalent circuits. | |
With decreasing temperature, the diameter of the impedance plot becomes larger and another segment at high frequency starts to develop. In the temperature range of 270–180 K (Fig. 5(a and b)), the Z* plot consists of two semi-circular arcs corresponding to the grain boundary and bulk contributions. The impedance data can be analyzed in terms of two parallel C–R (capacitance–resistance) circuits connected in series to represent grain and grain boundary components and 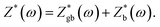 The solid lines in the figures are the fitting results. Below 180 K, only segments of the bulk
  can be observed.
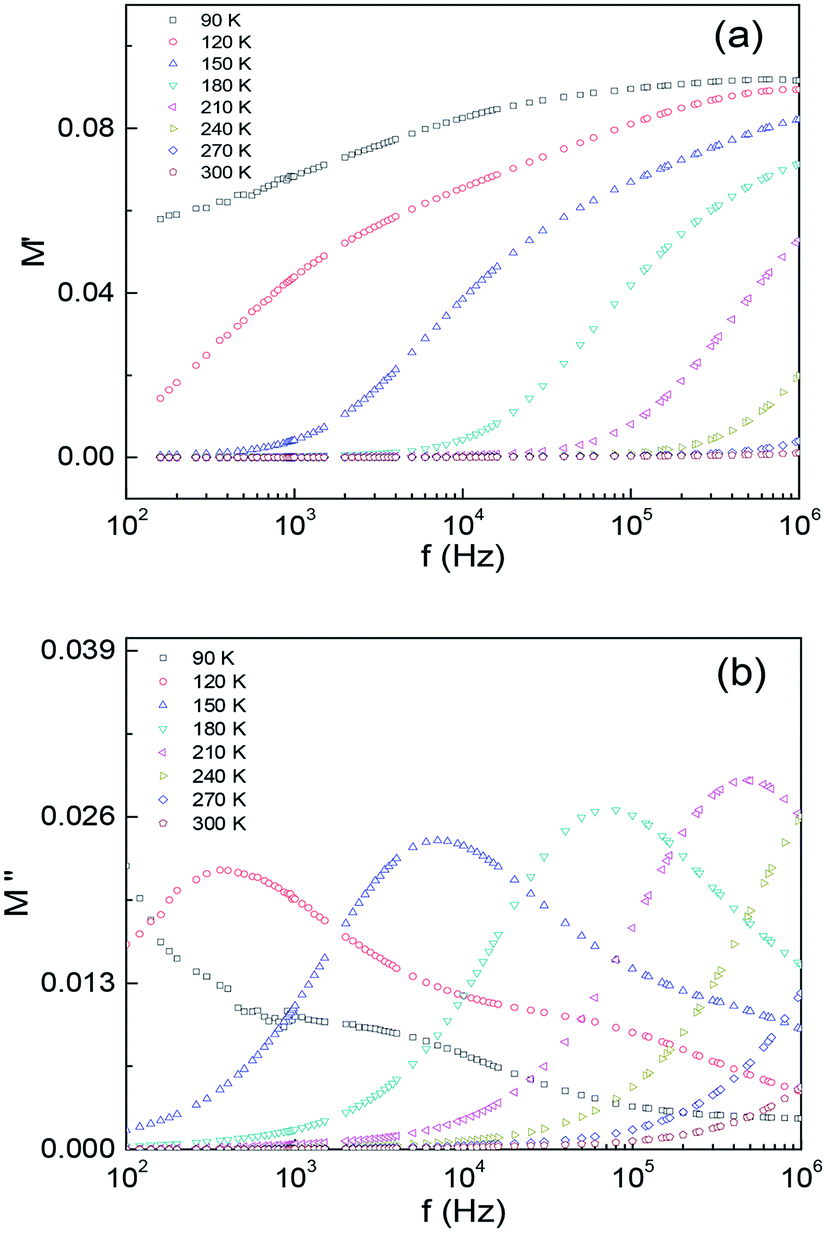
For analysing the intrinsic grain dielectric relaxation, it is advantageous to display the data in terms of the imaginary part of modulus M′′ as a function of test frequency f. This is because the modulus formalism (M* = M′ + jM′′ = 1/ε* = jwCZ*) has the advantage of eliminating the contact contributions and the relaxation with the smallest capacitance (grain) exhibits the largest peak in the M′′ vs. f plots. Depicted in Fig. 6(a) and (b) are M′(f) and M′′(f) curves for different temperatures between 60 K and 300 K. Fig. 6(b) shows M′′(f) curve exhibits a peak at ∼360 Hz for T = 120 K. And the peak position shifts to higher frequency to ∼480 kHz as the temperature increases to 210 K, and finally moves out of the measurable frequency range for T > 210 K. These peaks are related to the grain contribution and it reaches maximum at 1/(2πRGCG). The appearance of shoulders in the M′′ curves are due to the grain contribution. The obtained values are Egb ∼ 0.175 eV for grain boundary and Eg ∼ 0.17 eV for the grain. These values are close to that obtained from the Z′′(f) data.
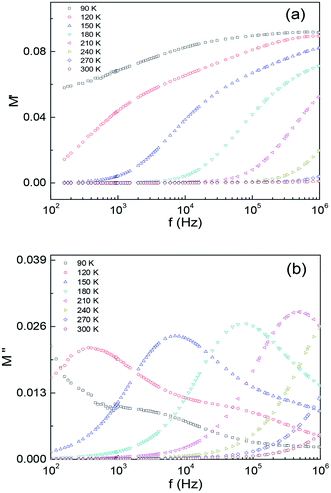 |
| | Fig. 6 The frequency dependence of (a) the real part of the electric modulus M′ and (b) the imaginary part of the electric modulus M′′ of Ba2PrRuO6 for various temperatures between 90 K and 300 K. | |
According to the universal dielectric response model,31 ε′ and the measured conductivity σ(f) at a given frequency in disordered solid can be expressed as
| | |
ε′ = tan(sπ/2)σ0fs−1/ε0
| (5) |
where
σac(
f) =
ε0fε′′ (
ε0 is the permittivity of free space), is the ac conductivity which is expressed as a power law of frequency as
σac(
f) =
A(
T)
fs, where
A(
T) is a constant dependent on temperature,
s is a dimensionless parameter, and
f is the frequency at which the conductivity
σ was measured. The exponential increase with
T in loss tangent tan
δ is associated with the hopping conductivity. Which indicates that the observed relaxations may due to the hopping between the spatially fluctuating potentials. The hopping process can produce dipolar effect as well as the conductivity in the sample. This indicates that a straight line with the slope
s can be obtained if we plot logarithm of
ε′
f against logarithm of
f at a given temperature.
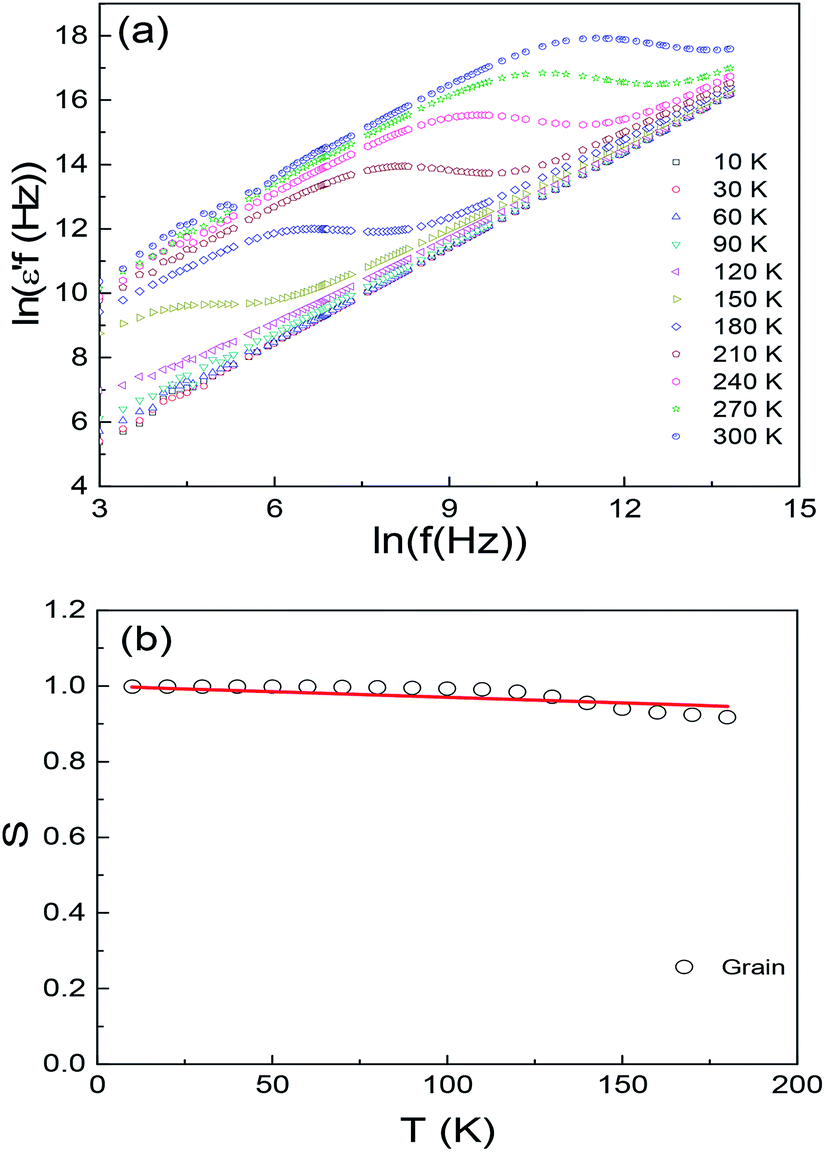
Fig. 7(a) displays the ln(
ε′
f)
vs. ln(
f) plots of Ba
2PrRuO
6 sample for a number of selected temperatures. This figure shows that two sets of straight lines can be observed in different temperature regions. At high temperatures, a straight line is observed below ∼100 kHz at 300 K, and the segment of the straight line decreases to lower frequency with decreasing temperature
T and finally moves below the measurement frequency. Meanwhile another set of straight lines starts to develop from the high frequency part for
T ≤ 180 K and the segment of the lines extends to the lower frequency with decreasing
T. Below ∼60 K, a straight line in the whole test frequency region is observable. The above results suggest that the dielectric behavior at the high temperature (low frequency part) is associated with the hopping of the carriers between the grain boundaries. With decreasing temperature the localized carriers are becoming frozen and the number of hopping carriers across the grain boundary reduces dramatically. The low temperature (high frequency) dielectric behavior comes from the hopping of the carriers in the bulk. The results are in consistent with that of the impedance data. The temperature dependence of the exponent
s for the grain is plot in
Fig. 7(b). The value of
s is close to 1 at 10 K and decreases monotonically with increasing
T to a value of 0.92 for
T = 180 K. Such temperature dependence of
s can be described with the correlated barrier hopping (CBH) model.
32
 |
| | Fig. 7 (a) Variation ln(ε′f) vs. ln(f) of Ba2PrRuO6 sample for selected temperatures below 300 K, (b) temperature dependence of the frequency exponent s. The solid line is calculated from the CBH model. | |
4. Conclusions
In summary, ceramic samples of Ba2PrRuO6 have been prepared by the solid state reaction method. The dielectric properties were characterized by the impedance spectroscopy. This compound exhibits a high dielectric permittivity (ε′ ∼ 2000) near room temperature below 1 kHz. Impedance spectroscopy data can be modelled on equivalent circuit consisting of parallel RC elements of grain and grain boundary. The obtained values of the activation energies are Egb ∼ 0.17 eV for grain boundary and Eb ∼ 0.16 eV for the grain.
Conflicts of interest
There are no conflicts to declare.
Acknowledgements
This work was supported by the ROC Ministry of Science and Technology under grant no. MOST 105-2112-M-002-020.
Notes and references
- S. N. Putilin, E. V. Antipov, O. Chmaissem and M. Marezio, Nature, 1993, 362, 226 CrossRef CAS.
- S. Jin, T. H. Tiefel, M. McCormack, R. A. Fastnacht, R. Ramesh and L. H. Chen, Science, 1994, 264, 413 CrossRef CAS PubMed.
- M. K. Rath and K. T. Lee, J. Alloys Compd., 2018, 737, 152–159 CrossRef CAS.
- S. W. Cheong and M. Mostovoy, Nat. Mater., 2007, 6, 13 CrossRef CAS.
- Y. H. Huang, R. I. Dass, Z. L. Xing and J. B. Goodenough, Science, 2006, 312, 254 CrossRef CAS.
- L. Troncoso, M. J. Martínez-Lope, J. A. Alonso and M. T. Fernández-Díaz, J. Appl. Phys., 2013, 113, 023511 CrossRef.
- P. D. Battle, J. B. Goodenough and R. Price, J. Solid State Chem., 1983, 46, 234 CrossRef CAS.
- P. D. Battle and C. W. Jones, J. Solid State Chem., 1989, 78, 108 CrossRef CAS.
- Y. Izumiyama, Y. Doi, M. Wakeshima, Y. Hinatsu, Y. Shimojo and Y. Morii, J. Phys.: Condens. Matter, 2001, 13, 1303 CrossRef CAS.
- Y. Doi, Y. Hinatsu, A. Nakamura, Y. Ishii and Y. Morii, J. Mater. Chem., 2003, 13, 1758 RSC.
- Y. Hinatsu, Y. Izumiyama, Y. Doi, A. Alemi, M. Wakeshima, A. Nakamura and Y. Morii, J. Solid State Chem., 2004, 177, 38 CrossRef CAS.
- H. Z. Han, H. E. Mohottala, J. I. Budnick, W. A. Hines, P. W. Klamut, B. Dabrowski and M. Maxwell, J. Phys.: Condens. Matter, 2006, 18, 2273 CrossRef.
- R. Kumar, C. V. Tomy, R. Nagarajan, P. L. Paulose and S. K. Malik, Phys. B, 2009, 404, 2369 CrossRef CAS.
- R. Takahashi, R. Okazaki, Y. Yasui, I. Terasaki, T. Sudayama, H. Nakao, Y. Yamasaki, J. Okamoto, Y. Murakami and Y. Kitajima, J. Appl. Phys., 2012, 112, 073714 CrossRef.
- A. A. Aczel, D. E. Bugaris, L. Li, J.-Q. Yan, C. de la Cruz, H.-C. zur Loye and S. E. Nagler, Phys. Rev. B, 2013, 87, 014435 CrossRef.
- B. Ranjbar, A. Pavan, B. J. Kennedy and Z. Zhang, Dalton Trans., 2015, 44, 10689 RSC.
- P. D. Battle and W. J. Macklin, J. Solid State Chem., 1984, 52, 138 CrossRef CAS.
- Y. Izumiyama, Y. Doi, M. Wakeshima, Y. Hinatsu, K. Oikawa, Y. Shimojo and Y. Morii, J. Mater. Chem., 2000, 10, 2364 RSC.
- T. C. Gibb and R. Greatrex, J. Solid State Chem., 1980, 34, 279 CrossRef CAS.
- Y. Doi, Y. Hinatsu, A. Nakamura, Y. Ishii and Y. Morii, J. Mater. Chem., 2003, 13, 1758 RSC.
- Y. Izumiyama, Y. Doi, M. Wakeshima, Y. Hinatsu, A. Nakamura and Y. Ishii, J. Solid State Chem., 2002, 169, 125 CrossRef CAS.
- P. C. Donohue and E. L. McCann, Mater. Res. Bull., 1977, 12, 519 CrossRef CAS.
- M. C. Castro Jr, C. d. A. Paschoal, F. C. Snyder and M. W. Lufaso, J. Appl. Phys., 2008, 104, 104114 CrossRef.
- W. T. Fu and D. J. W. IJdo, Solid State Commun., 2005, 136, 456 CrossRef CAS.
- S. Halder, A. Dutta and T. P. Sinha, RSC Adv., 2017, 7, 43812 RSC.
- A. Srivastava, A. Barg and F. D. Morrison, J. Appl. Phys., 2009, 105, 054103 CrossRef.
- W. Chen, W. Zhu, O. K. Tan and X. F. Chen, J. Appl. Phys., 2010, 108, 034101 CrossRef.
- D. C. Sinclair and A. R. West, J. Appl. Phys., 1989, 66, 3850 CrossRef CAS.
- K. S. Cole and R. H. Cole, J. Chem. Phys., 1941, 9, 342 Search PubMed.
- J. R. Macdonald, Impedance Spectroscopy, Wiley, New York, 1987 Search PubMed.
- A. K. Jonscher, Dielectric Relaxation in Solids, Chelsen, London, 1983 Search PubMed.
- A. Ghost, Phys. Rev. B: Condens. Matter Mater. Phys., 1990, 41, 1479 CrossRef.
|
| This journal is © The Royal Society of Chemistry 2019 |
Click here to see how this site uses Cookies. View our privacy policy here. 
 Open Access Article
 This Open Access Article is licensed under a Creative Commons Attribution-Non Commercial 3.0 Unported Licence
 *,
Kuan Ru Chiou,
An-Chih Hsueh and
Ching-Ray Chang
*,
Kuan Ru Chiou,
An-Chih Hsueh and
Ching-Ray Chang

 The solid lines in the figures are the fitting results. Below 180 K, only segments of the bulk
  can be observed.