 Open Access Article
Polydopamine functionalized hydrogel beads as magnetically separable antibacterial materials†
Ishita Matai *ab,
Mayank Garg
 ab,
Kajal Ranaa and
Suman Singh
 ab
ab
aCentral Scientific Instruments Organization (CSIR-CSIO), Chandigarh-160030, India. E-mail: ishitamatai@csio.res.in; ishitamatai11@gmail.com; Tel: +91-172-2672281
bAcademy of Scientific and Innovative Research, CSIR-CSIO, Chandigarh-160030, India
First published on 1st May 2019
Abstract
In the present study, magnetically separable hydrogel beads of ionically cross-linked alginate were functionalized with polydopamine (PDA). The rationale behind this was to enhance the structural stability and antibacterial profile of PDA/Alg/Fe3O4 beads (K3). Incorporation of superparamagnetic magnetite (Fe3O4) nanoparticles endowed the hydrogel beads with magnetism. X-ray diffraction (XRD) analysis revealed the successful formation of pure Alg/Fe3O4 nanoparticles having an inverse spinel structure. Vibrating sample magnetometry (VSM) confirmed their superparamagnetic behaviour with Ms values of 36.18 and 30.46 emu g−1 at 5 and 300 K, respectively. High resolution-transmission electron microscopy (HR-TEM) images showed alginate capping and the size of the Alg/Fe3O4 nanoparticles (∼8 nm). The successful deposition of PDA granules on the K3 bead surface was verified by field emission-scanning electron microscopy (FE-SEM). The PDA functionalization was further justified by VSM, XRD and Fourier-transform infrared spectroscopy (FT-IR). During swelling experiments, K3 beads displayed appreciable structural stability compared to bare/non-functionalized beads. Wettability studies revealed K3 beads to be hydrophilic with a contact angle of ∼55°. Rheological parameters including storage modulus (G′) and shear viscosity of K3 increased upon PDA functionalization. During antibacterial tests, K3 strongly inhibited E. coli, S. typhi, S. aureus and L. monocytogenes in a concentration and time dependent manner. Fluorescence staining experiments showed that K3 could greatly alter the bacterial membrane integrity. Reusability experiments with K3 beads substantiated their effective broad-spectrum antibacterial performance for three consecutive cycles.
1. Introduction
Access to clean, fresh water is a great challenge afflicting the world in particular the developing countries. Problems with water are continuously on the rise, with water scarcity intensifying due to climate changes and water pollution.1 At present, an estimated 3.6 billion people (nearly half of the global population) live in potentially water-scarce regions and this is expected to reach 4.8–5.7 billion by 2050.2 Deterioration of water quality has further aggravated the problem. Amongst the various water contaminants, pathogenic microorganisms which either exist as biofilms on water carrying pipelines or in planktonic (free) form are the main causative agents of water-borne infections.3–8 Currently, the water treatment processes for removal of microorganisms rely on addition of chlorine, bromine, ozone or UV treatment.9 Research indicates that pathogens have acquired resistance to disinfection by chlorination.10,11 In addition, the disinfectant by-products are detrimental to health and ozone or UV treatments are expensive.Development of cost-effective and eco-friendly materials which can interact and inhibit such pathogenic microbes without affecting the water quality are certainly valuable. Combination of the knowledge of chemistry, nanotechnology and biology can innovate strategies to formulate effective materials to obtain clean water. Iron oxide nanoparticles, owing to their biocompatibility, cost-effective synthesis, ease of surface engineering and magnetism have proven suitable for biomedical and water purification applications.12,13 Superparamagnetic iron oxide nanoparticles (SPIONs), including magnetite (Fe3O4) and maghemite (γ-Fe2O3) are well-recognized for their excellent ability as nanoadsorbents either in free form or as composites for organic pollutants and heavy metals for water purification.13–15 Polymeric hydrogels encapsulating such magnetic iron oxide nanoparticles either bare or surface modified can serve as a versatile platform to remove microbes and ions in waters.16 After action, these hydrogels can be separated with an external magnet giving way to a fast and effective approach.
Amongst various sources for hydrogel preparation, naturally occurring sodium alginate is widely known. Basically, alginate is a linear polysaccharide used extensively in food, cosmetics, pharmaceutical and biomedical industries owing to its biocompatibility and gel-forming tendencies in presence of divalent cations.17–19 It is composed of consecutive units of (1–4) linked α-L-guluronate (G) and β-D-mannuronate (M) residues followed by alternating segments of M–G blocks.17,20 Divalent cations such as calcium, barium and strontium can ionically complex to G blocks of two alginate polymers, forming the popular “egg-box structure”.21,22 Use of Ca2+ to prepare alginate hydrogels and microbeads for cell or protein encapsulation and drug delivery has been reported.22–27 Thaya et al. demonstrated antibacterial activity of Ca2+ cross-linked alginate/chitosan microspheres.28 El-Aassar and Mo tested antibacterial activity of alginate microbeads containing silver nanoparticles (AgNPs).29 Zahran et al. modified surface of cotton fabric with AgNPs-alginate composite and evaluated their antibacterial activity.30 Madzovska-Malagurski et al. synthesized bioactive Cu-alginate hydrogels and showed their bactericidal activity against Escherichia coli and Staphylococcus aureus.31 Nevertheless, the long-term toxic effects induced by leached metal ions (silver and copper) questions their utility for water treatment.
Recently, dopamine (3,4-dihydroxyphenethylamine, DA) a small molecule analog of catechol and amine rich proteins of marine mussels is being much investigated.32 Under mild alkaline pH and in presence of oxygen, DA self-polymerizes to form polydopamine (PDA) layers on virtually any surface. Versatile adhesion capability, catalytic, antimicrobial and antifouling properties of PDA renders it as a suitable functionalization material.33–38 Also, like other natural adhesive proteins PDA exhibits good biocompatibility and low-toxicity to the environment.39 Hence, use of PDA as a functionalization material can serve as a facile and eco-friendly strategy to provide stability and antibacterial competence.
In the present work, PDA functionalized magnetic hydrogel beads have been prepared using a step-wise strategy. Alginate was used as base hydrogel material to form beads by ionic cross-linking with divalent Ca. To make beads magnetic, alginate stabilized Fe3O4 nanoparticles were entrapped inside the alginate porous network. Thereafter, immersion of Alg/Fe3O4 beads in mild alkaline solution of DA resulted in surface functionalization with PDA. Herein, PDA exhibits dual functionality, (i) provides structural stability to alginate/Fe3O4 beads by forming a uniform adherent coating and (ii) imparts antibacterial potential. As a proof of concept, as-synthesized PDA/Alg/Fe3O4 beads (K3) were evaluated for their stability under different pH conditions. Further, they were then assessed for their antibacterial efficacy against common water pathogens: Gram negative Escherichia coli (E. coli) and Salmonella typhimurium (S. typhi) and Gram positive Staphylococcus aureus (S. aureus) and Listeria monocytogenes (L. monocytogenes), respectively as model organisms. The K3 beads exhibited enhanced antibacterial activity against all the four bacterial strains compared to bare alginate (K1) and unmodified Alg/Fe3O4 beads (K2). Hence, K3 beads formulated with inherently biocompatible materials with antibacterial and magnetism properties are potential candidates for use in bacterial removal.
2. Experimental section
2.1 Chemicals, bacterial strains and growth media
All the chemicals were of reagent grade and used without purification. Sodium alginate (Alg), aqueous ammonia (25% NH4OH) and dopamine hydrochloride were purchased from Sigma-Aldrich (India). Iron(II) chloride tetrahydrate (FeCl2·4H2O), Iron(III) chloride hexahydrate (FeCl3·6H2O) and calcium chloride, anhydrous were procured from Alfa Aesar and HiMedia (India), respectively. Gram negative E. coli (MTCC 1302) and S. typhi (MTCC 98) and Gram positive S. aureus (MTCC 96) and L. monocytogenes (MTCC 657) were obtained from CSIR-Institute of Microbial Technology (IMTECH), India. Bacterial growth medium-nutrient broth (NB) medium, was purchased from HiMedia (India). All the preparations were made in deionized (DI) water.2.2 Synthesis of Alg coated iron oxide nanoparticles (Alg/Fe3O4)
Coated magnetite nanoparticles (Fe3O4) were synthesized by co-precipitation method using Fe3+/Fe2+ in molar ratio of 2![[thin space (1/6-em)]](https://www.rsc.org/images/entities/char_2009.gif) :
:![[thin space (1/6-em)]](https://www.rsc.org/images/entities/char_2009.gif) 1 with slight modification.40 Iron(II) chloride (1.5 g) and iron(III) chloride (3 g) were dissolved in 50 mL DI water @ 450 rpm at 80 °C for 1 h under nitrogen (N2) atmosphere. For coating, 0.8 wt% sodium alginate was added to the iron solution at 80 °C and kept for 2 h. Then, 10 mL of 25 wt% NH4OH solution was added into the above solution very slowly. Upon addition, the color of solution changed immediately from orange to black. The obtained black precipitates were extracted using strong neodymium magnet (NdFeB) and filtered using Whatman™ filter paper (125 mm). The precipitates were then washed twice with DI water (to remove chloride ions) and absolute ethanol (to remove excess Alg). Alg/Fe3O4 nanoparticles were finally obtained after vacuum drying at 80 °C for 24 h and stored at room temperature.
1 with slight modification.40 Iron(II) chloride (1.5 g) and iron(III) chloride (3 g) were dissolved in 50 mL DI water @ 450 rpm at 80 °C for 1 h under nitrogen (N2) atmosphere. For coating, 0.8 wt% sodium alginate was added to the iron solution at 80 °C and kept for 2 h. Then, 10 mL of 25 wt% NH4OH solution was added into the above solution very slowly. Upon addition, the color of solution changed immediately from orange to black. The obtained black precipitates were extracted using strong neodymium magnet (NdFeB) and filtered using Whatman™ filter paper (125 mm). The precipitates were then washed twice with DI water (to remove chloride ions) and absolute ethanol (to remove excess Alg). Alg/Fe3O4 nanoparticles were finally obtained after vacuum drying at 80 °C for 24 h and stored at room temperature.
2.3 Preparation of Alg hydrogel (Alg) beads (K1)
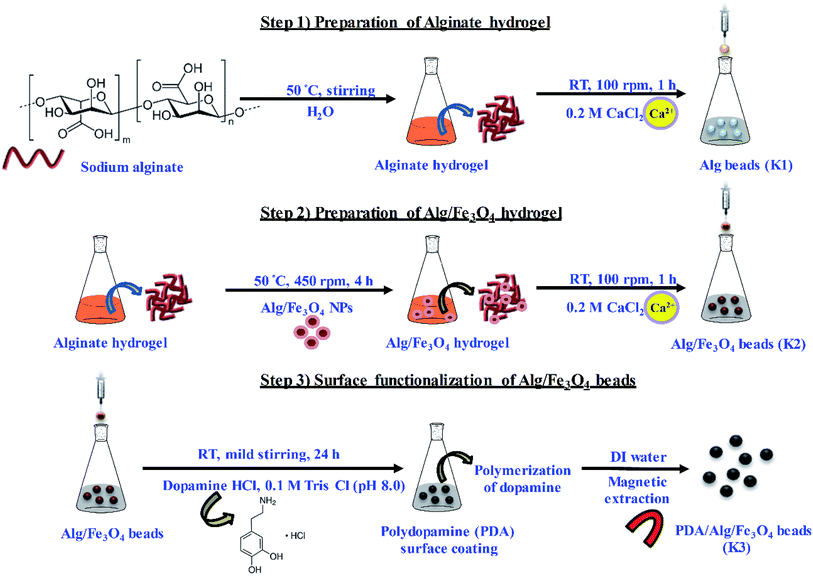
1 g of sodium alginate powder was dissolved in 50 mL DI water under stirring conditions at 50 °C to obtain transparent, viscous Alg hydrogel solution. To formulate Alg hydrogel as spherical beads, this solution was added drop-wise using 1 mL pipette into 50 mL of 0.2 M CaCl2 solution @ 100 rpm to instantaneously form beads. The beads were left for 1 h in the CaCl2 solution to ensure complete cross-linking. Formation of beads was due to electrostatic interactions between guluronate blocks of alginate chain and Ca2+ ions.27 The beads were then filtered, collected and washed twice with DI water.2.4 Preparation of Alg/iron oxide hydrogel (Alg/Fe3O4) beads (K2)
Alg/Fe3O4 nanoparticles prepared in 2.2 were entrapped in the porous structure of Alg beads. For this, 250 mg Alg/Fe3O4 nanoparticles were added to 50 mL Alg hydrogel solution (prepared in 2.3) @ 450 rpm at 50 °C for 4 h. Thereafter, this solution was added drop-wise into 50 mL of 0.2 M CaCl2 for 1 h. Uniform spherical beads of Alg/Fe3O4 were collected using external NdFeB magnet and washed twice with DI water.2.5 Preparation of PDA functionalized magnetic hydrogel (PDA/Alg/Fe3O4) beads (K3)
First, 10 mg mL−1 of dopamine hydrochloride was dissolved in 30 mL of 0.1 M Tris Cl buffer (pH 8.0) under mild stirring at room temperature. For surface functionalization, 1 g of K2 beads were dropped in above solution and stirred @ 200 rpm for 24 h at room temperature in dark. Change in color of beads from dark brown to black was observed after functionalization of PDA on Alg/Fe3O4 bead surface. Functionalized beads were then filtered, collected and washed with DI water. Subsequently, the beads were stored at −20 °C after freeze-drying.2.6 Characterization
X-Ray Diffraction (XRD) patterns were acquired using a Model D8 Advance (M/s Bruker AXS, Germany) X-ray diffractometer with monochromatic Cu-Kα radiation (λ = 1.5406 Å) in the range of 20°–80° (2θ) and a scan speed of 0.5° min−1. Fourier-Transform Infrared (FT-IR) spectra were recorded with PerkinElmer spectrometer in the range 4000–400 cm−1. The magnetic measurements (Magnetization versus field (M–H)) at 5 and 300 K were carried out using a 3 tesla cryogen free mini Vibrating Sample Magnetometer (VSM) with a pulse cryocooler (Cryogenics Ltd, UK). The zeta potential and hydrodynamic diameter of samples were estimated using Malvern Zetasizer (ZS90). For sample preparation, 0.5 mg mL−1 samples were dispersed in DI water by sonication for 5 min. The morphology of Alg/Fe3O4 nanoparticles was recorded by FE-SEM (Nova NanoSEM) at an accelerating voltage of 15 kV. Alg/Fe3O4 nanoparticle powders were placed on double-sided carbon tape on Al stub and viewed under FE-SEM after gold sputtering. The elemental composition was observed from energy dispersive X-ray spectroscopy (EDS) coupled with FE-SEM. For viewing the morphology and internal structure of functionalized magnetic beads, the freeze-dried beads were cross-sectioned using a sharp blade and placed on carbon tape and imaged. High resolution-transmission electron microscopy (HR-TEM) was used for studying the size and crystal structure of Alg/Fe3O4 nanoparticles. For imaging, sample preparation included dispersion of 0.5 mg mL−1 Alg/Fe3O4 nanoparticles in DI water followed by sonication for 10 min. The solution was then dropped on non-shining side of carbon coated Cu grid, air dried and viewed under FEI Technai G2 TEM, operating at 200 kV. The lattice fringes, selected area electron diffraction (SAED) pattern and EDS spectra were also recorded using same instrument. Gatan Digital Micrograph software was used to obtain inverse fast Fourier transform (IFFT) images. For wettability studies, around 4 μL of DI water was dropped onto freeze-dried beads surface and contact angles were measured using Drop Shape Analyzer DSA-100E (Kruss, Germany). Sessile drop method was employed for measurements.2.7 Swelling studies
For swelling studies, 5 mg of freeze-dried beads were immersed separately in 5 mL of sodium acetate buffer (pH 5.5) and PBS (pH 7.4) buffers, respectively at room temperature for different time intervals (3, 6, 9, 1, 24 h).20 After incubation, the swollen beads were carefully removed and placed on a piece of tissue paper to remove excess water from surface of beads. Weight of beads was then measured using a weighing balance. Percent swelling was then calculated with the following formula:where, S1 is the initial weight of dried beads and S2 is the weight of beads after swelling.
2.8 Rheological measurements
The rheological properties of hydrogel beads were measured using a rotational rheometer (Bohlin rheometer CVO 100, Malvern Instruments Ltd.). A 20 mm parallel plate was used for experiments. A height gap of 500 μm between the plates was optimized depending on hydrogel bead thickness. 2–3 dried beads were dipped in 10 mL DI water for ∼1 h and carefully placed on plate. Two experiments were performed at 25 °C to explore their rheological behavior, (a) frequency sweep test from 0.1–10 Hz at a constant stain of 0.1% and (b) shear viscometry test with shear rate varying from 0.1–100 s−1.2.9 Antibacterial activity of K3 beads
The antibacterial capability of functionalized magnetic beads was evaluated against four bacterial strains namely E. coli, S. typhi, S. aureus, and L. monocytogenes using different assays. For bacterial inoculation, 1% (v/v) bacteria was cultured overnight in NB growth medium at 180 rpm at 37 °C in a bacterial incubator.![[thin space (1/6-em)]](https://www.rsc.org/images/entities/char_2009.gif) 000 rpm for 5 min at 4 °C. The supernatant was carefully discarded and the obtained pellet was washed twice with PBS (24.32 mM). The cell pellet was then resuspended again in 1 mL PBS containing fluorescent propidium iodide (PI) dye (final concentration 2 μg mL−1). The samples were left for incubation in dark for 10 min at room temperature.42 Thereafter, the fluorescence spectra were acquired using multi-mode plate reader (Molecular Devices-SpectraMax i3x, USA) at excitation wavelength 535 nm and emission wavelength 625 nm.
000 rpm for 5 min at 4 °C. The supernatant was carefully discarded and the obtained pellet was washed twice with PBS (24.32 mM). The cell pellet was then resuspended again in 1 mL PBS containing fluorescent propidium iodide (PI) dye (final concentration 2 μg mL−1). The samples were left for incubation in dark for 10 min at room temperature.42 Thereafter, the fluorescence spectra were acquired using multi-mode plate reader (Molecular Devices-SpectraMax i3x, USA) at excitation wavelength 535 nm and emission wavelength 625 nm.where, Ac is the absorption value of control bacteria at 600 nm, At is the absorption value of K3 treated bacteria at 600 nm.
3. Results and discussion
In this study, PDA functionalised magnetic matrices in the form of beads have been prepared and assessed for their antibacterial activity. The entire methodology adopted for the preparation of PDA/Alg/Fe3O4 beads (K3) has been schematically depicted in Scheme 1.3.1 Characterization
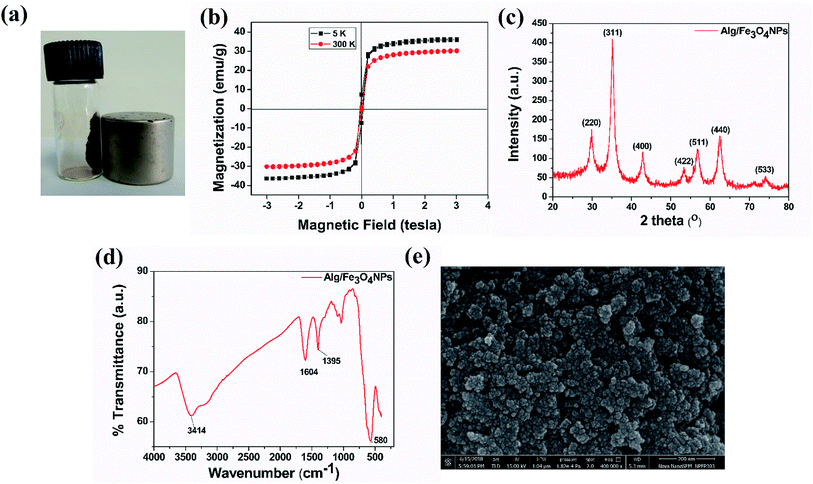
Alg/Fe3O4 nanoparticles were characterized for their magnetic behavior, nanometer size, crystalline structure and purity. Visual demonstration of magnetic characteristics was done using an external, strong NdFeB magnet. Fig. 1(a) clearly indicates strong affinity of the synthesized Alg/Fe3O4 nanoparticles towards magnet. When the magnet was brought in the vicinity of the nanoparticles, they exhibited strong attraction. It is imperative for iron oxide nanoparticles to have strong magnetic attraction so that when they are entrapped inside the hydrogel beads, the beads also exhibit magnetic features to ensure their magnetic separation.Next, the magnetic properties of the synthesized Alg/Fe3O4 nanoparticles were experimentally measured by VSM. Fig. 1(b) shows the hysteresis loops as a function of the magnetic field at 5 and 300 K. At 300 K, the nanoparticles exhibited typical superparamagnetic behavior with no hysteresis. The saturation magnetization (Ms) was 30.46 emu g−1 which is significantly less than that of bulk magnetization (Ms = 92 emu g−1). This is due to the size effect and is in accordance with the previous reported literature.44,45 Also, the remnant magnetization (Mr) and coercivity (Hc) values were close to zero. While at 5 K, Alg/Fe3O4 nanoparticles were superparamagnetic with Ms value 36.18 emu g−1. The magnetic parameters calculated from the data are mentioned in Table 1.
| Material | Temperature (K) | Saturation magnetization (Ms) (emu g−1) | Coercivity (Hs) (tesla) | Permanent magnetization (Mr) (emu g−1) |
|---|---|---|---|---|
| Alg/Fe3O4 | 5 | 36.18 | 0.0425 | 7.275 |
| NPs | 300 | 30.46 | 0.0058 | 0.2902 |
Subsequently, the XRD spectrum was recorded and is shown in Fig. 1(c). The characteristic peaks of iron oxide NPs crystal having an inverse spinel structure appeared in the 2θ range (30°–40°). From XRD study, the nanoparticles with higher Miller indices were observed at (311) plane. The diffraction peaks of (220), (311), (400), (422), (511), and (440) planes reflect the magnetite crystal with face-centered cubic phase (JCPDS Card No. 19-0629).40,46 Absence of diffraction peaks of (210), (213) and (330) planes confirm absence of maghemite in sample. Employing Scherrer's equation, the average crystallite size was calculated from the broad diffraction peak corresponding to (311) plane to be around 8 nm. The plausible explanation of small size of Alg/Fe3O4 nanoparticles is the use of alginate as coating and stabilizing agent.47 XRD data also confirms that coating did not affect the phase of iron oxide.45
The formation of Alg/Fe3O4 nanoparticles was further studied by the FT-IR analysis. As shown in Fig. 1(d), several peaks were observed indicating the presence of different functional groups in Alg/Fe3O4 nanoparticles. The peaks at 3414 and 3200 cm−1 correspond to the O–H bond vibrations. Further, the sharp peaks at 1395 and 1604 cm−1 are of the asymmetric and symmetric stretching vibrations of –COO− groups. Other peaks at 1023 and 1064 cm−1 can be credited to the structural peaks of alginate.20 The band at 580 cm−1 is due to stretching vibration of Fe–O bond in the tetrahedral and octahedral sites.40,47 This ascertained the successful formation of Alg/Fe3O4 nanoparticles.
The finely powdered Alg/Fe3O4 nanoparticles were thereafter subjected to FE-SEM analysis for their morphology and shape features. Fig. 1(e) shows presence of uniform sized, spherical Alg/Fe3O4 nanoparticles with a tendency to agglomerate. For more clearer observation, TEM analysis was performed. Fig. 2(a and b) shows the TEM images of Alg/Fe3O4 nanoparticles at different magnifications. The alginate coating on the synthesized Fe3O4 nanoparticles was evident from the images obtained (red arrows). The dark colored spots in the images correspond to the Fe3O4 nanoparticles with average particle size 8 nm (blue arrows). Presence of Fe, O, C elements in Alg/Fe3O4 nanoparticle sample is clearly observed in the EDS spectra (Fig. S1†). The peaks pertaining to Cu element of the used TEM grid were also observed. The structure of Alg/Fe3O4 nanoparticles was further investigated by HR-TEM. The lattice fringes of the image were separated and identified using Gatan software to create IFFT images by masking technique (Fig. 2(c) inset). An individual set of planes with lattice spacing (d) of 0.255 nm and 0.298 nm, were observed which correspond to (220) and (311) characteristic planes of Alg/Fe3O4 nanoparticles. These results were in accordance with the XRD findings. Also, the SAED pattern displayed spotted diffraction rings confirming crystalline nature of nanoparticles (Fig. 2(d)).
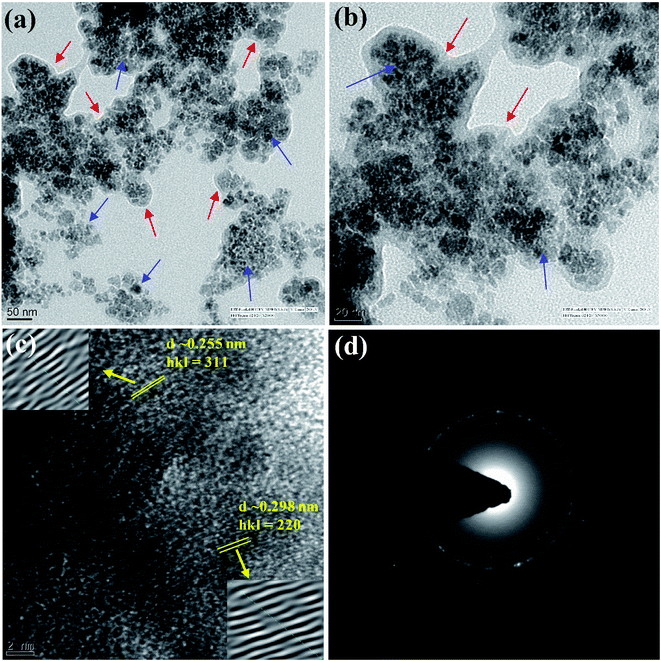 | ||
| Fig. 2 (a and b) HR-TEM images, (c) lattice fringes and (d) SAED pattern of Alg/Fe3O4 nanoparticles. (Red arrows indicate alginate capping; blue arrows correspond to Fe3O4 nanoparticles). | ||
The hydrodynamic size of as-synthesized Alg/Fe3O4 nanoparticles was then recorded by DLS measurements and came out to be 141.9 nm (data not shown). The increased size in aqueous solution can probably be due to aggregation of Alg/Fe3O4 nanoparticles (as observed under TEM) and swelling of the alginate chains covering the nanoparticle surface.48 Ma et al. reported hydrodynamic diameter of SPIONs stabilized with alginate to be ∼193.8 nm.49 Bedê et al. reported hydrodynamic diameter of Fe3O4 encapsulated in alginate/chitosan matrix to be 155.8 nm.50 Hence, our size was less than the previously reported. For TEM analysis, air-dried samples are used; hence actual dried size is obtained. This accounts for the difference in sizes measured by TEM and DLS. Further, to ensure the stability of nanoparticle dispersion, surface charges were recorded from the zeta potential findings. Theoretically, zeta potential is the potential distinction between the stationary layer of fluid attached to the isolated particle and dispersion medium. The zeta potential of Alg/Fe3O4 NPs was found to be around −39.8 mV. This higher value of zeta potential indicated good stability of the synthesized nanoparticle dispersion. The stabilization was not only due to electrostatic repulsion but due to several hydroxyl and carboxylic functional groups of alginate covering the Fe3O4 nanoparticle surface.51
After the successful formation and characterization of Alg/Fe3O4 nanoparticles, they were entrapped inside the Alg hydrogel beads and thereafter surface functionalised with PDA. Fig. 3(a–c) shows the digital photographs of freshly prepared K1, K2, and K3 beads. As evident, the beads were spherical in shape. The prepared K1 beads were transparent in appearance, upon Alg/Fe3O4 nanoparticle inclusion the beads turned brown in colour (K2) and ultimately deep black after PDA surface functionalisation. These beads were then freeze-dried slowly to be used for experiments (Fig. 3(d)). They were then evaluated for their attraction towards external magnet. Fig. 3(e and f) shows the strong magnetic pull of K2 and K3 beads towards wall under magnetic exposure, while magnetism was obviously absent in K1 beads. This simple visual demonstration ensured that the magnetic features of Alg/Fe3O4 nanoparticles retained even after entrapment in the polymeric matrices.
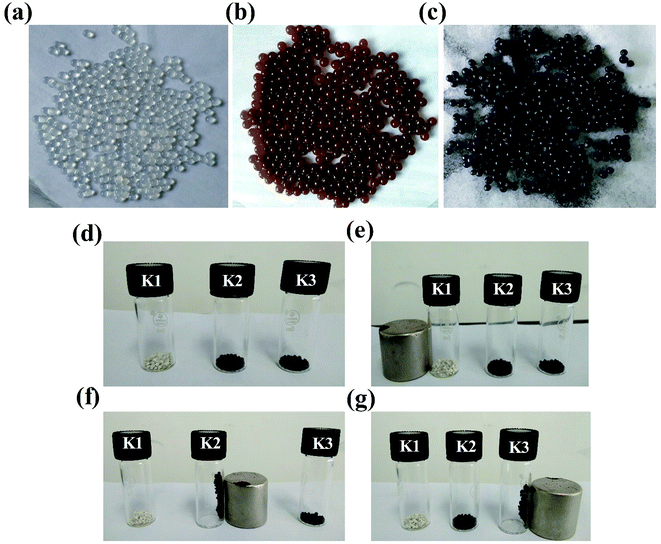 | ||
| Fig. 3 Digital photographs of freshly prepared (a) K1, (b) K2, and (c) K3 beads. (d–g) Freeze-dried beads under influence of a strong magnet. | ||
The magnetic properties of K2 and K3 beads were then experimentally tested with VSM. Fig. S2† shows the magnetization curves of K2 and K3 beads with varying magnetic field at 5 and 300 K. As expected, the beads displayed superparamagnetic behaviour with nearly zero Mr and Hc as seen for Alg/Fe3O4 nanoparticles. However, the Ms values decreased to 3.391 and 3.158 emu g−1, for K2 beads at 5 and 300 K, respectively. This can be ascribed to the presence of thick non-magnetic polymeric shell of alginate covering the magnetic nanoparticle surface.52,53 For K3 beads, the Ms values however were found to slightly increase to 4.315 and 3.602 emu g−1 at 5 and 300 K, respectively. This can be ascribed to the surface functionalization of magnetic beads with PDA that may potentially alter the magnetization of Fe3O4 nanoparticles. Although with comparatively low Ms, still K2 and K3 beads demonstrated satisfactory ability to get attracted to an external magnet which can facilitate their removal after their antibacterial action.23,25 The Hc and Mr values of K2 and K3 beads at 5 and 300 K are shown in Table 2.
| Material | Temperature (K) | Saturation magnetization (Ms) (emu g−1) | Coercivity (Hs) (tesla) | Permanent magnetization (Mr) (emu g−1) |
|---|---|---|---|---|
| K2 beads | 5 | 3.391 | 0.02377 | 0.46839 |
| 300 | 3.158 | 0.00435 | 0.03588 | |
| K3 beads | 5 | 4.315 | 0.02761 | 0.80530 |
| 300 | 3.602 | 0.00370 | 0.06078 |
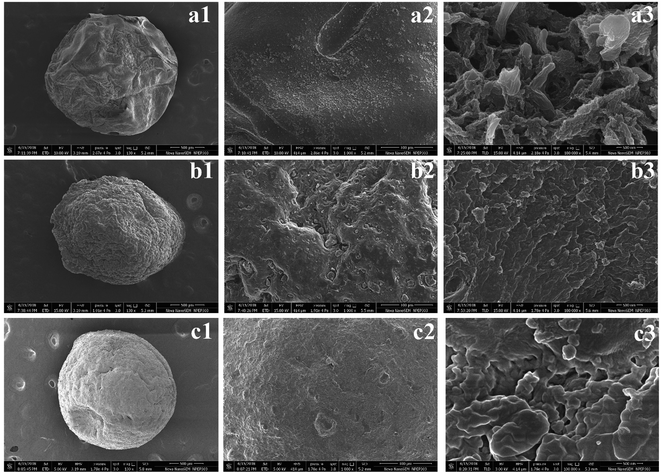
The morphology and composition of the freeze-dried beads was viewed under FE-SEM. Fig. 4(a1 and b1) shows that the intact dried K1 and K2 beads displayed a near-spherical morphology with several wrinkles on surface probably caused by partial collapse of alginate network during dehydration process.24 On the contrary, K3 beads were also spherical but demonstrated relatively uniform surface (Fig. 4(c1). At higher magnifications, K1 beads showed typical morphology of mesoporous materials with several crests and troughs (Fig. 4(a2 and a3).54 The panoramic FE-SEM view of K2 beads showed that after addition of Alg/Fe3O4 nanoparticles in the network, significant changes in the porosity and surface morphology were discerned (Fig. 4(b2 and b3). The surface appeared much smoother than native alginate beads. Subsequently, surface of K3 beads after PDA coating exhibited morphology considerably different, and was covered with granules (Fig. 4(c2 and c3). Our obtained FE-SEM findings of PDA coatings were similar to rough PDA (rPDA) coated glass substrates synthesized by Su et al.38 For a clear view of the internal structure, the freeze-dried beads were cross-sectioned using a sharp blade and then viewed. Fig. 5(a1, b1 and c1) shows the top-view of the cut K1, K2 and K3 beads, respectively. At higher magnifications, all the three beads presented a porous hydrogel structure (Fig. 5(a2, a3, b2, b3 c2 and c3)). The presence of Alg/Fe3O4 nanoparticles entrapped inside the alginate network is evident in the cut K2 and K3 beads and is indicated by yellow arrows. Their presence was further validated by the EDS spectra displaying peaks corresponding to Fe, O elements (Fig. 5(b4 and c4)) which were absent in K1 bead EDS (Fig. 5(a4).
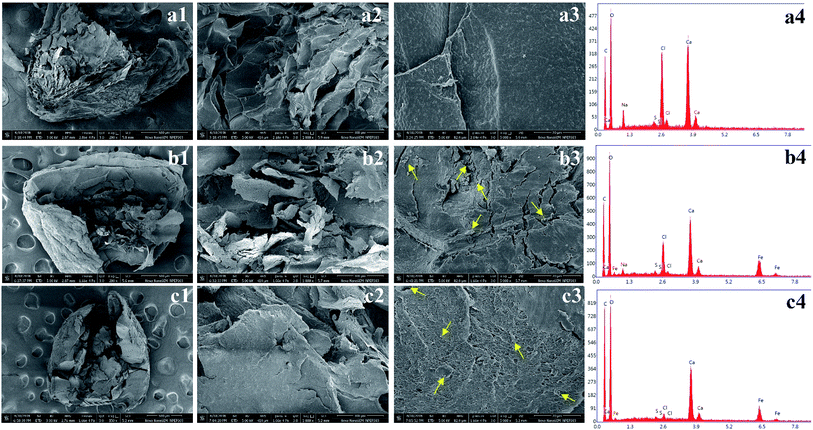 | ||
| Fig. 5 FE-SEM images of cross-sectioned freeze-dried K1, K2, and K3 beads and their EDS analysis. (Yellow arrows indicate existence of Alg/Fe3O4 nanoparticles). | ||
The formation of beads and their structural characteristics was further understood by XRD analysis. Fig. S3a† shows the XRD patterns of K1, K2 and K3 beads. Broad hump peak at 2θ ∼30° was observed for K1, corresponding to the amorphous sodium alginate cross-linked with divalent Ca. Upon Alg/Fe3O4 nanoparticle inclusion, peak reflections corresponding to (220), (311), (511) and (440) planes were seen. After PDA functionalization, the amorphous hump was observed but the peaks corresponding to Alg/Fe3O4 nanoparticles were not much visible. This could be assigned to inherent amorphous crystallinity of PDA.46,55 The prepared K1, K2 and K3 bead samples were then subjected to FT-IR measurements. In the spectrum of K1 (Fig. S3b†), peaks at 1635 and 1419 cm−1, are ascribed to asymmetric and symmetric COO− stretching vibrations, respectively. Intense peak at 3429 cm−1 corresponds to –OH stretch. Peaks around 2920 cm−1 are for C–H stretching. Peak at 1030 cm−1 correspond to C–O–C stretching vibration of alginate and peak at 817 cm−1 is of C–O bending vibrations.20 In the K2 spectrum, all these peaks were present but the peak at 3429 cm−1 got broadened and the intensity of peak got slightly reduced. Peaks related to Fe3O4, were not very visible in the K2 spectrum probably due to their low weight content w.r.t alginate. In the K3 spectrum, certain differences were observed. After amine functionalization, the significant reduction in peaks at 1635, 1419 and 1030 cm−1 indicated the successful reduction and surface functionalization of K2 beads.
For use as antibacterial modalities, the magnetic hydrogel beads should be stable under different pH conditions for their magnetic separation.56 With this perspective K1, K2 and K3 beads were placed in acidic (pH 5.5) and basic (pH 7.4) buffer solutions and their swelling behavior was plotted as a function of time. As expected, all the three types of hydrogel beads underwent swelling with increase in time at both pH 5.5 and 7.4 (Fig. 6(a and b)). At 5.5, the maximal swelling was observed after 12 h for K1, K2 and K3 beads. However, K1 beads were unstable and completely dissociated into pieces after 12 h. K2 beads also displayed some dissociation upon magnetic separation which decreased their weight and hence less swelling was observed at 24 h. On the contrary, PDA functionalization imparted K3 beads with excellent stability with no visual signs of distortion. Similar were the observations at pH 7.4, whereby increase in swelling (%) of beads was seen up to 12 h after which the swelling was constant. After 12 h, K1 beads completely dissociated and partial degradation was seen for K2 beads. This degradation can be assigned to Ca2+ ion exchange with the buffer ions.20,57 While K3 beads were stable and remained intact.
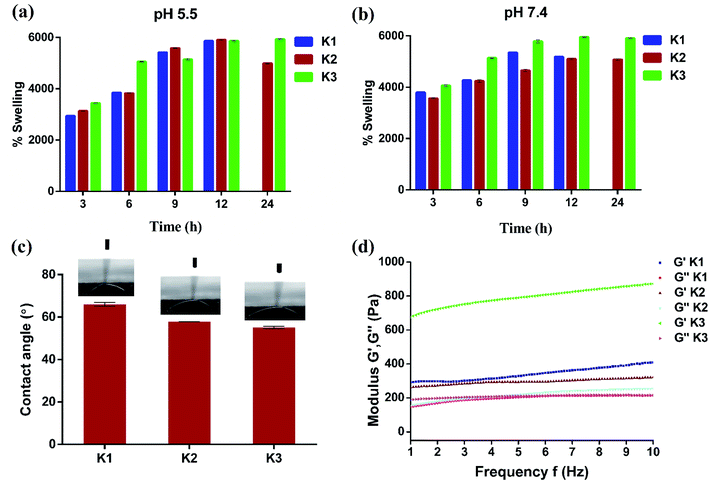 | ||
| Fig. 6 (a and b) Time dependent swelling studies with variation in pH, (c) water contact angle measurements, and (d) rheological properties of beads. | ||
The effect of PDA coating on the wettability properties of Alg/Fe3O4 bead surface was also studied. The results of water contact angle measurements of K1, K2 and K3 beads are shown in Fig. 6(c). For K1 beads, the contact angle was observed to be ∼65.9°. Upon incorporation of Alg/Fe3O4 nanoparticles, the contact angle decreased to ∼57.8°; making K2 beads more hydrophilic in nature. The plausible factor for increase in hydrophilicity of K2 beads could be the presence of more hydrophilic alginate content (covering Fe3O4 nanoparticle surface) than K1 58. After PDA coating, the contact angle further reduced to ∼55° in case of K3 beads, indicating more hydrophilic surfaces. These findings are in consistence with previous studies where PDA is known to make surfaces more hydrophilic.38,59,60
Elasticity and viscosity are significant properties related to hydrogel materials. Any change in the structure will reflect a change in these properties.61 Thus, the rheological properties of hydrogel beads were studied to understand any changes. Fig. 6(d) shows variation in dynamic storage moduli (G′) and loss moduli (G′′) of K1, K2 and K3 beads with frequency at a constant strain of 0.1% and fixed gap of 500 μm. G′ indicates elastic behavior while G′′ symbolize viscous behavior. For all three (K1, K2 and K3), G′ > G′′ typical of viscoelastic solids was observed.62,63 Moreover, G′ was in the order K3 > K1 > K2 and increased with increase in frequency. While entrapment of Fe3O4 nanoparticles in K2 was found to mildly affect the internal cross-links of alginate chains resulting in slight G′ reduction than K1. The large G′ values of K3 obtained suggest positive influence of PDA functionalization on elasticity of beads. Next, viscometry tests were also performed. Fig. S4† shows the change in viscosity with shear rate in the log scale for K1, K2 and K3 beads. A trend of decrease in viscosity with increase in shear rate was observed in all the cases due to pseudo-plastic or shear-thinning behavior.64,65 At low shear rates, the viscosity was in the order K3 > K2 > K1, owing to PDA surface functionalization and Fe3O4 nanoparticles which increased the molecular weight and hence viscosity.
3.2 Antibacterial assessment
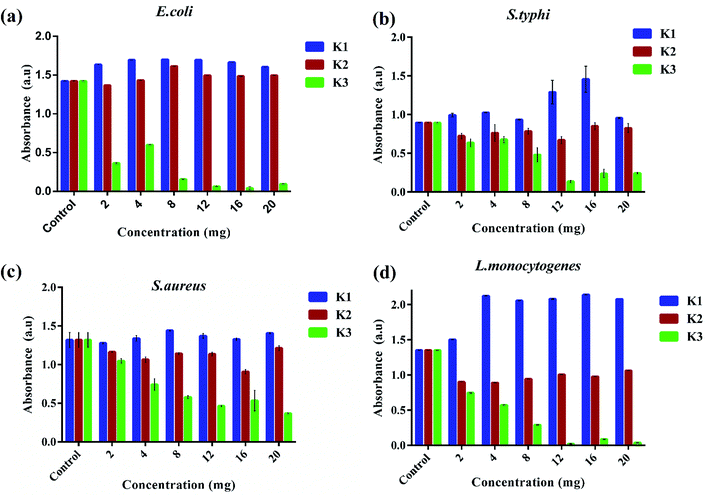
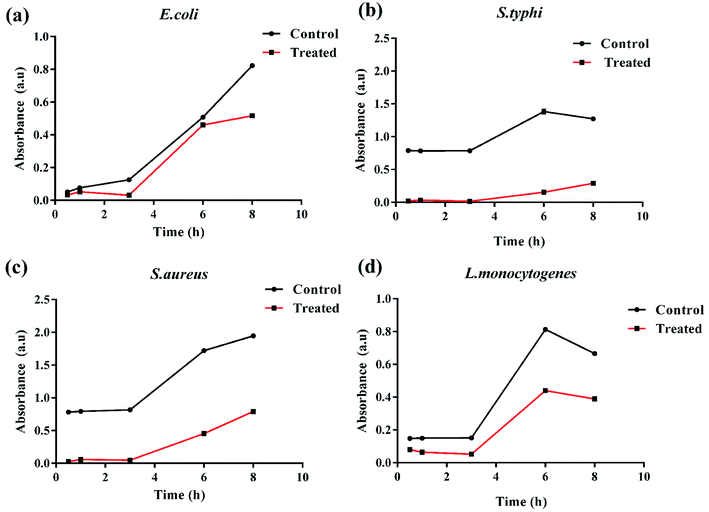
The antibacterial performance of K3 beads was assessed against E. coli, S. typhi, S. aureus, and L. monocytogenes as bacterium models. The growth behavior of bacteria in presence of different concentrations of beads was monitored to correlate the observed bacterial density with their antibacterial efficacy. Fig. 7 shows the bacterial optical density values obtained at 600 nm (OD600) after 12 h incubation with different concentrations of K1, K2 and K3 beads. As seen in Fig. 7(a), a tremendous decrease in E. coli growth was observed with increase in K3 concentration. As less as 2 mg of K3 beads was sufficient to decrease bacterial number to more than 50% compared to untreated bacteria (control). At 12 mg, the bacterial growth was minimal and almost remained unchanged upon treatment with 16 and 20 mg beads. On the contrary, K1 beads were found to surprisingly promote E. coli growth with increase in concentration. While treatment with K2 beads did not affect the E. coli growth even at higher concentrations. This findings indicated that the bactericidal effect of K3 beads may chiefly be due to the existence of PDA granules on their surface. These deposited PDA granules tend to upsurge surface irregularities which favor attachment and buildup of free-swimming bacteria and promote bacterial killing.38,66,67 When tested on S. typhi, a significant decrease in growth was seen for K3 beads and a marginal decrease with K2 beads with rise in concentration compared to control (Fig. 7(b)). However, K1 beads could not inhibit S. typhi growth and proliferation at all concentrations. Similarly, as evident in Fig. 7(c and d) K3 beads were found to suppress S. aureus and L. monocytogenes growth effectively at concentrations 4 mg and higher when compared to K1 and K2 beads.Based on these observations, the bacterial growth kinetic experiments were also performed. Fig. 8(a–d) shows the time dependent bacterial killing by K3 beads. As observed for all the four bacterial strains, with increase in time from 0–8 h, the number of viable bacteria were reduced upon K3 exposure as compared to the untreated or control bacteria. After 8 h, considerable suppression in growth was seen in S. typhi and S. aureus, and reduction in E. coli and L. monocytogenes bacterial number after K3 treatment. However, the basis for difference in bacterial response is still unclear and under investigation.
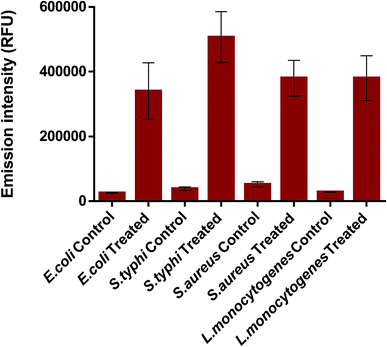
Following, to investigate in more depth the antibacterial performance of K3 beads, membrane integrity assay was performed. For this, the K3 exposed bacteria were subjected to PI staining and the emission fluorescence of PI dye was recorded. PI can penetrate inside membrane compromised bacteria and not inside intact/healthy bacteria.68,69 Fig. 9 shows the variation in fluorescence intensity of PI for treated and control bacteria. As expected, all the treated bacteria demonstrated significantly high uptake of PI stain than the control ones. The little fluorescence seen in case of control or untreated bacteria could be due to autofluorescence or slight membrane damage during sample preparation. Around 3.6 times increase in PI intensity was observed for K3 treated E. coli (Fig. S5†). While, ∼2.0, 8.1 and 2.1 times increase was observed for treated S. typhi, S. aureus and L. monocytogenes bacteria, respectively. The observed results clearly indicate that loss of membrane integrity occurs upon exposure to K3 beads, which eventually results in bacterial death.
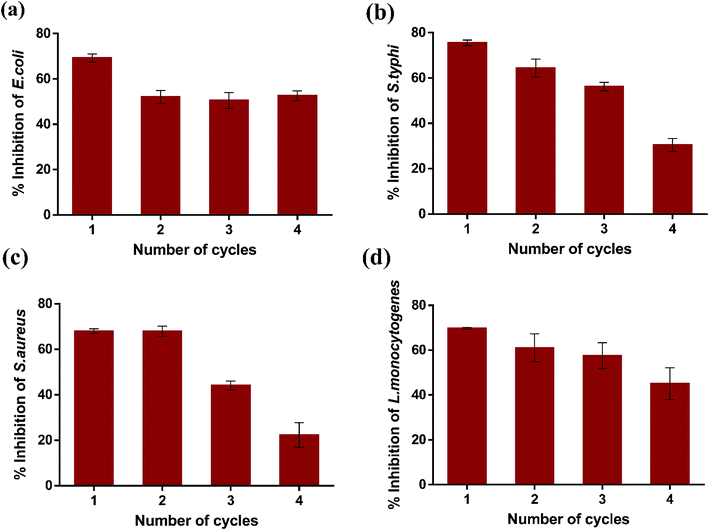
Subsequently, the reusability of magnetic K3 beads to inhibit the bacterial growth was studied for four consecutive cycles. Fig. 10(a–d) shows the percent inhibition in E. coli, S. typhi, S. aureus, and L. monocytogenes upon K3 exposure for 12 h. The obtained results revealed that K3 beads were able to suppress all bacteria effectively for 3 cycles (>50% inhibition). After 4th cycle, the beads could inhibit the bacterial growth, but the percent inhibition was reduced compared to cycle 1. This could plausibly be due to partial degradation of K3 beads under repeated shaking conditions and PBS washings. Nevertheless, the beads could be used for around 3 repeated cycles of antibacterial experiments. In totality, all findings highlight the superior ability of K3 beads to resist bacterial growth than K1 and K2 beads and can serve as promising reusable antibacterial materials.
4. Conclusions
In the present work, we have prepared magnetically active PDA/Alg/Fe3O4 porous matrices in bead form (K3) adopting a step-wise strategy to assess their antibacterial competence. Alg/Fe3O4 nanoparticles, ∼8 nm in size were synthesized by chemical co-precipitation and entrapped inside Alg hydrogel to impart magnetic abilities. The PDA granules were homogenously deposited on the K3 surface as observed under FE-SEM. Even after PDA functionalization, K3 beads demonstrated superparamagnetic property and fast magnetic response. Swelling and water-wettability studies revealed that PDA enhanced their stability in different pH and hydrophilicity to a great extent. Rheological studies suggested enhanced elastic behavior and viscosity of K3. A series of conducted experiments validated strong antibacterial performance of K3 beads against E. coli, S. typhi, S. aureus, and L. monocytogenes bacterial strains at low concentrations. We believe that these functionalized hydrogel beads could be used efficaciously as magnetically-controlled reusable antibacterial agents.Conflicts of interest
There are no conflicts to declare.Acknowledgements
Ishita Matai would like to thank Department of Science and Technology [DST/INSPIRE/04/2016/002181], India for providing the financial support. Authors also thank ICON Analytical Ltd. For helping with FE-SEM experiments. Sincere acknowledgement to CSIR-CSIO, Chandigarh for providing the necessary laboratory and analytical facilities.References
- WHO and UNICEF, Progress on Drinking Water, Sanitation and Hygiene Update and SDG Baselines, 2017 Search PubMed.
- S. F. O. R. Water, Nature-Based Solutions for Water Wwdr 2018 Solutions for Water, 2018 Search PubMed.
- J. P. S. Cabral, Int. J. Environ. Res. Public Health, 2010, 7, 3657–3703 CrossRef PubMed.
- P. K. Pandey, P. H. Kass, M. L. Soupir, S. Biswas and V. P. Singh, AMB Express, 2014, 4, 1–16 CrossRef CAS PubMed.
- A. Mahapatra, N. Padhi, D. Mahapatra, M. Bhatt, D. Sahoo, S. Jena, D. Dash and N. Chayani, J. Clin. Diagn. Res., 2015, 9, DC09–DC11 Search PubMed.
- A. Rożej, A. Cydzik-Kwiatkowska, B. Kowalska and D. Kowalski, World J. Microbiol. Biotechnol., 2015, 31, 37–47 CrossRef PubMed.
- F. Ramírez-Castillo, A. Loera-Muro, M. Jacques, P. Garneau, F. Avelar-González, J. Harel and A. Guerrero-Barrera, Pathogens, 2015, 4, 307–334 CrossRef PubMed.
- X. Zhao, F. Zhao, J. Wang and N. Zhong, RSC Adv., 2017, 7, 36670–36683 RSC.
- D. Berry, C. Xi and L. Raskin, Curr. Opin. Biotechnol., 2006, 17, 297–302 CrossRef CAS PubMed.
- G. E. Murray, R. S. Robin, B. Junkins and D. J. Kushner, Appl. Environ. Microbiol., 1984, 48, 73–77 CAS.
- H. Farkas-Himsley, Appl. Environ. Microbiol., 1964, 12, 1–6 CAS.
- A. K. Gupta and M. Gupta, Biomaterials, 2005, 26, 3995–4021 CrossRef CAS PubMed.
- A. M. Gutierrez, T. D. Dziubla and J. Z. Hilt, Rev. Environ. Health, 2018, 32, 111–117 Search PubMed.
- N. N. Nassar, Appl. Adsorbents Water Pollut. Control, 2012, pp. 81–118 Search PubMed.
- P. N. Dave and L. V. Chopda, J. Nanotechnol., 2014, 2014, 398569 Search PubMed.
- R. Lakshmanan, C. Okoli, M. Boutonnet, S. Järås and G. K. Rajarao, Bioresour. Technol., 2013, 129, 612–615 CrossRef CAS PubMed.
- K. Y. Lee and D. J. Mooney, Prog. Polym. Sci., 2012, 37, 106–126 CrossRef CAS PubMed.
- M. Rinaudo, Tip, 2014, 17, 92–96 CrossRef.
- S. Reakasame and A. R. Boccaccini, Biomacromolecules, 2018, 19, 3–21 CrossRef CAS PubMed.
- I. Matai and P. Gopinath, ACS Biomater. Sci. Eng., 2016, 2, 213–223 CrossRef CAS.
- Ý. A. Mørch, I. Donati, B. L. Strand and G. Skjåk-Bræk, Biomacromolecules, 2006, 7, 1471–1480 CrossRef PubMed.
- K. L. Chen, S. E. Mylon and M. Elimelech, Langmuir, 2007, 23, 5920–5928 CrossRef CAS PubMed.
- F. Q. Wang, P. Li, J. P. Zhang, A. Q. Wang and Q. Wei, Pharm. Dev. Technol., 2011, 16, 228–236 CrossRef CAS PubMed.
- X. Meng, P. Li, Q. Wei and H. X. Zhang, Pharm. Dev. Technol., 2011, 16, 22–28 CrossRef CAS PubMed.
- L. L. Zhang, P. Li, Y. M. Li and A. Q. Wang, Drug Dev. Ind. Pharm., 2012, 38, 872–882 CrossRef CAS PubMed.
- X. Wang, Z. Jiang, J. Shi, C. Zhang, W. Zhang and H. Wu, Ind. Eng. Chem. Res., 2013, 52, 14828–14836 CrossRef CAS.
- S. Kondaveeti, D. R. Cornejo and D. F. S. Petri, Colloids Surf., B, 2016, 138, 94–101 CrossRef CAS PubMed.
- R. Thaya, B. Vaseeharan, J. Sivakamavalli, A. Iswarya, M. Govindarajan, N. S. Alharbi, S. Kadaikunnan, M. N. Al-anbr, J. M. Khaled and G. Benelli, Microb. Pathog., 2018, 114, 17–24 CrossRef CAS PubMed.
- M. R. El-Aassar and X. Mo, Adv. Polym. Technol., 2016, 35, 298–306 CrossRef CAS.
- M. K. Zahran, H. B. Ahmed and M. H. El-Rafie, Carbohydr. Polym., 2014, 108, 145–152 CrossRef CAS PubMed.
- I. Madzovska-Malagurski, M. Vukasinovic-Sekulic, D. Kostic and S. Levic, Biomed. Mater., 2016, 11, 35015 CrossRef CAS PubMed.
- T. S. Sileika, H. Do Kim, P. Maniak and P. B. Messersmith, ACS Appl. Mater. Interfaces, 2011, 3, 4602–4610 CrossRef CAS PubMed.
- H. Lee, B. P. Lee and P. B. Messersmith, Nature, 2007, 448, 338–341 CrossRef CAS PubMed.
- S. H. Ku, J. S. Lee and C. B. Park, Langmuir, 2010, 26, 15104–15108 CrossRef CAS PubMed.
- Y. Xie, B. Yan, H. Xu, J. Chen, Q. Liu, Y. Deng and H. Zeng, ACS Appl. Mater. Interfaces, 2014, 6, 8845–8852 CrossRef CAS PubMed.
- X. Chen, Y. Huang, G. Yang, J. Li, T. Wang, O. H. Schulz and L. K. Jennings, Curr. Pharm. Des., 2015, 21, 4262–4275 CrossRef CAS PubMed.
- S. Liu, J. Fu, M. Wang, Y. Yan, Q. Xin, L. Cai and Q. Xu, J. Colloid Interface Sci., 2016, 469, 69–77 CrossRef CAS PubMed.
- L. Su, Y. Yu, Y. Zhao, F. Liang and X. Zhang, Sci. Rep., 2016, 6, 1–8 CrossRef PubMed.
- R. Mrówczyński, ACS Appl. Mater. Interfaces, 2018, 10, 7541–7561 CrossRef PubMed.
- K. Petcharoen and A. Sirivat, Mater. Sci. Eng., B, 2012, 177, 421–427 CrossRef CAS.
- I. Matai, A. Sachdev, P. Dubey, S. Uday Kumar, B. Bhushan and P. Gopinath, Colloids Surf., B, 2014, 115, 359–367 CrossRef CAS PubMed.
- P. Dubey and P. Gopinath, RSC Adv., 2016, 6, 69103–69116 RSC.
- I. Ocsoy, M. Temiz, C. Celik, B. Altinsoy, V. Yilmaz and F. Duman, J. Mol. Liq., 2017, 227, 147–152 CrossRef CAS.
- W. Wu, Q. He and C. Jiang, Nanoscale Res. Lett., 2008, 3, 397–415 CrossRef CAS PubMed.
- S. Tawab Shah, W. A. Yehye, O. Saad, K. Simarani, Z. Zaman Chowdhury, A. A. Alhadi and L. A. Al-Ani, Nanomaterials, 2017, 7, 306 CrossRef PubMed.
- M. Zhang, X. He, L. Chen and Y. Zhang, J. Mater. Chem., 2010, 20, 10696–10704 RSC.
- S. H. Liao, C. H. Liu, B. P. Bastakoti, N. Suzuki, Y. Chang, Y. Yamauchi, F. H. Lin and K. C. W. Wu, Int. J. Nanomed., 2015, 10, 3315–3328 CrossRef CAS PubMed.
- N. Bhattarai, J. Gunn and M. Zhang, Adv. Drug Delivery Rev., 2010, 62, 83–99 CrossRef CAS PubMed.
- H. li Ma, X. rong Qi, Y. Maitani and T. Nagai, Int. J. Pharm., 2007, 333, 177–186 CrossRef PubMed.
- P. M. Bedê, M. H. P. da Silva, A. B.-H. da S. Figueiredo and P. V. Finotelli, Polimeros, 2017, 27, 267–272 CrossRef.
- X. Zhao, Z. Li, Y. Deng, Z. Zhao, X. Li and Y. Xia, Materials, 2017, 10, 557 CrossRef PubMed.
- Y. Zhang, Q. Xu, S. Zhang, J. Liu, J. Zhou, H. Xu, H. Xiao and J. Li, Sep. Purif. Technol., 2013, 116, 391–397 CrossRef CAS.
- Y. Lin, H. Chen, K. Lin, B. Chen and C. Chiou, J. Environ. Sci., 2011, 23, 44–50 CrossRef CAS.
- G. A. Naikoo, R. A. Dar and F. Khan, J. Mater. Chem. A, 2014, 2, 11792–11798 RSC.
- G. Jiang, T. Jiang, Y. Wang, X. Du, Z. Wei and H. Zhou, RSC Adv., 2014, 4, 33658–33661 RSC.
- S. S. Leong, S. P. Yeap and J. K. Lim, Interface Focus, 2016, 6, 20160048 CrossRef PubMed.
- G. Pasparakis and N. Bouropoulos, Int. J. Pharm., 2006, 323, 34–42 CrossRef CAS PubMed.
- I. Zgura, T. Beica, I. L. Mitrofan, C. G. Mateias, D. Pirvu and I. Patrascu, Dig. J. Nanomater. Biostruct., 2010, 5, 749–755 Search PubMed.
- J.-H. Jiang, L.-P. Zhu, X.-L. Li, Y.-Y. Xu and B.-K. Zhu, J. Membr. Sci., 2010, 364, 194–202 CrossRef CAS.
- J. T. Arena, B. McCloskey, B. D. Freeman and J. R. McCutcheon, J. Membr. Sci., 2011, 375, 55–62 CrossRef CAS.
- I. Fernández Farrés and I. T. Norton, Food Hydrocolloids, 2014, 40, 76–84 CrossRef.
- B. E. Larsen, J. Bjørnstad, E. O. Pettersen, H. H. Tønnesen and J. E. Melvik, BMC Biotechnol, 2015, 15, 1–12 CrossRef CAS PubMed.
- H. Li, S. Liu and L. Lin, Int. J. Bioprint., 2016, 2, 10–12 Search PubMed.
- J. Malda, J. Visser, F. P. Melchels, T. Jüngst, W. E. Hennink, W. J. A. Dhert, J. Groll and D. W. Hutmacher, Adv. Mater., 2013, 25, 5011–5028 CrossRef CAS PubMed.
- P. Duan, N. Kandemir, J. Wang and J. Chen, MRS Adv., 2017, 2, 1309–1314 CrossRef CAS.
- M. Quirynen, H. C. Van Der Mei, C. M. L. Bollen, A. Schotte, M. Marechal, G. I. Doornbusch, I. Naert, H. J. Busscher and D. Van Steenberghe, J. Dent. Res., 1993, 72, 1304–1309 CrossRef CAS PubMed.
- C. Luo, W. Liu, B. Luo, J. Tian, W. Wen, M. Liu and C. Zhou, Carbohydr. Polym., 2017, 156, 235–243 CrossRef CAS PubMed.
- M. E. Weeks, G. Nebe von Caron, D. C. James, C. M. Smales and G. K. Robinson, J. Microbiol. Methods, 2006, 66, 43–55 CrossRef CAS PubMed.
- H. Sträuber and S. Müller, Cytometry, Part A, 2010, 77, 623–634 CrossRef PubMed.
Footnote |
| † Electronic supplementary information (ESI) available. See DOI: 10.1039/c9ra00623k |
| This journal is © The Royal Society of Chemistry 2019 |


