
 Open Access Article
 This Open Access Article is licensed under a Creative Commons Attribution-Non Commercial 3.0 Unported Licence
Effect of ion form of the ion-exchange resin on ε-poly-L-lysine purification from microbial fermentation broth†
Xusheng Chen *,
Qin Li,
Honggang He,
Jianhua Zhang and
Zhonggui Mao
*,
Qin Li,
Honggang He,
Jianhua Zhang and
Zhonggui Mao
The Key Laboratory of Industrial Biotechnology, Ministry of Education, School of Biotechnology, Jiangnan University, 1800 Lihu Road, Wuxi 214122, Jiangsu, China. E-mail: chenxs@jiangnan.edu.cn; Fax: +86 510 85918296; Tel: +86 510 85918296
First published on 17th April 2019
Abstract
ε-Poly-L-lysine (ε-PL) is an added-value natural product with widespread application in the fields of food, pharmaceuticals and biopolymer materials. However, the high production cost reduces its application. To improve the efficiency of ε-PL purification for decreasing the cost of downstream processes, the ion form of the ion-exchange resin, which is widely used for ε-PL purification, was investigated systematically in this study. Among eleven cation-exchange resins tested, the Amberlite IRC-50 resin offered the best adsorption capability and the highest desorption ratio. The adsorption kinetics of IRC-50 resin with H+, Na+ and NH4+ ion forms followed a pseudo-second-order model. The dynamic adsorption and desorption parameters of ε-PL were optimized with a column packed with IRC-50 resin with Na+ and NH4+. It is suggested that NH4+ is the optimal ion form of IRC-50 resin for ε-PL extraction. Under optimal conditions, the IRC-50 resin with NH4+ achieved the highest ε-PL adsorption capability, purity and recovery ratio of 307.96 mg g−1, 76.52% and 96.2%, respectively. After further purification, a final ε-PL purity of 97.10% was achieved with a total recovery ratio of 66.01%. This is the first report on improving the ε-PL purification efficiency through optimizing the ion form of the ion-exchange resin. Moreover, it would offer guidance for other natural product recovery processes by ion-exchange chromatography.
1. Introduction
ε-Poly-L-lysine (ε-PL), a unique homo-poly(amino acid) with 25–35 L-lysine residuals linked by ε-amino and α-carboxyl groups, is produced by various Streptomycetaceae and some Bacillus bacteria and a few filamentous fungi as a secondary metabolite.1,2 ε-PL has a strong antimicrobial activity towards Gram-positive and Gram-negative bacteria, yeast, fungi and viruses.3 Moreover, ε-PL is water soluble, biodegradable and has high food safety.4 Thus, it is approved as a natural food preservative by the US Food and Drug Administration as GRAS (Generally Regarded as Safe) since 2004. To date, ε-PL has been used in the food industry in Japan and South Korea for nearly 30 years, and has maintained rapid growth in the United States, Europe and China in recent years. Moreover, ε-PL also has wide potential application in the fields of pharmaceuticals and biopolymer materials.5 Hence, ε-PL is a value-added natural product with widespread application in industry.Although ε-PL has been manufactured on an industrial scale, its high cost restricts its widespread application in industry, especially in the food industry. In recent decades, extensive efforts have been devoted to improving ε-PL-producing strains and to optimize bioprocesses,6 to achieve ε-PL production that exceeds 20 g L−1, and the highest ε-PL production has reached 54.7 g L−1.7 Downstream processing costs can reach 50–70% of the total production cost in industrial biotechnology fields.8 However, few studies have investigated ε-PL bioseparation from fermentation broth. The first report on ε-PL purification used cation ion-exchange adsorption, activated-carbon decoloration, organic-solvent precipitation, and gel chromatography to identify the ε-PL chemical structure.9 Using this approach, Bankar et al.10 purified ε-PL from fermentation broth that contained 2 g L−1 ε-PL with a purity of 97.58% and a recovery ratio of 90.42%. Zhu et al.11 evaluated the ε-PL adsorption performances of HZB-3B (strong cation) and D155 (weak cation) resins and optimized the adsorption and desorption conditions, and achieved the highest desorption efficiency by 97.57% and the overall recovery by 94.49%. In addition, an ultrafiltration technique with 2 and 5 kDa cut-off molecular weights has been used to prepare ε-PL with different molecular weights from a crude extract of ε-PL hydrochloride.12 Recently, Katano et al.13 proposed a precipitation method to separate and purify ε-PL from 100 μL culture broth with tetraphenylborate anion. A metal-chelate affinity precipitation was used for ε-PL purification and achieved electrophoretic purity with a recovery ratio of 98.42%.14 Although both novel methods could extract ε-PL from the fermentation broth, investigations are required before applying them in industry because of food-safety or cost-related concerns.
In previous studies, we developed a potential industrial scheme for ε-PL separation and purification from fermentation broth, including mycelia removal by flocculation, macromolecule removal by 30 kDa ultrafiltration, ion-exchange adsorption, decolorization with a macroporous resin and small-molecule removal by 1 kDa ultrafiltration. A 90.2% purity and 75% recovery have been achieved.15 However, the purity of the resultant ε-PL does not meet standard requirements (purity > 95%). Based on an analysis of ε-PL bioseparation, ion exchange has been proven a key step for enhancing the ε-PL purity in this scheme, but the type of resin and exchange ion form have not been investigated. To improve the ε-PL purity and its efficiency, eleven cation-exchange resins were compared in terms of adsorption capacities and desorption ratio. Also, the adsorption kinetics of Amberlite IRC-50 with different ionic forms was characterized. Parameters of ε-PL adsorption and desorption on Amberlite IRC-50 with Na+ and NH4+ under static and dynamic conditions were optimized. Finally, ε-PL with standard requirements was prepared using Amberlite IRC-50 with NH4+ under optimal conditions with the help of activated carbon and ultrafiltration.
2. Materials and methods
2.1 Preparation and pre-treatment of ε-PL fermentation broth
The fermentation broth contained ε-PL with the concentration of around 40 g L−1 was prepared in a 5 L fermenter with glucose as carbon source by Streptomyces albulus M-Z18 using pH shock strategy.7 Fresh fermentation broth was centrifuged at 4500 × g for 20 min in several batches to remove mycelia, and then pooled supernatant and subjected to an ultrafiltration system (Pellicon 2 mini, Merck Millipore, MA, USA) coupled with a membrane package (0.1 m2) with the cut-off molecular weight of 30 kDa under 0.10–0.15 MPa inlet pressure as described in our previous study.15 The filtrate was collected with the ε-PL concentration of 8 g L−1 and used in this study.2.2 Adsorbents and pre-treatment
Eleven ion exchange resins, including two strong acidic cation exchange resins (HD-8 and HZD-3B) and nine weak acidic cation exchange resins (D113, HZD-2, DK110, D115, HD-2, D152, D155C, D151, Amberlite® IRC-50) were provided by Shanghai Huazhen Technology Co., Ltd. (Shanghai, China), Chemical Plant of Nankai University (Tianjin, China) and Sigma-Aldrich Chemical Company, Inc. (Milwaukee, WI, USA) in H+ form. Their physical properties and specification are shown in Table S1.† The fresh resins were washed firstly with deionized water to remove impurities, and then 5 times resin volume of 1.0 mol L−1 HCl, 1.0 mol L−1 NaOH and 1.0 mol L−1 HCl were sequentially used to treat these resins at 150 rpm shaking for 4 h at 25 °C, respectively. In particular, the Amberlite IRC-50 with Na+ was converted from H+ form followed by 5 times resin volume of 1.0 mol L−1 NaOH, 1.0 mol L−1 HCl, and 1.0 mol L−1 NaOH treating. Similarly, the Amberlite IRC-50 with NH4+ was prepared by 5 times resin volume of 1.0 mol L−1 NH3·H2O, 1.0 mol L−1 HCl, and 1.0 mol L−1 NH3·H2O at the same condition as other resins. In the process of resins activation or conversion, each operation of HCl, NaOH or NH3·H2O treatment was finished, deionized water was used to remove the residual HCl, NaOH or NH3·H2O until the pH was reached around neutral. Finally, these pre-treated resins were collected by vacuum filtration and stored in glass-stoppered bottles at room temperature for follow study.2.3 Static adsorption and desorption experiments
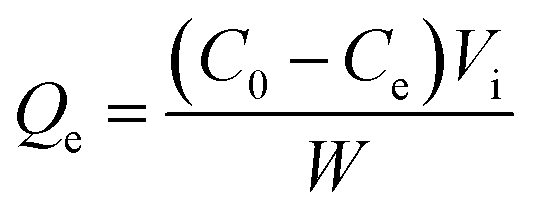
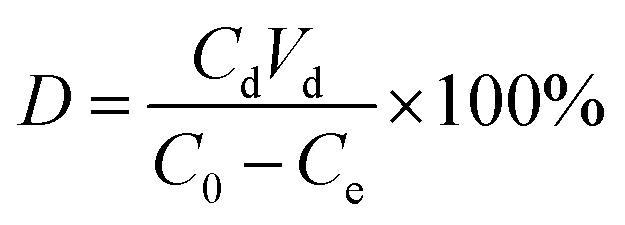
To test adsorption and desorption properties of 11 resins, each pre-treated resin with the weight of 5.0 g was added into 500 mL flask containing 100 mL pre-treated fermentation broth with the pH of 7.5. Then, the flask was placed onto a shaker with 150 rpm for 6.0 h at 25 °C. After that, the resin was collected by filtration and rinsed by 100 mL deionized water to remove the residual sample solution. Subsequently, the resin was desorbed by 200 mL 0.1 mol L−1 HCl in 500 mL flask with 150 rpm shaking for 12 h at 25 °C. The ε-PL concentrations before and after adsorption were detected, and the capacity of adsorption (Qe, eqn (1)) and the desorption ratio (D, eqn (2)) were quantified as the following equations:
 | (1) |
 | (2) |
For evaluation the effect of sample pH on ε-PL adsorption capacity of IRC-50 resin with H+, Na+ and NH4+, 1.0 g pretreated IRC-50 resin with H+, Na+ and NH4+ forms were added into 250 mL flasks containing 50 mL sample solution with the pHs of 3.0, 4.0, 5.0, 6.0, 7.0, 8.0, 9.0, 10.0, respectively. These flasks were placed onto a shaker with 150 rpm for 6 h at 25 °C. After that, the ε-PL concentration before and after adsorption was detected, and the capacity of adsorption was quantified by eqn (1). At the same time, resins were collected by vacuum filtration and rinsed by deionized water to remove the residual sample solution. Subsequently, IRC-50 resins with H+, Na+ and NH4+ were desorbed by 50 mL HCl, NaOH and NH3·H2O with the concentrations of 0.02, 0.05, 0.1, 0.2, 0.4 and 0.6 mol L−1 in 250 mL flasks with 150 rpm shaking for 6 h at 25 °C, respectively. The concentration of ε-PL in eluent was detected, and the ratio of desorption was quantified as eqn (2).
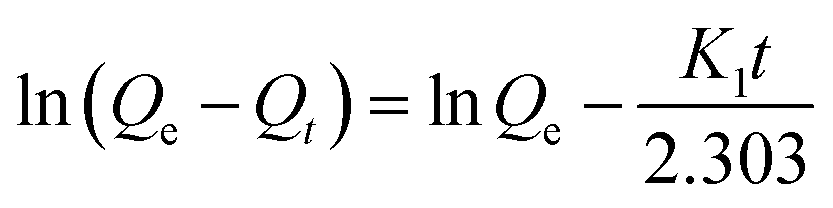
To obtain the static adsorption kinetics of ε-PL on the Amberlite IRC-50 with H+, Na+ and NH4+, 1.0 g pre-treated Amberlite IRC-50 resins were added into 250 mL flasks containing 50 mL standard ε-PL solution (10.0 g L−1) with the pH of 8.0, respectively. These flasks were placed onto a shaker with 150 rpm at 25 °C for 3 h, and 1.0 mL solution was withdrawn from each flask in every 10 min in the first 1.0 h, 20 min in the second 1.0 h, and 30 min in the last 1.0 h. The sample was subjected to detect the concentration of ε-PL, and calculated the corresponding adsorption capacity of every ion form in each time point as eqn (1). Then, these data were used to plot the static adsorption kinetic curves. In this study, the pseudo first-order equation and pseudo second-order equation were employed to describe the mechanism of ε-PL on Amberlite IRC-50 with different ion forms. The pseudo first-order equation, also known as Lagergren's equation, is the earliest known equation describing the adsorption rate based on adsorption capacity (3). It can be represented in a linear form as:
 | (3) |
Therefore, the first-order rate constant K1 and equilibrium adsorption capacity Qe can be calculated from the slope (K1/2.303) and the intercept (ln![[thin space (1/6-em)]](https://www.rsc.org/images/entities/char_2009.gif) Qe) by plotting ln(Qe − Qt) versus t.
Qe) by plotting ln(Qe − Qt) versus t.
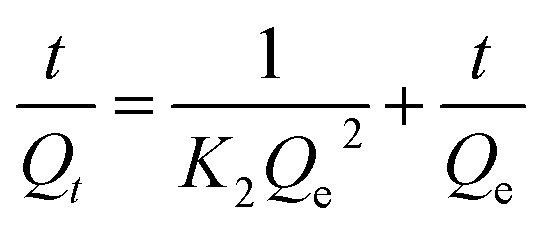
The pseudo second-order equation can be used to model the two-site-occupancy adsorption kinetics, i.e., the adsorbate molecule reacts with two adsorption sites (4). The equation is commonly used in its linearized form as:
 | (4) |
Therefore, the values for K2 and Qe can be estimated from the slope and the intercept, respectively, in the plot of t/Qt versus t.
2.4 Dynamic adsorption and desorption experiments
In this study, dynamic adsorption and desorption tests were performed in a chromatographic system contained six glass columns (20 × 200 mm) and a multichannel peristaltic pump (BT100-1F, Longer Precision Pump Co. Ltd, Baoding, China). Each column was packed IRC-50 resins with Na+ or NH4+ at the bed volume (BV) of 31.4 mL.To investigate the effect of sample pH on ε-PL adsorption at dynamic experiment, the sample pH was varied from 5.5 to 8.5, and the pre-treated fermentation broth were loaded onto columns contained IRC-50 with Na+ or NH4+ at a flow rate of 5.0 BV h−1. During loading, the presence of ε-PL in the effluent was monitored by Dragendorff reagent at every 10.0 mL interval. Once a noticeable Dragendorff positive precipitate producing, it means the adsorption was nearly reached equilibrium. The concentration of ε-PL in effluent was determined and used for calculating adsorption capacity. In addition, the leakage point in this study was defined as the concentration of ε-PL in the effluent solutions reached 5% of the initial concentration.
To investigate the effect of flow rate on ε-PL adsorption at dynamic experiment, the flow rate was varied from 2.0 to 7.0 BV h−1. The sample solution was divided into two parts, and their pHs were adjusted to pH 7.0 and pH 7.5 for loading onto columns contained IRC-50 resins with Na+ and NH4+, respectively. Other operation conditions are the same as the above mentioned pH optimization.
In addition, the dynamic breakthrough curves of IRC-50 resins with Na+ and NH4+ were prepared at their optimal conditions: the sample pH of 7.0 for IRC-50 resin with Na+, and pH 7.5 for IRC-50 resin with NH4+; the flow rates all at 5.0 BV h−1. The effluent was collected in every BV, and the contents of ε-PL, protein, pigment as well as pH value were detected, and used for generating the dynamic breakthrough curves. To monitor the presence of ε-PL in the effluent in time, Dragendorff reagent was also adopted.
After the adsorption equilibrium of IRC-50 resins with Na+ and NH4+ at the optimal uploading conditions, the resin column was washed by 4.0 BV deionized water at the flow rate of 2.0 BV h−1. To investigate the effect of eluent concentration and flow rate on dynamic desorption, the eluents (NaOH or NH3·H2O) concentrations varied from 0.05 to 0.3 mol L−1, and flow rates varied from 1.0 to 3.0 BV h−1. Moreover, the dynamic elution curves of IRC-50 resins with Na+ and NH4+ were prepared at the optimal conditions: IRC-50 resin with Na+ was eluted by 0.15 mol L−1 NaOH, IRC-50 resin with NH4+ was eluted by 0.2 mol L−1 NH3·H2O and the flow rates were all 2.0 BV h−1.
2.5 Further purification of ε-PL by activated carbon and ultrafiltration
To further improve the purity of ε-PL prepared by IRC-50 resins with NH4+, the elution was adjusted to pH 4.0 using 1 mol L−1 HCl at first, and then subjected to decolour by active carbon (1%, w/v) at 80 °C for 20 min. Subsequently, the activated carbon was removed by vacuum filtration and the filtrate was desalted by ultrafiltration with the cut-off molecular weight of 1.0 kDa membrane (0.1 m2) using ultrafiltration system (Pellicon 2 mini, Merck Millipore, MA, USA). The specific operation parameters have been described in our previous study.162.6 Analytical methods
The ε-PL concentration was determined using methyl orange method.17 In brief, an equal volume of sample with 0.06–0.12 g L−1 ε-PL diluted with 0.07 mM phosphate buffer (pH 6.90) and 0.7 mM methyl orange solution were mixed together, which reacted at 30 °C with shaking for 30 min. The interaction of cationic ε-PL with anionic methyl orange in the mixture led to form a water-insoluble complex, the ε-PL concentration can be estimated from the absorbance at 465 nm of the methyl orange remaining in the supernatant solution through standard curve calculation. The recovery ratio of ε-PL is calculated as following:
 | (5) |
The protein concentration was determined using the Bradford protein assay kit with bovine serum albumin as the standard.18 The removal ratio of protein is calculated as following:
 | (6) |
The pigment concentration is expressed as the absorbance of the sample at 410 nm on a spectrophotometer. To make sure the absorbance in the range of 0.2–0.6, deionized water was used to dilute the samples. The removal ratio of pigment is calculated as following:
 | (7) |
The purified ε-PL and its extraction process were also analyzed by HPLC (Chromaster, Hitachi, Japan) equipped with an ODS-120T column (4.6 mm × 250 mm; Tosho Co., Ltd., Tokyo) and a UV spectrophotometer detector (Chromaster, Hitachi, Japan). The mobile phase was 10 mM K2HPO4 and 10 mM Na2SO4 aqueous solution (pH 3.4 adjusted by H3PO4): acetonitrile (23:2, v/v) at a flow rate of 0.4 mL min−1. The operating conditions were as follows: monitoring wavelength, 215 nm; injection volume, 100 μL; column temperature, 30 °C. The purity of the purified ε-PL is calculated as following:
 | (8) |
The distribution of ε-PL chain length was characterized by MALDI-TOF-MS (Autoflex 2, Bruker Daltonics Inc., USA) and 2,5-dihydroxybenzoic acid was used as a matrix.19
2.7 Statistical analysis
All values were detected in triplicate, and expressed as means ± SD. The differences of the experimental results were analysed by Student's t-test with p < 0.05 as significant.3. Results and discussion
3.1 Adsorption and desorption capacities of ε-PL on cation-exchange resins
The chemical structure of ε-PL shows an equal number of amino groups to its polymerization degree, and its isoelectric point (pI) occurs at around pH 9.0.20 Thus, the ε-PL would exhibit features of a multi-cation when the solution pH is lower than 9.0, and a cation-exchange resin is used for ε-PL extraction from the fermentation broth as an adsorbent. As shown in Fig. 1, two strong acidic resins (HD-8 and HZD-3B) and nine weak acidic resins (D113, HZD-2, DK110, D115, HD-2, D152, D155C, D151, Amberlite IRC-50) were evaluated in terms of their ε-PL adsorption capacity and desorption ratio. The adsorption capacities of IRC-50 and HZD-3B resins exceeded 140 mg g−1, which suggests that both resins had a better adsorption selectivity for ε-PL compared with the others. Moreover, the IRC-50 resin showed the highest desorption ratio among the resins for ε-PL at 96.0%, which means that it has a better desorption capacity. However, the HZD-3B resin exhibited the lowest desorption ratio of only 22.0% among resins, except HD-8, which was approximately 70% lower than that of the IRC-50 resin, and which indicates that ε-PL dissociated with difficulty from HZD-3B. It might be HCl is not the best eluent for strong cation resin HZD-3B desorption. Considering economical in industrial application, the weak acidic resin IRC-50 was selected for ε-PL extraction from fermentation broth as an adsorbent in this study.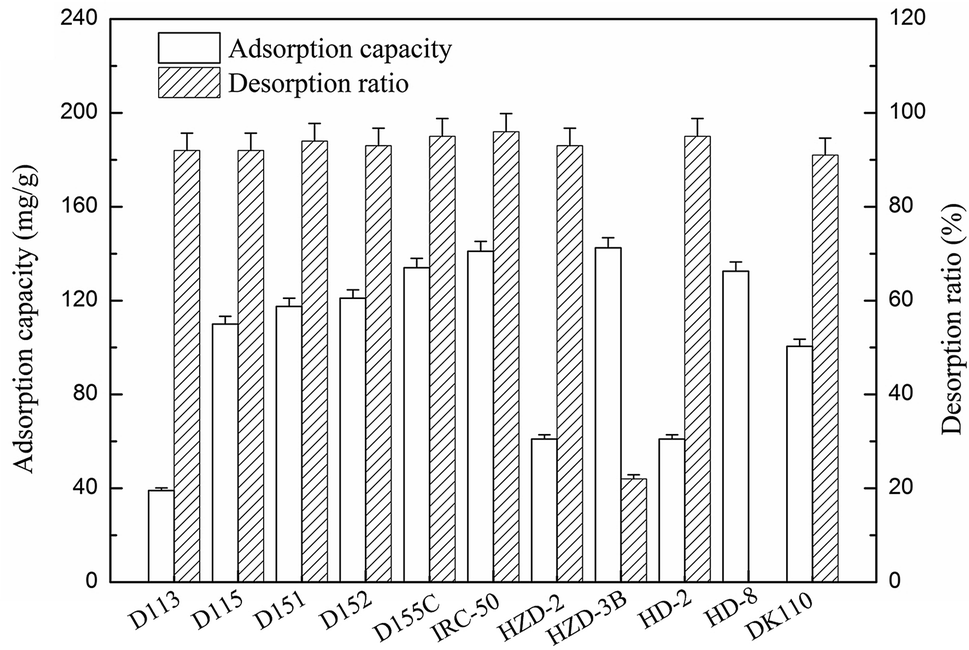 | ||
| Fig. 1 The static adsorption capacity and desorption ratio of ε-PL on different cation exchange resins. | ||
3.2 Static adsorption and desorption of ε-PL on Amberlite IRC-50 with different ion forms
An ion-exchange resin with different ion forms may result in a different adsorption capacity. The sample pH would determine the type and quantity of ionization of solute and resin. Thus, the ε-PL adsorption capacities of IRC-50 with H+, Na+ and NH4+ at different pHs were investigated, and the results are shown in Fig. 2a. The effect of pH on ε-PL adsorption on the resin with three ion forms was consistent. From pH 3.0 to 8.0, the ε-PL adsorption capacities of the three resins increased with an increase in pH, and the maximum adsorption capacities reached 238.7, 293.3 and 298.1 mg g−1 at pH 8.0, respectively. However, when the pH was increased to 10.0, the ε-PL adsorption capacities decreased sharply. As a result, the optimal pH for ε-PL adsorption using the IRC-50 resin with H+, Na+ and NH4+ ion forms were the same at 8.0, which is consistent with a previous study.9 However, the ε-PL adsorption capacity of the IRC-50 resin with H+ was lower than that of the Na+ and NH4+ ion forms of 22.9% and 24.9%, respectively. This might be derived from the IRC-50 resin with H+ result in the sample pH lower than that with Na+ and NH4+ ion forms (Fig. S1†).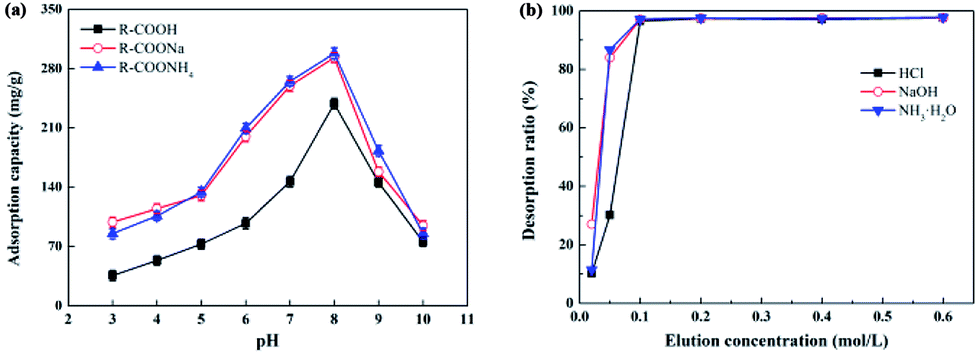 | ||
| Fig. 2 Effect of pH (a) and eluent concentration (b) on the static adsorption capacity and desorption ratio of ε-PL on Amberlite IRC-50 resin with H+, Na+ and NH4+ ion forms, respectively. | ||
Carboxyl is the functional group of the IRC-50 resin, and its dissociation constant (pKa) is ∼3.9.21 Therefore, when the solution pH ranged from 3.0 to 8.0, the dissociation of carboxyl was stronger with an increase in pH, and resulted in a rapid increase in ε-PL adsorption capacity. Although the dissociation of carboxyl would be improved with an increase in pH from 8.0 to 10.0, the ε-PL charge would change from positive to negative because its pI is 9.0.20 Therefore, pH 8.0 was determined as the optimum pH for ε-PL extraction using IRC-50 resin with H+, Na+ and NH4+ ion forms.
To facilitate resin regeneration, HCl, NaOH and ammonia were used as eluents for the IRC-50 resin with H+, Na+ and NH4+. As shown in Fig. 2b, the ε-PL desorption ratios of three resins increased rapidly when the corresponding eluent concentrations increased from 0.02 to 0.1 mol L−1. Interestingly, these resins achieved their maximum ε-PL desorption ratios of 96% at an eluent concentration of 0.1 mol L−1. However, the ε-PL desorption ratios could not be improved further with an increase in eluent concentration.
Although HCl, NaOH and ammonia at 0.1 mol L−1 concentrations had the same desorption effects towards ε-PL on the IRC-50 resin with H+, Na+ and NH4+ ion forms, their desorption mechanisms differed. HCl relies on the ion-exchange principle to replace the adsorbed ε-PL from resin because the weak acidic resin IRC-50 can combine H+ as a priority. NaOH and ammonia depend on a change in charge properties of the ε-PL from positive to negative, and finally dissociate from the resin. The higher eluent concentration could reduce the eluent volume used, but it would introduce additional salt in the following neutralization reaction, which would increase the desalination burden during operation. Therefore, 0.1 mol L−1 HCl, NaOH and ammonia were used for the IRC-50 resins with H+, Na+ and NH4+ as eluents, respectively.
3.3 Static adsorption kinetics of ε-PL on Amberlite IRC-50 resin with different ion forms
The adsorption kinetics of ε-PL on the IRC-50 resin with H+, Na+ and NH4+ ion forms are shown in Fig. 3a. The amount of ε-PL that was absorbed by the resin increased with contact time, and adsorption capacities increased linearly during the initial 10 min. Equilibrium of the IRC-50 resin with H+, Na+ and NH4+ reached around 120, 150 and 100 min with ε-PL adsorption capacities of 292.6, 430.8 and 433.0 mg g−1, respectively. Thus, the IRC-50 resin with H+, Na+ and NH4+ exhibited a slow adsorption.22 The initial linear adsorptive phase most likely results from the availability of more vacant surface sites on the resin to absorb ε-PL. However, with more ε-PL molecules on the resin, the repulsive forces between molecules on the resin surface and the high intra-particle mass transfer resistance in the micropores make ε-PL occupation more difficult,23 which slows absorption.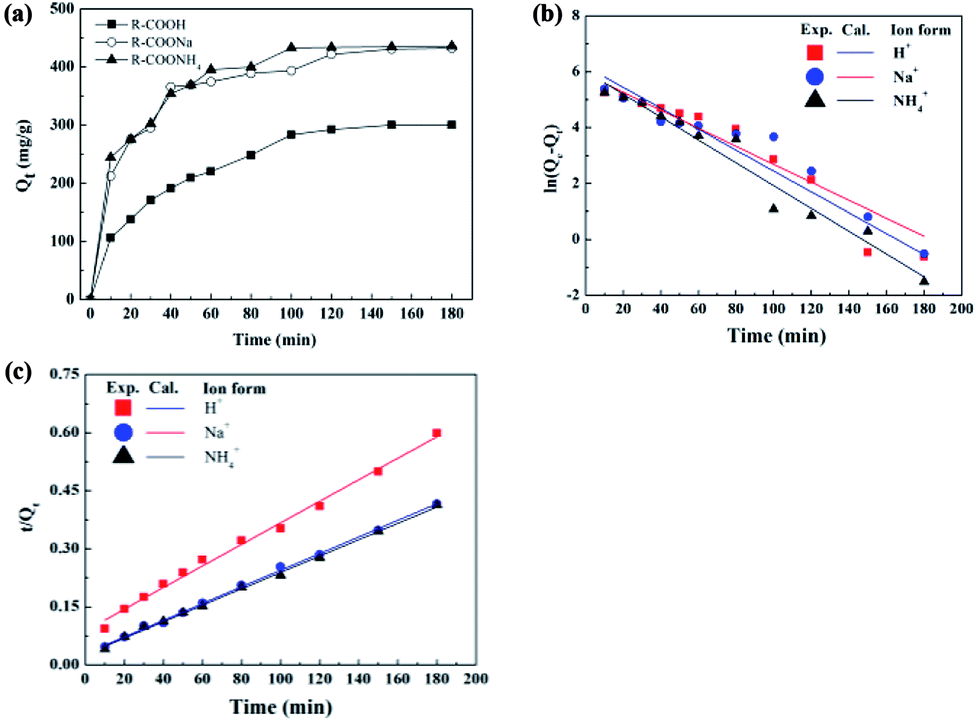 | ||
| Fig. 3 Static adsorption kinetics of ε-PL on Amberlite IRC-50 with H+, Na+ and NH4+ ion forms at 30 °C. (a) Time profiles of ε-PL adsorption on IRC-50 resin with H+, Na+ and NH4+ ion forms. (b) Plotting to the pseudo first-order equation. (c) Plotting to the pseudo second-order equation. | ||
To analyze the adsorption process and to describe the mechanism of ε-PL adsorbed on the resins, the most commonly used pseudo-first-order and pseudo-second-order models were used to plot static adsorption kinetics, with the results shown in Fig. 3b, c and Table 1. In the first-order kinetic model (Fig. 3b), the correlation coefficients (R2) from the IRC-50 resin with three ion forms were ∼0.95 (Table 1). Such results indicate that the pseudo-first-order equation was unsuitable to describe the mechanism of ε-PL adsorption on the IRC-50 resin. For the pseudo-second-order equation, a plot of t/Qt versus t (Fig. 3c) generated straight lines for all three ion forms with high R2 values (0.99) for the model fitting. The calculated Qe values agreed well with the experimental data (Table 1). These results showed that the adsorption reaction between the ε-PL and the functional groups of the resin follows second-order kinetics, which indicates a mechanism of two-site-occupancy adsorption for an IRC-50 resin with H+, Na+ and NH4+ ion forms. Based on the adsorption capacity (Fig. 2a and 3a), Na+ and NH4+ were selected as a preferable ion form of the IRC-50 resin for ε-PL separation in the following work.
| Ion forms | Pseudo-first-order model | Pseudo-second-order model | ||||||
|---|---|---|---|---|---|---|---|---|
| K1 (min−1) | Calculated Qe (mg g−1) | Experimental Qe (mg g−1) | R2 | K2 [g (mg−1 min−1)] | Calculated Qe (mg g−1) | Experimental Qe (mg g−1) | R2 | |
| R–COOH | 0.0860 | 489.5 | 292.6 | 0.9340 | 0.878 × 10⁻⁴ | 358.4 | 292.6 | 0.9927 |
| R–COONa | 0.0742 | 370.2 | 430.8 | 0.9321 | 0.154 × 10⁻³ | 465.3 | 430.8 | 0.9981 |
| R–COONH4 | 0.0941 | 410.1 | 433.0 | 0.9601 | 0.165 × 10⁻³ | 471.7 | 433.0 | 0.9978 |
3.4 Dynamic adsorption of ε-PL on Amberlite IRC-50 with Na+ and NH4+ ion forms
Although ε-PL adsorption conditions of IRC-50 resin with Na+ and NH4+ were investigated in static experiments, some differences between the static and dynamic experiments may occur. Thus, it is necessary to study the effects of pH and flow rate on ε-PL adsorption on the IRC-50 resin with Na+ and NH4+ in the column.The effect of pH on ε-PL adsorption on the IRC-50 resin with Na+ and NH4+ in terms of ε-PL adsorption capacity, and the removal ratios of proteins and pigments are shown in Fig. 4a and b. The removal ratios of the protein and pigment increased steadily from pH 5.5 to pH 8.5, which suggests that fewer protein impurities and pigments were adsorbed on the IRC-50 resin with Na+ accompanying the increase in pH (Fig. 4a). This result may occur because the pI of most proteins and pigments ranges from pH 5.0 to 7.0, and these impurities would be more negatively charged with an increase in pH. However, the maximum adsorption capacity of the ε-PL on the IRC-50 resin with Na+ reached 303.3 mg g−1 at pH 7.0, which differs from the results obtained in the static experiment (Fig. 2a). When the sample pH increased further from 7.0 to 8.5, the ε-PL adsorption capacity of the IRC-50 resin with Na+ showed a gradual decrease and reached only 74.5 mg g−1 at pH 8.5. Because the –COONa is a functional group of the IRC-50 resin with Na+, it combines preferentially with H+. The equilibrium pH of the IRC-50 resin with Na+ in a column was ∼10.3. Thus, the column pH would be closer to the pI of ε-PL (9.0) when the sample pH was increased from 7.0 to 8.5. This behaviour may be responsible for the decrease in ε-PL adsorption capacity of the IRC-50 resin with Na+ in the pH range from 7.0 to 8.5. In particular, the column pH exceeded 9.0 when the sample pH was 8.5, and resulted in an ε-PL charge from positive to negative. The performance of the IRC-50 resin with NH4+ for ε-PL extraction exhibited the same tendency as that with Na+, as shown in Fig. 4b. However, the maximum ε-PL adsorption capacity on the IRC-50 resin with NH4+ reached 307.9 mg g−1 at pH 7.5, and the minimum ε-PL adsorption capacity was 224.3 mg g−1 at pH 8.5. Because the equilibrium pH of the IRC-50 resin with NH4+ in the column was ∼9.8, the column pH could not exceed 9.0 when the sample pH was at/below 8.5, and the ε-PL remained positively charged. Based on the ε-PL adsorption capacity, the optimal sample pHs were 7.0 and 7.5 for the IRC-50 resin with Na+ and NH4+, respectively.
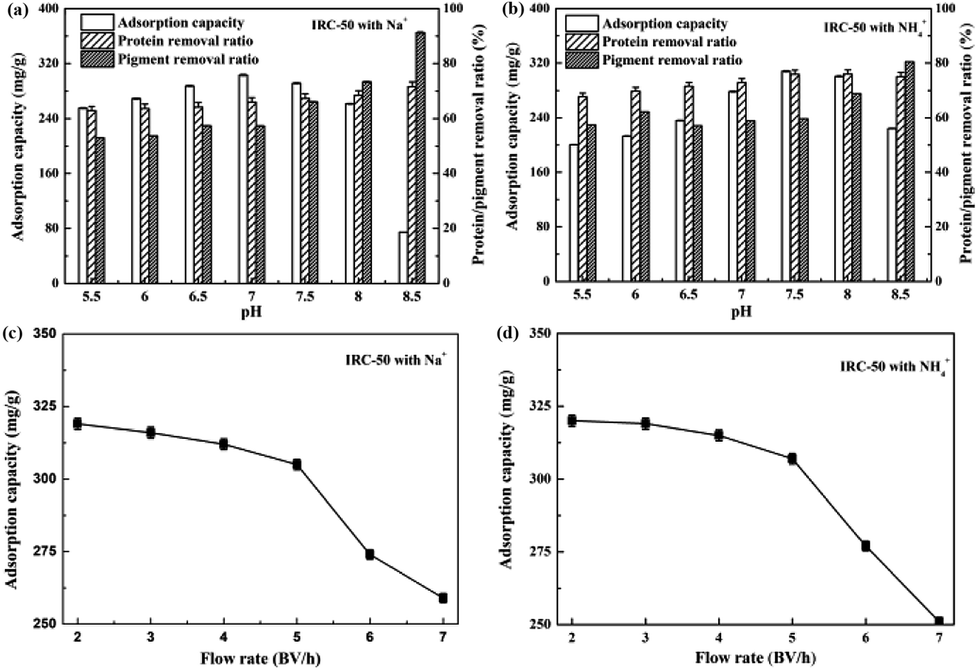 | ||
| Fig. 4 Effect of pH and flow rate on dynamic ε-PL adsorption on IRC-50 resin with Na+ and NH4+ ion forms. (a) Effect of pH on ε-PL adsorption on IRC-50 resin with Na+, (b) effect of pH on ε-PL adsorption on IRC-50 resin with NH4+, (c) effect of flow rate on ε-PL adsorption on IRC-50 resin with Na+, (d) effect of flow rate on ε-PL adsorption on IRC-50 resin with NH4+. | ||
The flow rate affected the ε-PL adsorption capacity, and determined the working time. Thus, it is necessary to investigate the effect of flow rate on the ε-PL adsorption capacity. As shown in Fig. 4c and d, the ε-PL adsorption capacities of the IRC-50 resins with Na+ and NH4+ were reduced only slightly when the flow rate was increased from 2.0 to 5.0 bed volumes (BV) h−1. However, when the flow rate was increased from 5.0 to 7.0 BV h−1, the ε-PL adsorption capacities of the IRC-50 resins with Na+ and NH4+ were reduced significantly. As a result, the optimal flow rate of the IRC-50 resins with Na+ and NH4+ were 5.0 BV h−1, and the corresponding ε-PL adsorption capacities reached 305.1 and 307.2 mg g−1, respectively.
Based on the pH and flow-rate optimizations, the breakthrough curves of the ε-PL adsorption processes in the columns packed with IRC-50 resin with Na+ and NH4+ at 5.0 BV h−1 are shown in Fig. 5a and b, respectively. ε-PL was adsorbed completely in the first 51 and 50 BV in both columns. Thereafter, leakage occurred and increased rapidly. As a result, the maximum loading volumes of both resins were 51 and 50 BV. The corresponding ε-PL adsorption capacities of both resins reached 303.3 and 308.0 mg g−1.
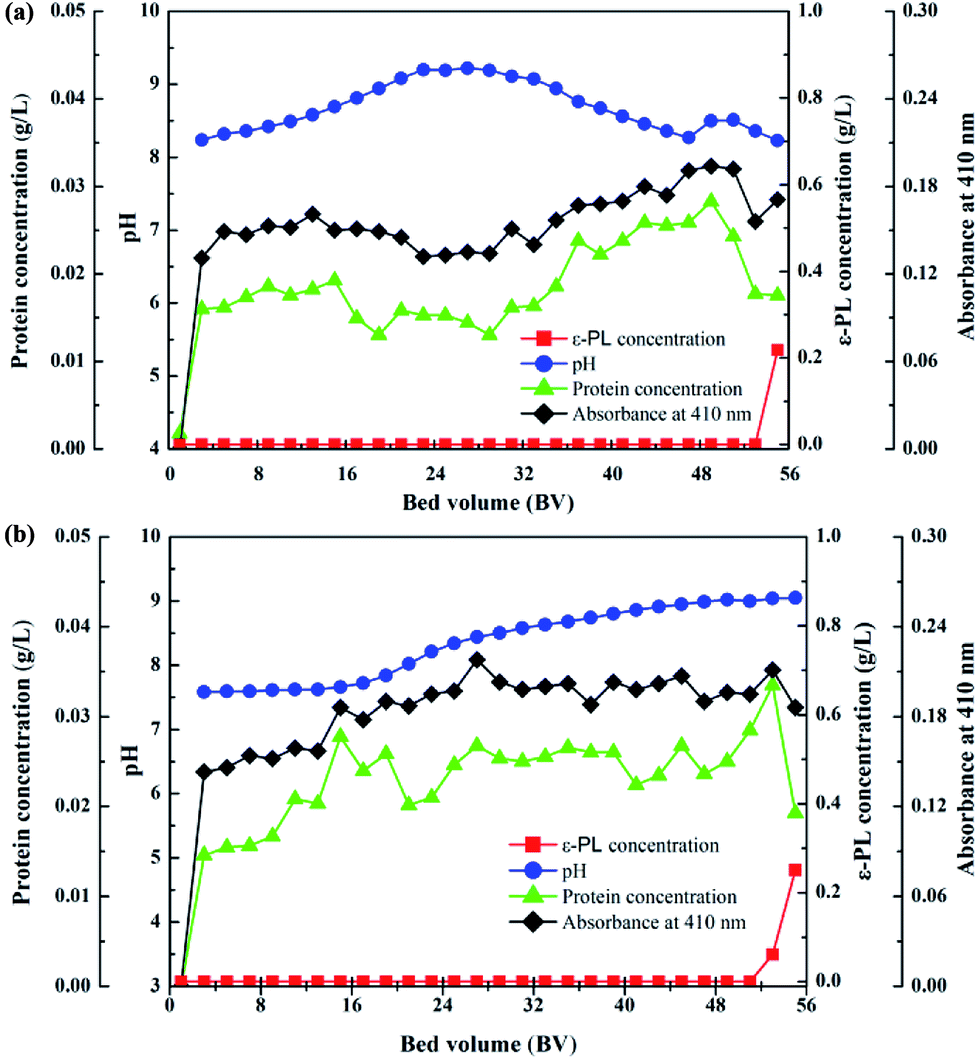 | ||
| Fig. 5 The breakthrough curves of ε-PL on IRC-50 resins with Na+ (a) and NH4+ (b) at the flow rate of 5.0 BV h−1. | ||
3.5 Dynamic desorption of ε-PL on Amberlite IRC-50 with Na+ and NH4+ ion forms
Because the desorption ratio is highly dependent on the elution time, the maximum elution time was restricted to 8.0 h to ensure experiment efficiency. As shown in Table S1,† the ε-PL desorption ratios were less than 90% when 0.05 and 0.10 mol L−1 NaOH was used as eluent, which indicates that the adsorbed ε-PL on the IRC-50 resin with Na+ could not be desorbed completely in 8.0 h using both eluents. This result was significantly different from those obtained in static experiments (Fig. 2b). When the NaOH concentration was increased to 0.15 mol L−1, the ε-PL desorption ratio was 95.08% within 7.0 h of elution. However, with a further increase in NaOH concentration, the improvement in ε-PL desorption ratio was not obvious. Moreover, the consumption of NaOH was enhanced significantly, which would produce excessive salt in the ensuing operation. Therefore, 0.15 mol L−1 NaOH was used as an eluent for ε-PL desorption on the IRC-50 resin with Na+. Interestingly, as shown in Table S3,† the effect of NH3·H2O on the ε-PL desorption on IRC-50 resin with NH4+ was similar to that of NaOH. However, the optimal NH3·H2O concentration was 0.20 mol L−1.As shown in Tables S4 and S5,† the ε-PL desorption ratios exceeded 95% at various elution rates, regardless of whether IRC-50 resin with Na+ using NaOH as eluent or NH4+ using NH3·H2O as eluent was used. No significant difference existed among various elution rates in terms of ε-PL desorption ratio. The elution time decreased with an increase in elution rate, but the decrease in elution time was not obvious when the elution rate exceeded 2.0 BV h−1. However, the amount of consumed NaOH or NH3·H2O improved with an increase in elution rate. Therefore, an elution rate of 2.0 BV h−1 was chosen for ε-PL desorption on the IRC-50 resin with Na+ and NH4+.
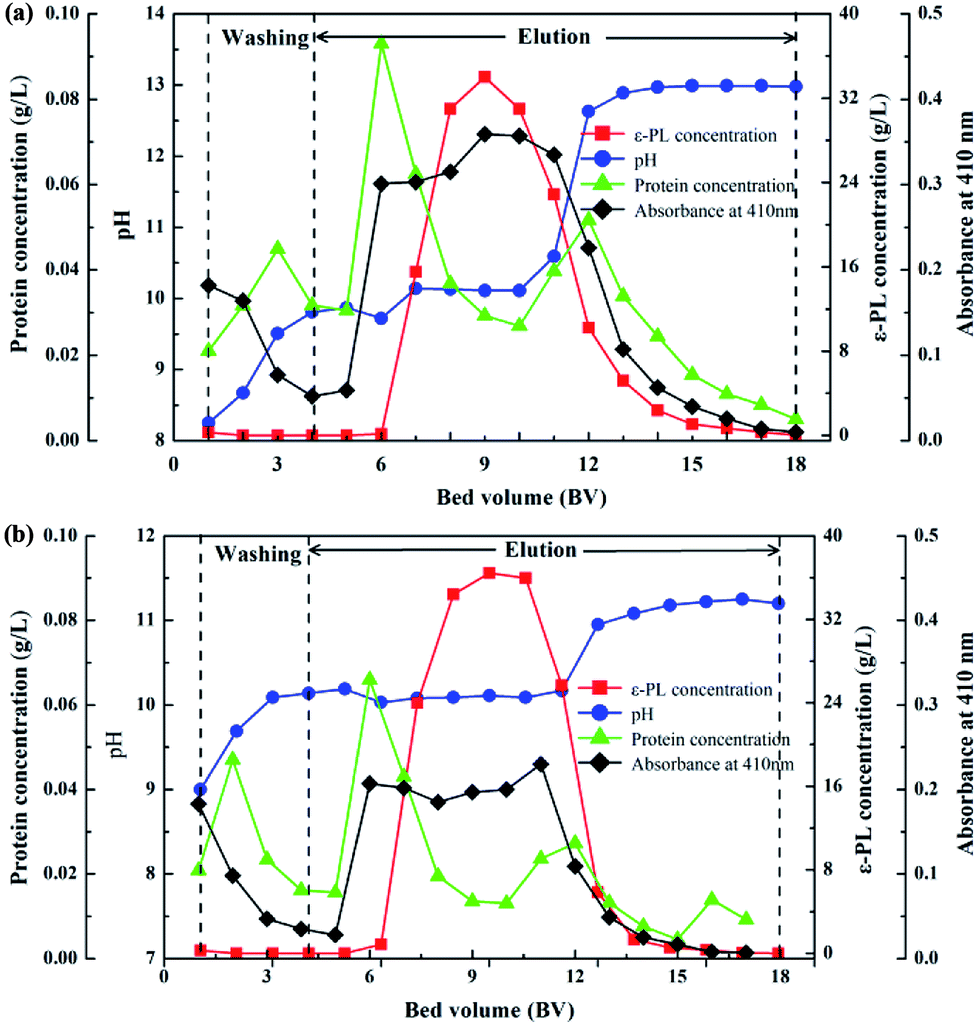
The ε-PL adsorption equilibrium IRC-50 resin with Na+ and NH4+ was eluted under the optimized desorption conditions based on the above investigation. Deionized water (4 BV) was used for washing both resins before eluting, and the washing and elution processes are shown in Fig. 6. The purpose of washing is to remove impurities that remain on the resin surface, gap and/or bind to the resin with a weak force to improve the purity of the ε-PL during elution. In both IRC-50 resins with Na+ and NH4+, the chromaticity decreased gradually, and impurity protein concentration increased initially and then decreased in the washing stage. The pH increased steadily until washing had finished, which may be derived from the weak acid IRC-50 resin combining with H+ from the deionized water. During elution, no ε-PL was eluted in the first 2 BV, and the concentrations of protein impurities and pigment increased rapidly. From the third to thirteenth NaOH or NH3·H2O BV, ε-PL was eluted in a normal distribution. Unfortunately, the protein impurities and pigment were eluted with ε-PL, which indicates that additional purification operations are required to improve the ε-PL purity. Finally, as shown in Table S6,† both IRC-50 resins with Na+ and NH4+ achieved similar ε-PL purities of 75.86% and 76.52%, respectively, and of ∼45% higher than that obtained from the IRC-50 resin with H+, which is widely used for ε-PL purification.9,10 However, the chromatogram for ε-PL elution from IRC-50 resins with NH4+ (Fig. 7e) was better than that for H+ (Fig. 7c) and Na+ (Fig. 7d) with less impurities, and also superior to the supernatant of fermentation broth (Fig. 7b). Therefore, the IRC-50 resin with NH4+ was the best resin for ε-PL extraction from the fermentation broth.
 | ||
| Fig. 6 The elution curves of ε-PL on IRC-50 resin with Na+ and NH4+ ion forms. (a). IRC-50 resin with Na+ ion form eluted by 0.15 mol L−1 NaOH, (b) IRC-50 resin with NH4+ eluted by 0.20 mol L−1 NH3·H2O at the flow rate of 2.0 BV h−1. | ||
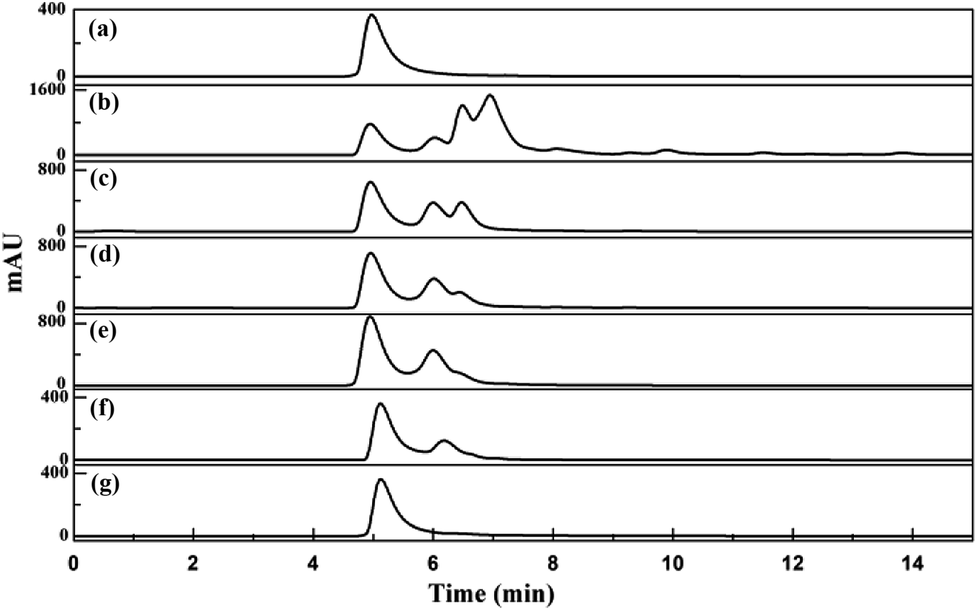 | ||
| Fig. 7 HPLC chromatograms of each operation in the process of ε-PL extraction at the wavelength of 215 nm. (a) Standard ε-PL sample. (b) Supernatant of fermentation broth. (c) Elution of IRC-50 with H+. (d) Elution of IRC-50 with Na+, (e) elution of IRC-50 with NH4+. (f) Filtrate of decolorization by activated carbon. (g) Retentate of 1 kDa ultrafiltration. | ||
3.6 Further purification of ε-PL by activated carbon and ultrafiltration
As shown in Fig. S2,† ε-PL eluted from the IRC-50 resin with NH4+ was dark yellow, but the filtrate was nearly colourless after activated carbon decolorization. However, the impurity peak in the decolorization filtrate with a retention time of 6.2 min could not be removed (Fig. 7f). A large amount of salt was produced during pH adjustment in the decolorization operation from pH 11 to pH 4. Ultrafiltration with a cut-off molecular weight of 1 kD was used to remove the impurity peak and salt based on our previous study.15 The impurity peak was removed completely (Fig. 7g) and residual salt satisfied the standard requirement (Table S7†). In fact, other physical and chemical parameters of the extracted ε-PL satisfied the standard, including the appearance (Fig. S2†) and polymerization degree (Fig. S3†). Based on ten successive operations, as shown in Table S8,† the average ε-PL recovery ratio and purity reached 66.01% ± 2.49% and 97.10% ± 0.95%, respectively, and the average ε-PL adsorption capacity of the IRC-50 resin with NH4+ achieved 297.60 ± 7.63 mg g−1. It is suggested that the reusability of the IRC-50 resin with NH4+ was stable in the ε-PL adsorption and impurity-removal capacities.4. Conclusions
Two strong and nine weak acid cation-exchange resins were used for ε-PL extraction, and compared in terms of adsorption capacity and desorption ratio. Amberlite IRC-50 was found to be superior to the other resins. Adsorption kinetics analysis showed that Amberlite IRC-50 resins with H+, Na+ and NH4+ were well fitted to the pseudo-second-order kinetic models. The ε-PL separation parameters of Amberlite IRC-50 resin with Na+ and NH4+ were optimized by static and dynamic adsorption/desorption experiments, and NH4+ was the optimal ion form of Amberlite IRC-50 resin used for ε-PL extraction. The ε-PL adsorption capability of Amberlite IRC-50 resin with NH4+ reached 307.96 mg g−1 and the ε-PL purity achieved 76.52% under optimized operating conditions, i.e., the sample pH was adjusted to 7.5 and loaded at a flow rate of 5.0 BV h−1, and 0.2 mol L−1 NH3·H2O was used as an eluent and eluted at a flow rate of 2.0 BV h−1. The ε-PL purity was improved to 97.10% ± 0.95% with a recovery ratio of 66.01% ± 2.49% combined with activated carbon and ultrafiltration.Conflicts of interest
The authors report no conflicts of interest in this work.Acknowledgements
This work was financially supported by the Natural Science Foundation of China (31671846), the Science and Technology Department of Jiangsu Province (BY2016022-25), and the National First-Class Discipline Program of Light Industry Technology and Engineering (LITE2018-27).References
- M. Nishikawa and K. Ogawa, Appl. Environ. Microbiol., 2002, 68, 3575–3581 CrossRef CAS PubMed.
- N. A. El-Sersy, A. E. Abdelwahab, S. S. Abouelkhiir, D. M. Abou-Zeid and S. A. Sabry, J. Basic Microbiol., 2012, 52, 513–522 CrossRef CAS.
- S. Shima, H. Matsuoka, T. Iwamoto and H. Sakai, J. Antibiot., 1984, 37, 1449–1455 CrossRef CAS.
- J. Hiraki, Fine Chem., 2000, 29, 18–25 Search PubMed.
- Y. Hamano, Biosci., Biotechnol., Biochem., 2011, 75, 1226–1233 CrossRef CAS PubMed.
- Z. Xu, Z. Xu, X. Feng, D. Xu, J. Liang and H. Xu, Appl. Microbiol. Biotechnol., 2016, 100, 6619–6630 CrossRef CAS PubMed.
- X. D. Ren, X. S. Chen, X. Zeng, L. Wang, L. Tang and Z. G. Mao, Bioprocess Biosyst. Eng., 2015, 38, 1113–1125 CrossRef CAS PubMed.
- K. K. Cheng, X. B. Zhao, J. Zeng, R. C. Wu, Y. Z. Xu, D. H. Liu and J. A. Zhang, Appl. Microbiol. Biotechnol., 2012, 95, 841–850 CrossRef CAS.
- S. Shima and H. Sakai, Agric. Biol. Chem., 1981, 45, 2503–2508 CAS.
- S. B. Bankar, S. A. Chaudhary and R. S. Singhal, J. Sci. Ind. Res. India, 2014, 73, 33–40 CAS.
- M. Zhu, Z. Zhang, Y. Liu, F. Wang, L. Xia, J. Xia and H. Guo, Int. J. Polym. Sci., 2016, 3785036 Search PubMed.
- S. Jia, B. Fan, Y. Dai, G. Wang, P. Peng and Y. Jia, Food Sci. Biotechnol., 2010, 19, 361–366 CrossRef CAS.
- H. Katano, K. Uematsu, C. Maruyama and Y. Hamano, Anal. Sci., 2014, 30, 17–24 CrossRef CAS.
- S. Li, Z. Ding, J. Liu and X. Cao, Appl. Biochem. Biotechnol., 2017, 183, 1254–1264 CrossRef CAS PubMed.
- X. S. Chen, Y. Gao, B. Zhen, D. Han, J. H. Zhang and Z. G. Mao, Process Biochem., 2016, 51, 134–141 CrossRef CAS.
- X. S. Chen, K. F. Wang, G. C. Zheng, Y. Gao and Z. G. Mao, Process Biochem., 2018, 68, 22–29 CrossRef CAS.
- F. R. Itzhaki, Anal. Biochem., 1972, 50, 569–574 CrossRef PubMed.
- M. M. Bradford, Anal. Biochem., 1976, 72, 248–254 CrossRef CAS PubMed.
- M. Nishikawa, Enzyme Microb. Technol., 2009, 45, 295–298 CrossRef CAS.
- J. Hiraki and T. Ichikawa, Regul. Toxicol. Pharmacol., 2003, 37, 328–340 CrossRef CAS PubMed.
- M. Bishai, S. De, B. Adhikari and R. Banerjee, 3 Biotech., 2015, 5, 455–463 CrossRef.
- C. Y. Ma, J. Tang, H. X. Wang, G. J. Tao, X. H. Gu and L. M. Hu, J. Sep. Sci., 2009, 32, 185–191 CrossRef CAS PubMed.
- L. S. Lv, J. Tang and C. T. Ho, J. Chem. Technol. Biotechnol., 2008, 83, 1422–1427 CrossRef CAS.
Footnote |
| † Electronic supplementary information (ESI) available: Fig. S1–S3 and Tables S1–S8. See DOI: 10.1039/c9ra00493a |
| This journal is © The Royal Society of Chemistry 2019 |