
 Open Access Article
 This Open Access Article is licensed under a
 Creative Commons Attribution 3.0 Unported Licence
New antiproliferative germacranolides from Carpesium divaricatum†
Tao Zhang‡
a,
Qiu-Bo Zhang‡a,
Lu Fuab,
Ling-Yu Lia,
Li-Yan Maa,
Jin-Guang Sia,
Hong-Wu Zhanga,
Jian-He Weia,
Shi-Shan Yuc and
Zhong-Mei Zou *a
*a
aInstitute of Medicinal Plant Development, Chinese Academy of Medical Sciences, Peking Union Medical College, Beijing 100193, P. R. China. E-mail: zmzou@implad.ac.cn; Fax: +86-10-57833290; Tel: +86-10-57833290
bSchool of Pharmacy, Henan University of Traditional Chinese Medicine, Zhengzhou 450008, P. R. China
cInstitute of Materia Medica, Chinese Academy of Medical Sciences, Peking Union Medical College, Beijing 100150, P. R. China
First published on 11th April 2019
Abstract
Six new highly oxygenated (2–7) and one known (1) germacranolides were isolated from the whole plant of Carpesium divaricatum. The planar structures and relative configurations of the new compounds were determined by detailed spectroscopic analysis. The absolute configurations of 1 and 3 were established by circular dichroism (CD) and X-ray crystallographic analyses, and the stereochemistry of the new compounds 2 and 4–6 were determined by similar CD data to 1 and 3, respectively. All isolates were evaluated for their antiproliferative activities against three human tumor cell lines, and compounds 3 and 6 show antiproliferative activities against HeLa and Hep G2 cells with IC50 values of 4.13–8.37 μM. Intensive mechanism study showed that 3 caused cell-cycle arrest at the S/G2 phase and induced apoptosis in Hep G2 cells through a mitochondria-related pathway.
Introduction
Lately, liver cancer has emerged as the most common malignant tumor in the digestive system, and is recognized as the second leading cancer responsible for mortality in men.1 China is a high incidence area of liver cancer, and its incidence rate is 1.5 times the world average level.2 Chemotherapy is an effective therapy for liver cancer in surgical treatment. However, the therapeutic effect is usually poor due to the low selectivity and toxicity of chemotherapy drugs.3,4The genus Carpesium belongs to the family Asteraceae with 25 species distributed across Asia and Europe, particularly in southwest China.5,6 Sesquiterpenoids were considered as the characteristic constituents of this genus with diverse bioactivities such as cytotoxic, anti-inflammatory, and anti-parasitic activities.6 As an important member of this genus, Carpesium divaricatum Sieb.et Zucc is widely distributed in China, traditionally used for the treatment of fevers, colds, bruises, insect bites and inflammatory diseases.7–12 Previous investigations of this plant reported the isolation of germacranolides.11–15 The potential values of germacranolides to treat cancer and inflammatory diseases from the genera Carpesium, Inula, and Allagopappus have drawn increasing attention.8,12–26
In our continuing effort to search for bioactive constituents from C. divaricatum, highly oxygenated germacranolides attracted our attention due to their structural diversity. Seven highly oxygenated germacranolides including six new ones (2–7) were identified in the current investigation. These highly oxygenated germacranolides contains as many as eight stereogenic centers. NOESY spectrum, circular dichroism (CD) method and X-ray data analysis were used to confirm their relative and absolute configurations.
Notably, compounds 1–2 have opposite configurations at C-8 compared to subtype III we previously reported, indicating an incomplete structural formula of subtype III.27 In order to show the universality of structural formula, it is suggested that the configurations at C-4, C-5 and C-8 of subtype III should be depicted as shown (Fig. 1). Similarly, the main differences between compounds 3–6 and subtype IV, and compound 7 and subtype I are the interchange linkage groups at C-8/C-9 and the opposite configurations at C-10, respectively.27 The configurations at C-6/C-8/C-9 in subtypes I and II, the configurations at C-4/C-5/C-8/C-9, and the substituted groups at C-8/C-9 in subtype IV were revised as shown in this paper.
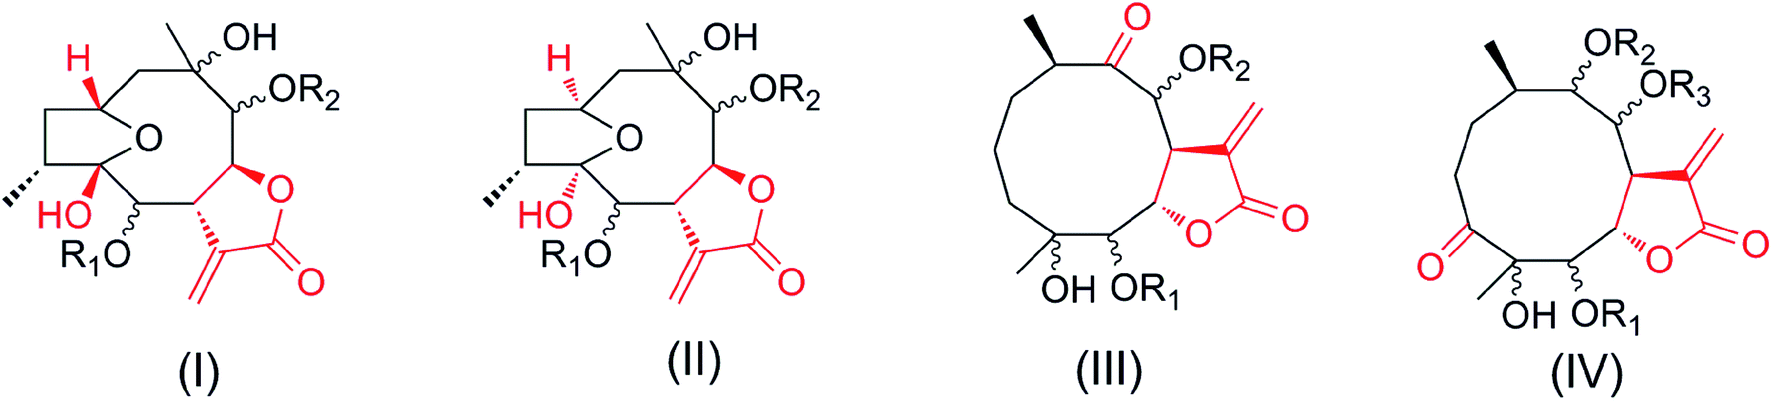 | ||
| Fig. 1 Four subtypes of germacranolides. | ||
Furthermore, we screened the isolated compounds for the growth inhibition effect in three tumor cell lines, and then characterized the possible mechanism. It was found that 3 and 6 exhibited potent cytotoxicity against human cervical cancer (HeLa) and hepatocellular cancer (Hep G2) cell lines, respectively. Besides, compound 3 induced apoptosis and cell cycle arrest in Hep G2 cells Fig. 2.
 | ||
| Fig. 2 Chemical structures of compounds 1–7. | ||
Results and discussion
Structural elucidation
An 95% ethanol extract of the whole plant of C. divaricatum was subjected to repeated silica gel, MCI gel, Sephadex LH-20 and semi-prepare HPLC to afford six new highly oxygenated germacranolides (2–7) and one known analogue (1).Cernuumolide I (1) was identified by comparison of MS, NMR data, as well as optical rotation data with those reported.28 Its absolute configuration was further confirmed by CD spectrum (see ESI Fig. C1†) and X-ray diffraction (Fig. 3).
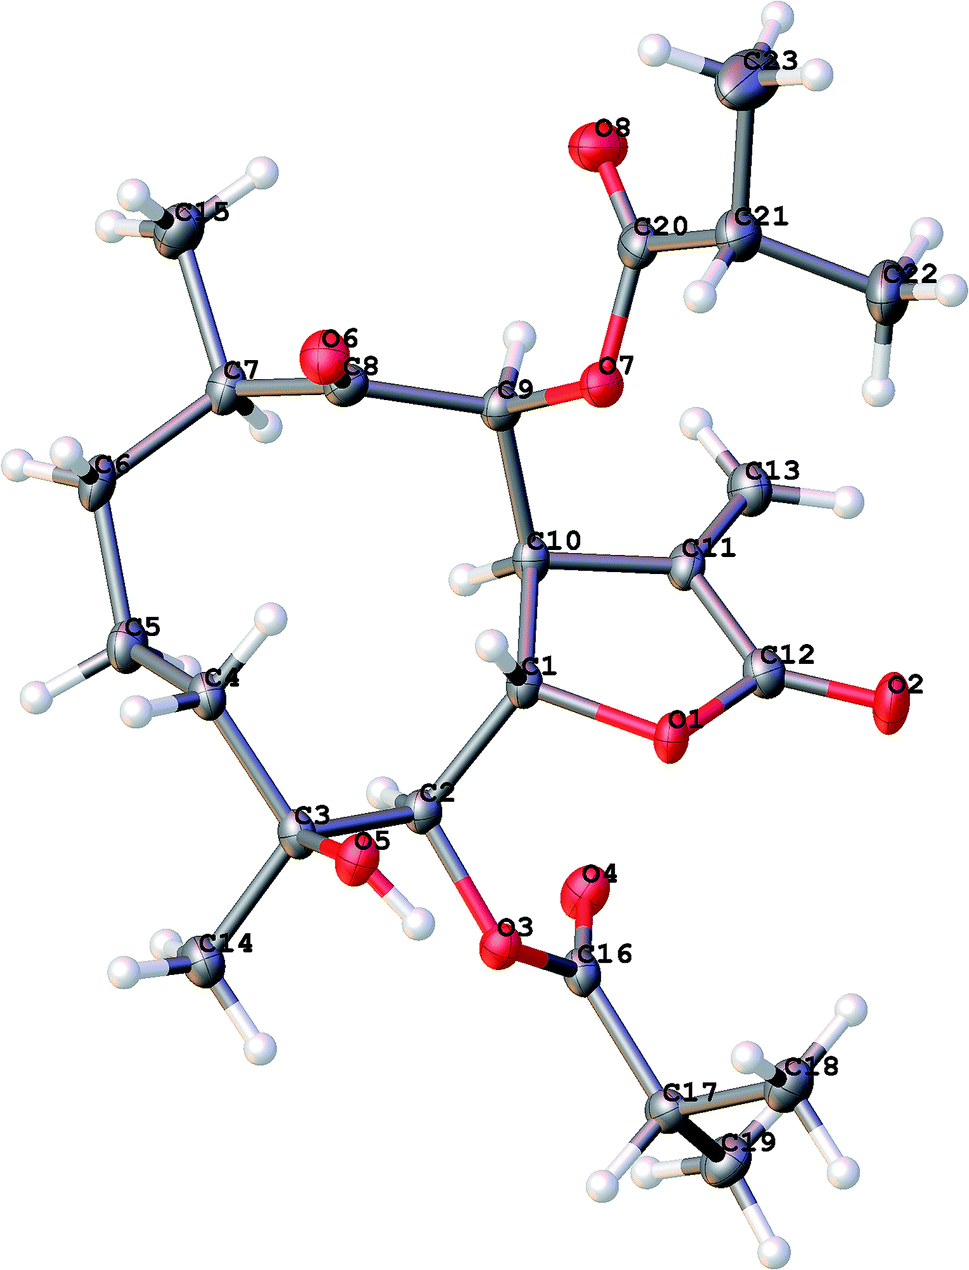 | ||
| Fig. 3 X-ray ORTEP drawing of 1. | ||
Compound 2 was obtained as white needles. The molecular formula was assigned as C23H32O8 on the basis of the positive-ion HRESIMS peak at m/z 459.1992 [M + Na]+, together with its 1H and 13C NMR data (Tables 1 and 2). Its IR spectrum showed hydroxyl (3514 cm−1) and carbonyl (1748 cm−1) absorptions. The 1H and 13C NMR spectra of 2 showed an α-methylene-γ-lactone at δH 6.34 (1H, d, J = 2.4 Hz, Ha-13) and 6.14 (1H, d, J = 2.4 Hz, Hb-13), δC 137.3 (C-11), 125.1 (C-13) and 171.3 (C-12); three carbonyl carbons at δC 211.3 (C-9), 179.0 (C-1′) and 167.0 (C-1′′); one oxygenated tertiary carbon at 73.7 (C-4); five methines including three oxygenated ones at δH 4.66 (1H, d, J = 6.6 Hz, H-5), 4.72 (1H, dd, J = 6.6, 1.8 Hz, H-6), 4.19 (1H, m, H-7), 5.46 (1H, d, J = 1.8 Hz, H-8) and 3.15 (1H, m, H-10), δC 79.1 (C-5), 73.5 (C-6), 45.4 (C-7), 83.4 (C-8), and 44.0 (C-10); and two methyl groups at δH 1.14 (3H, d, J = 7.2 Hz, CH3-14), 1.16 (3H, s, CH3-15). These signals (1H and 13C NMR data) implied that the structure of 2 was similar to that of 1 except that the isobutyryloxy group of 1 was replaced by a 2-methacryloyloxy group at C-8 in 2, which was further confirmed by the 1H–1H COSY, HSQC, and HMBC spectra (Fig. 4). On the basis of these data, the planar structure of 2 was established.
| No. | 2a | 3a | 4b | 5b | 6b | 7b |
|---|---|---|---|---|---|---|
| a Measured at 600 MHz in methanol-d4.b Measured at 500 MHz in methanol-d4.c Overlapped with other signals. | ||||||
| 1a | 1.71 oc | 1.88 m | 1.89 m | 1.90 m | 1.94 m | 2.59 m |
| 1b | 1.71 o | 1.73 m | 1.71 m | 1.72 m | 1.76 m | 1.55 d (5.0) |
| 2a | 1.72 m | 3.84 br d (11.4) | 3.76 m | 3.77 m | 3.83 m | 4.55 td (8.0,2.0) |
| 2b | 1.24 m | 2.24 o | 2.30 m | 2.31 m | 2.35 m | |
| 3a | 1.51 m | 2.51 m | ||||
| 3b | 1.33 m | 1.29 m | ||||
| 4 | 2.26 m | |||||
| 5 | 4.66 d (6.6) | 5.41 dd (9.6,1.8) | 5.20 dd (8.0,2.0) | 5.18 d (10.0) | 5.30 d (10.0) | |
| 6 | 4.72 dd (6.6, 1.8) | 4.70 dd (9.6,6.6) | 4.88 dd (8.0,4.0) | 4.90 dd (10.0,5.0) | 4.95 dd (10.0,5.0) | 3.75 d (10.0) |
| 7 | 4.19 m | 3.07 m | 3.11 m | 3.14 m | 3.17 m | 3.26 m |
| 8 | 5.46 d (1.8) | 4.47 d (10.2) | 5.56 d (8.5) | 5.65 d (10.0) | 5.68 d (10.0) | 4.38 dd (10.0,10.0) |
| 9 | 5.28 d (10.2) | 3.70 d (8.5) | 3.76 d (10.0) | 3.77 d (10.0) | 5.54 d (10.5) | |
| 10 | 3.15 m | 2.24 o | 2.06 m | 2.09 m | 2.11 m | |
| 13a | 6.34 d (2.4) | 6.35 d (3.0) | 6.33 d (3.0) | 6.32 d (3.0) | 6.34 d (3.0) | 6.11 d (3.5) |
| 13b | 6.14 d (2.4) | 5.72 d (3.0) | 5.66 d (3.0) | 5.70 d (3.0) | 5.70 d (3.0) | 6.05 d (3.5) |
| 14 | 1.14 d (7.2) | 1.00 d (6.6) | 1.11 d (6.0) | 1.11 d (6.5) | 1.12 d (6.5) | 1.20 s |
| 15 | 1.16 s | 1.25 s | 1.22 s | 1.22 s | 1.25 s | 1.04 d (6.5) |
| 2′ | 2.68 m | 2.72 m | 2.69 m | 2.68 m | ||
| 3′ | 1.20 d (7.2) | 1.26 d (6.6) | 1.22 d (6.0) | 1.22 d (6.0) | 6.08 qq (7.0,1.5) | |
| 4′ | 1.18 d (7.2) | 1.25 d (6.6) | 1.23 d (6.0) | 1.23 d (6.0) | 1.97 q (1.5) | |
| 5′ | 1.96 dq (7.0,1.5) | |||||
| 2′′ | 2.16 m | 2.61 m | ||||
| 3′′ | 6.08 dq (2.4,1.2), | |||||
| 5.67 dq (2.4,1.2) | 6.17 qq (7.2,1.8) | 1.98 m | 6.09 qq (7.0,1.5) | 6.17 qq (7.0,1.5) | 1.20 d (5.5) | |
| 4′′ | 1.90 br s | 1.97 dq (1.8,1.2) | 0.89 d (5.0) | 1.79 q (1.5) | 1.80 q (1.5) | 1.19 d (6.0) |
| 5′′ | 2.01 dq (7.2,1.8) | 0.90 d (5.0) | 1.90 dq (7.0,1.5) | 1.97 dq (7.0,1.5) | ||
| No. | 2a | 3a | 4b | 5b | 6b | 7b |
|---|---|---|---|---|---|---|
| a Measured at 150 MHz in methanol-d4.b Measured at 125 MHz in methanol-d4. | ||||||
| 1 | 34.1 | 25.5 | 24.1 | 24.5 | 24.1 | 46.3 |
| 2 | 24.2 | 32.8 | 34.8 | 35.2 | 34.9 | 70.9 |
| 3 | 37.5 | 217.6 | 217.5 | 217.5 | 217.8 | 38.7 |
| 4 | 73.7 | 80.4 | 80.2 | 80.2 | 80.3 | 35.5 |
| 5 | 79.1 | 78.1 | 78.1 | 78.1 | 78.0 | 106.5 |
| 6 | 73.5 | 80.0 | 79.8 | 79.9 | 79.9 | 68.1 |
| 7 | 45.4 | 41.6 | 40.1 | 40.2 | 40.2 | 49.4 |
| 8 | 83.4 | 70.5 | 76.0 | 76.2 | 76.2 | 77.3 |
| 9 | 211.3 | 78.5 | 75.1 | 75.3 | 75.3 | 79.6 |
| 10 | 44.0 | 30.0 | 30.7 | 30.9 | 30.9 | 71.9 |
| 11 | 137.3 | 132.7 | 132.6 | 133.0 | 133.1 | 139.0 |
| 12 | 171.3 | 169.6 | 169.2 | 169.2 | 169.3 | 169.9 |
| 13 | 125.1 | 123.9 | 124.6 | 124.6 | 124.6 | 119.4 |
| 14 | 20.4 | 20.0 | 19.8 | 19.8 | 20.2 | 23.2 |
| 15 | 24.2 | 23.3 | 23.1 | 23.1 | 23.5 | 12.0 |
| 1′ | 179.0 | 176.4 | 176.4 | 176.4 | 167.1 | |
| 2′ | 35.0 | 34.0 | 33.9 | 34.0 | 127.4 | |
| 3′ | 19.2 | 18.0 | 18.0 | 18.0 | 138.2 | |
| 4′ | 19.2 | 17.9 | 17.9 | 17.9 | 19.2 | |
| 5′ | 14.6 | |||||
| 1′′ | 167.0 | 167.7 | 172.9 | 167.4 | 167.5 | 176.1 |
| 2′′ | 136.7 | 127.8 | 42.9 | 127.3 | 127.4 | 34.0 |
| 3′′ | 127.4 | 137.7 | 25.8 | 138.2 | 138.4 | 17.9 |
| 4′′ | 18.1 | 19.4 | 21.6 | 19.2 | 19.3 | 17.9 |
| 5′′ | 14.6 | 21.7 | 14.6 | 14.6 | ||
The relative configuration of 2 was determined by analysis of NOESY data. The key NOE correlations of H-8/H-7, H-7/H-5, H-7/H-10, H-8/H3-14, and H-5/H3-15 indicated that 2 had the same relative configuration as 1 (Fig. 5). The CD spectrum (see ESI Fig. C1†) of 2 exhibited two positive Cotton effects at near 254 nm (α-methylene-γ-lactone region) and 294 nm (ketone n, π* region), which closely resembled those of 1, supporting 6S,7S configuration.25 Similar NOESY and CD data of 2 and 1 assigned the absolute configuration of 2 as 4S,5R,6S,7S,8S, and 10R. Thus, the structure of compound 2 was determined as shown, named 8-isodivarolide C.
The molecular formula of compound 3 was assigned as C24H34O9 by positive-ion HRESIMS ion at m/z 489.2101 [M + Na]. The 1H and 13C NMR data implied that the structure of 3 was similar to those of the known compound incaspitolide D,27 except that the angeloyloxy group at C-9 in 3 was observed in place of an isobutyryloxy group in incaspitolide D, which was further confirmed by the 1H–1H COSY, HSQC, and HMBC spectra (Fig. 4). The relative configuration of 3 was determined by analysis of ROESY data. The key NOE correlations of H-8/H-6, H-7/H-5, H-5/H3-15, H-7/H-9, and H-9/H-10 indicated that 3 had the same relative configuration as incaspitolide D (Fig. 5). The CD spectrum (see ESI Fig. C2†) of 3 exhibited two negative Cotton effects at near 220 nm (α-methylene-γ-lactone region) and 310 nm (ketone n, π* region), which closely resembled those of incaspitolide D, supporting 7R configuration.19,29,30 Fortunately, a suitable crystal was obtained for X-ray diffraction to confirm the absolute configuration. The X-ray crystallographic analysis [flack parameter: −0.07 (9)] established unambiguously the absolute configuration of 1 to be 4R,5R,6S,7R,8R,9R, and 10R (Fig. 6). Thus, the structure of compound 3 was established as shown, named cardivarolide H.
Compound 4 possessed molecular formula of C24H36O9 based on the HRESIMS ion at m/z 491.2249 [M + Na]+. A comparison of the 1H and 13C NMR data of 4 with those of 3 revealed strong similarity, except that the angeloyloxy group and the hydroxyl group in 3 were substituted by a hydroxyl group at C-9 and a 3-methylbutyryloxy group at C-8 in 4, respectively. The 1H–1H COSY, HSQC and HMBC spectra of 4 confirmed this observation, leading to the assignment of its planar structure. Compound 4 had the same relative configuration as 3, according to the analysis of their ROESY data. Similar CD data of 4 and 3 (see ESI Fig. C2†) revealed the same absolute configuration of 4 as that of 3. Thus, the structure of compound 4 was defined as shown, named cardivarolide I.
Compounds 5–6 had molecular formulas of C24H34O9, and C25H34O9 from their HRESIMS ions at m/z 489.2107 [M + Na]+, and m/z 501.2103 [M + Na]+, respectively. The 1H and 13C NMR data of 5 were similar to those of 4, except that the 3-methylbutyryloxy group at C-8 in 4 was replaced by an angeloyloxy group in 5. The NMR data of 6 were comparable with those of 5, except for the presence of an angeloyloxy group in 6 instead of the isobutyryloxy group at C-5 in 5. These observations were confirmed by analyses of relevant 1H–1H COSY, HSQC and HMBC data. The relative configurations of 5–6 were determined to be the same as that of 4 by comparison of ROESY data for relevant protons. Similar CD data of 5–6 and 4 (see ESI Fig. C2†) revealed the same absolute configurations of 5–6 as that of 4. Thus, the structures of compounds 5–6 were established as shown, named cardivarolide J and cardivarolide K, respectively.
The molecular formula of compound 7 was determined to be C19H26O7 by HRESIMS (389.1575 [M + Na]+). The 1H and 13C NMR data of 7 implied that the planar structure of 7 was closely related to the known compound (2R,5S)-cardivarolide C,14,27 but that the residue at C-6 was a hydroxy group in 7. The assignments were also supported by 1H–1H COSY, HSQC and HMBC spectra (Fig. 4). The relative configuration of 7 was nearly identical with those of (2R,5S)-cardivarolide C, except for C-10. In the NOESY spectrum, the key NOE correlations of H-2/H-4, H3-15/H-6, H-6/H-8, H-8/H3-14, and H-7/H-9 indicated 5-OH, H-7 and H-9 were attached to the β-side and H3-15, H-6, H-8 and H3-14 to the α-side of the ring (Fig. 5). The CD spectrum of 7 exhibited one positive Cotton effects at near 254 nm (α-methylene-γ-lactone region, see ESI Fig. S7†), which closely resembled those of ineupatolide,19 suggesting the 2R,4R,5S,6R,7S,8S,9R, and 10R absolute configuration for 7. Thus, the structure of 7 was elucidated as shown, named cardivarolide L.
 | ||
| Fig. 4 Key 1H–1H COSY and HMBC correlations of compounds 2, 3 and 7. | ||
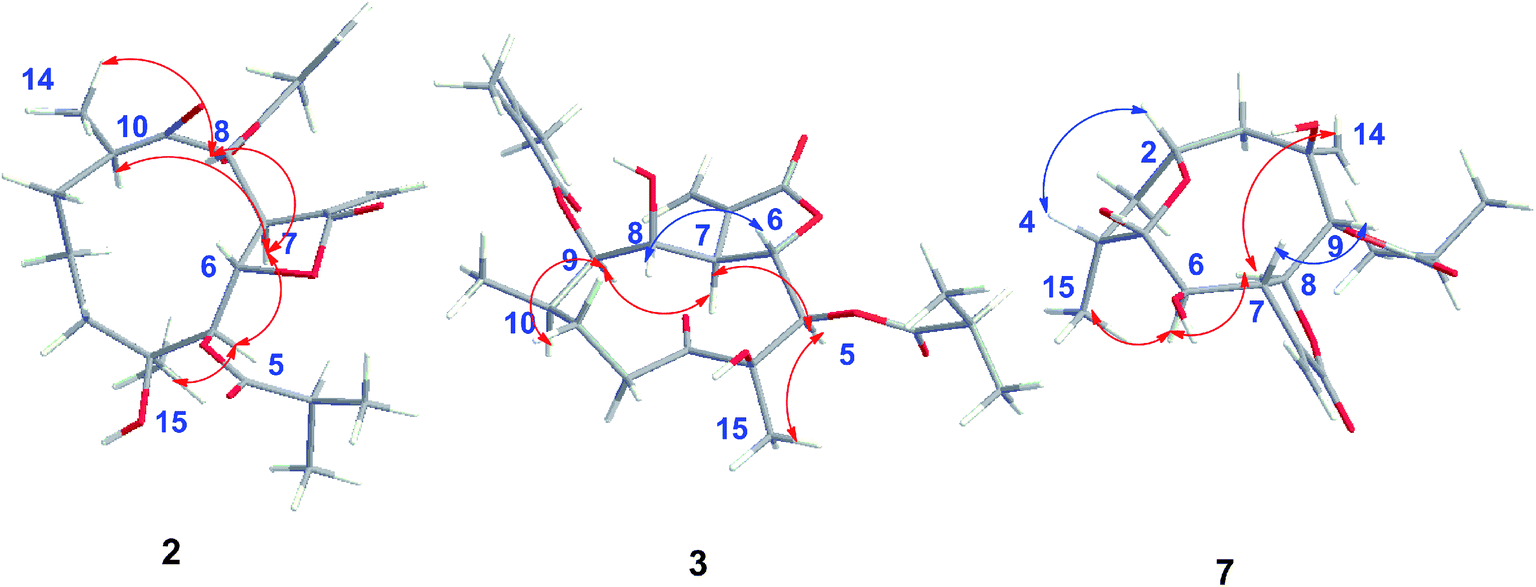 | ||
| Fig. 5 Key NOESY correlations of compounds 2, 3 and 7. | ||
 | ||
| Fig. 6 X-ray ORTEP drawing of 3. | ||
Cytotoxicity
All isolated compounds were evaluated for their in vitro cytotoxic activities against human cervical cancer (HeLa), hepatocellular cancer (Hep G2), and lung cancer (A549), using the MTT method with vorinostat as the positive control. The data in Table 3 suggested that new compounds 3 and 5 exhibited cytotoxicity against HeLa (IC50 values of 4.13 and 5.08 μM) and Hep G2 (IC50 values of 5.93 and 8.37 μM) cell lines compared to the positive control vorinostat (IC50 values of 10.90 and 8.82 μM), respectively. Considering the amounts of isolated compounds, we chose 3 for further research.| Compound | IC50 (μM) | ||
|---|---|---|---|
| HeLa | Hep G2 | A549 | |
| a Values were mean ± SD. Vorinostat, positive control. Cell lines: HeLa: human cervical cancer, Hep G2: human hepatocellular cancer, A549: human lung cancer. | |||
| 1 | 9.05 ± 0.80 | 14.03 ± 0.75 | >50 |
| 2 | >50 | >50 | >50 |
| 3 | 4.13 ± 0.75 | 5.93 ± 0.49 | 28.96 ± 1.01 |
| 4 | 6.18 ± 0.04 | 8.99 ± 1.45 | 42.73 ± 1.34 |
| 5 | 5.88 ± 0.05 | 10.66 ± 1.02 | 39.87 ± 1.17 |
| 6 | 5.08 ± 0.02 | 8.37 ± 0.22 | 23.67 ± 0.81 |
| 7 | >50 | >50 | >50 |
| Vorinostat | 10.90 ± 3.00 | 8.82 ± 0.71 | 10.65 ± 0.46 |
Morphological evaluation of apoptosis
As shown in Fig. 7, untreated Hep G2 cells exhibited normal growth characteristics (Fig. 7A). Interestingly, we found alterations in the structure, size, and shape of the nuclei in Hep G2 cells treated with 2.0 μM 3 for 48 h (Fig. 7B), with large cytoplasmic vacuoles, abnormal mitotic figures, multinucleation and formation of large cells being typical (Fig. 7C and D). These hallmarks of cell death, which increased concomitantly with increasing drug concentration, are indicated by red arrows. | ||
| Fig. 7 Chromatin condensation and nuclear fragmentation typical for apoptosis induction were visualized by fluorescence microscopy following Hoechst 33342 staining; (A) control Hep G2 cells; (B) Hep G2 cells treated with 2 μM 3; (C) Hep G2 cells treated with 4 μM 3; (D) Hep G2 cells treated with 8 μM 3. Magnification 400×. | ||
Cardivarolide H (3) induces apoptosis in Hep G2 cells
In order to characterize the apoptosis process of Hep G2 cells induced by cardivarolide H (3), we examined the numbers of apoptotic cells by Annexin V-FITC/PI apoptosis staining. After 24 h exposure to different concentrations of 3, the numbers of apoptotic cells (AV+/PIand AV+/PI+) increased in a dose-dependent manner (Fig. 8). These results demonstrated that 3 was effective in the induction of apoptosis in Hep G2 cells. | ||
| Fig. 8 Cardivarolide H (3) induces apoptosis in Hep G2 cells. (A) Control Hep G2 cells; (B) Hep G2 cells treated with 2 μM 3; (C) Hep G2 cells treated with 4 μM 3; (D) Hep G2 cells treated with 8 μM 3. | ||
Cardivarolide H (3) increases G0/G1 arrest of cell cycle in Hep G2 cells
Hep G2 cells were treated with different concentrations of cardivarolide H (3) for 24 h, followed by flow cytometry analyses and the cardivarolide H-treated group revealed G0/G1 phase arrest compared with control group (Fig. 9). Fig. 9 revealed the numbers of cells arrested in G0/G1 phase. These results indicated that growth inhibition of 3 in Hep G2 cells were partly associated with the induction of G0/G1 arrest in cell cycle. | ||
| Fig. 9 Effects of cardivarolide H (3) on cell cycle distribution in Hep G2 cells. (A) Control Hep G2 cells; (B) Hep G2 cells treated with 2 μM 3; (C) Hep G2 cells treated with 4 μM 3; (D) Hep G2 cells treated with 8 μM 3. | ||
Experimental section
General experimental procedures
Optical rotations were measured on a Perkin-Elmer 241 polarimeter (Perkin-Elmer, Waltham, MA, USA) and UV spectra were recorded on Shimadzu UV-2501 PC (Shimadzu, Kyoto, Japan). IR data were recorded using a Shimadzu FTIR-8400S spectrophotometer (Shimadzu, Kyoto, Japan). 1H and 13C-NMR data were acquired with Bruker 600 and Bruker 500 instruments (Bruker, Rheinstetten, Germany) using the solvent signals as references. HRESIMS data were acquired using Q-TOF analyzer in SYNAPT HDMS system (Waters, Milford, MA, USA). CD spectra were recorded on a JASCO J-815 Spectropolarimeter (Jasco, Tokyo, Japan). X-ray diffraction data were collected on the Agilent GEMINI™E instrument (CrysAlisPro software, Version 1.171.35.11; Agilent, Santa Clara, CA, USA). HPLC was performed using Waters 2535 system (Waters, Milford, MA, USA) with the following components: preparative column, a Daisogel-C18-100A (10 μm, 30 × 250 mm, Chuang Xin Tong Heng Sci. &Tech., Beijing, China) and a YMC-Pack ODS-A column (5 μm, 10 × 250 mm, YMC, Kyoto, Japan); and detector, Waters 2489 UV. Sephadex LH-20 (40–70 μm, Pharmacia Biotech AB, Uppsala, Sweden), silica gel (60–100, 100–200, and 200–300 mesh) and silica gel GF254 sheets (0.20–0.25 mm) (Qingdao Marine Chemical Plant, Qingdao, China) were used for column chromatography and TLC, respectively. TLC spots were visualized under UV light and by dipping into 5% H2SO4 in EtOH followed by heating.Plant material
The whole plant of C. divaricatum was collected from Enshi, Hubei province of China, in August of 2013. They were identified by Prof. Ben-Gang Zhang of Institute of Medicinal Plant Development. A voucher specimen (no. 20130828) was deposited in the National Compound Library of Traditional Chinese Medicines, Institute of Medicinal Plant Development, Chinese Academy of Medical Sciences and Peking Union Medical College (CAMS & PUMC), China.Extraction and isolation
The air-dried plants (9 kg) were extracted three times (7 days each time) with EtOH–H2O (95![[thin space (1/6-em)]](https://www.rsc.org/images/entities/char_2009.gif) :5) at room temperature. The combined extract was concentrated under reduced pressure to furnish a dark brown residue (570 g), which was suspended in H2O and partitioned in turn with petroleum ether (bp 60–90 °C), EtOAc, and n-BuOH.
:5) at room temperature. The combined extract was concentrated under reduced pressure to furnish a dark brown residue (570 g), which was suspended in H2O and partitioned in turn with petroleum ether (bp 60–90 °C), EtOAc, and n-BuOH.
The EtOAc extract (207 g) was separated chromatographically on silica gel column (60–100 mesh, 16 × 20 cm) with a gradient mixture of CH2Cl2–MeOH (100:1, 60:1, 30:1, 15:1, and 6:1) as eluent. Five fractions were collected according to TLC analysis. Fraction A (CH2Cl2–MeOH, 100:1, 140 g) was separated by silica gel column chromatography (CC) (100–200 mesh, 16 × 20 cm) with petroleum ether–acetone (50:1, 25:1, 20:1, 15:1, 12:1, 10:1, 7:1, 5:1, 3:1, and 1:1) as eluent to give fractions A1–A11. Fraction A9 (petroleum ether–acetone, 5:1, 30 g) was separated by Sephadex LH-20 CC (5 × 200 cm, MeOH) to give Fr.A9S1–Fr.A9S3. Fraction A9S2 (20 g) was then subjected to MCI gel CC (6 × 50 cm) with a gradient mixture of MeOH–H2O (60:40, 80:20, and 100:0, 4000 mL each) to give three fractions (Fr.A9S2M1–Fr.A9S2M3). Fraction A9S2M2 (10 g) was further separated chromatographically on silica gel column (100–200 mesh, 5 × 50 cm) with a gradient mixture of petroleum ether–acetone (10:1, 7:1, 5:1, 3.5:1, 2:1, and 1:1) as eluent, and a total of 200 fractions (Fr.A9S2M2-1–200, 50 mL each) were collected. Fraction A9S2M2-113–123 (1 g) were separated by preparative HPLC (20 mL min−1, 65% MeOH in H2O) and semipreparative HPLC (2 mL min−1, 60–90% MeOH in H2O for 50 min; 2 mL min−1, 40–80% MeCN in H2O for 40 min) to yield 3 (25 mg). Fraction A10 (petroleum ether–acetone, 3:1, 40 g) was separated by Sephadex LH-20 CC (5 × 200 cm, MeOH) to give Fr.A10S1–Fr.A10S3. Fraction A10S2 (20 g) was then subjected to MCI gel CC (6 × 50 cm) with a gradient mixture of MeOH–H2O (60:40, 80:20, and 100:0, 4000 mL each) to give three fractions (Fr.A10S2M1–Fr.A10S2M3). Fraction A10S2M2 (13 g) was further separated chromatographically on silica gel column (200–300 mesh, 5 × 50 cm) with a gradient mixture of CH2Cl2–MeOH (150:1, 100:1, 50:1, and 20:1) as eluent, and a total of 86 fractions (Fr.A10S2M2-1–86, 200 mL each) were collected. Fraction A10S2M2-34–50 (1.5 g) were separated by preparative HPLC (20 mL min−1, 70% MeOH in H2O) and semipreparative HPLC (2 mL min−1, 60–90% MeOH in H2O for 40 min, and followed 40–80% MeCN in H2O for 40 min) to yield 7 (5 mg).
The petroleum ether extract (140 g) was separated chromatographically on silica gel column (60–100 mesh, 16 × 20 cm) with a gradient mixture of petroleum ether–ethyl acetate (100:1, 60:1, 30:1, 15:1, 6:1, and 3:1) as eluent. Nine fractions were collected according to TLC analysis. Fraction PE-F (petroleum ether–ethyl acetate, 6:1, 16 g) was then subjected to MCI gel CC (6 × 50 cm) with a gradient mixture of MeOH–H2O (60:40, 80:20, and 100:0, 4000 mL each) to give three fractions (Fr.PE-F1–Fr. PE-F3). Fraction PE-F2 (10 g) was further separated chromatographically on silica gel column (100–200 mesh, 5 × 50 cm) with a gradient mixture of petroleum ether–acetone (100:1, 25:1, 10:1, and 2:1) as eluent, and a total of 4 fractions (Fr.PE-F2A1–Fr.PE-F2A4, 3000 mL each) were collected. Fraction Fr.PE-F2A2 (3 g) were separated by preparative HPLC (20 mL min−1, 80% MeOH in H2O) and semipreparative HPLC (2 mL min−1, 70–90% MeOH in H2O for 30 min, and followed 40–80% MeCN in H2O for 40 min) to yield 1 (35 mg), 2 (5 mg), 4 (5 mg), 5 (5 mg), and 6 (5 mg).
Characterization of new compounds
ε): 206 (3.72) nm, IR (neat) νmax: 3414, 2971, 1748, 1203 cm−1; CD (MeOH) 214 (Δε −0.529), 295 (Δε +0.251) nm; HRESIMS (pos.): m/z 459.1992 [M + Na]+ (calcd for C23H32O8Na, 459.1995); 1H NMR data, see Table 1, 13C NMR data, see Table 2.ε): 215 (3.97) nm, IR (neat) νmax: 3430, 2968, 2921, 1653, 1636 cm−1; CD (MeOH) 215 (Δε −0.083), 308 (Δε −0.013) nm; HRESIMS (pos.): m/z 489.2101 [M + Na]+ (calcd for C24H34O9Na, 489.2101); 1H NMR data, see Table 1, 13C NMR data, see Table 2.ε): 207 (4.18) nm, IR (neat) νmax: 3454, 2965, 1741, 1154 cm−1; CD (MeOH) 215 (Δε −0.193), 307 (Δε −0.035) nm; HRESIMS (pos.): m/z 491.2249 [M + Na]+ (calcd for C24H36O9Na, 491.2257); 1H NMR data, see Table 1, 13C NMR data, see Table 2.ε): 214 (5.12) nm, IR (neat) νmax: 3464, 1749, 1157 cm−1; CD (MeOH) 215 (Δε −0.187), 308 (Δε −0.028) nm; HRESIMS (pos.): m/z 489.2101 [M + Na]+ (calcd for C24H34O9Na, 489.2107); 1H NMR data, see Table 1, 13C NMR data, see Table 2.ε): 216 (5.53) nm, IR (neat) νmax: 3475, 2971, 1717, 1142 cm−1; CD (MeOH) 219 (Δε −0.183), 308 (Δε −0.024) nm; HRESIMS (pos.): m/z 501.2101 [M + Na]+ (calcd for C25H34O9Na, 501.2103); 1H NMR data, see Table 1, 13C NMR data, see Table 2.ε): 200 (3.53) nm, IR (neat) νmax: 3438, 3390, 1636 cm−1; CD (MeOH) 208 (Δε +0.083), 232 (Δε −0.012) nm; HRESIMS (pos.): m/z 389.1575 [M + Na]+ (calcd for C19H26O7Na, 389.1576); 1H NMR data, see Table 1, 13C NMR data, see Table 2.X-ray crystal structure analysis
X-ray diffraction data were collected on the Agilent GEMINI™E instrument (CrysAlisPro software, Version 1.171.35.11), with enhanced Cu Kα radiation (λ = 1.54184 Å). The structure was solved by direct methods and refined by full-matrix least-squares techniques (SHELXL-97). All non-hydrogen atoms were refined with anisotropic thermal parameters. Hydrogen atoms were located by geometrical calculations and from positions in the electron density maps. Crystallographic data (excluding structure factors) for 1 and 3 in this paper have been deposited with the Cambridge Crystallographic Data Centre (deposition numbers CCDC 1585969 and 1841157).A colorless orthorhombic crystal (0.25 × 0.14 × 0.13 mm) of 1 was grown from MeOH–CH2Cl2 (7:3). Crystal data: C23H34O8, M = 438.50, T = 104.4 K, orthorhombic, space group P212121, a = 5.61656 (10) Å, b = 18.3134 (3) Å, c = 22.9609 (6) Å, α = 90.00°, β = 90.00°, γ = 90.00°, V = 2361.72 (2) Å3, Z = 4, ρ = 1.233 mg mm−3, μ(Cu Kα) = 0.766 mm−1, measured reflections = 7993, unique reflections = 4456 (Rint = 0.0275), largest difference peak/hole = 0.222/−0.226 e Å−3, and flack parameter = 0.06 (11). The final R indexes [I > 2σ(I)] were R1 = 0.0384, and wR2 = 0.0973. The final R indexes (all data) were R1 = 0.0407, and wR2 = 0.1000. The goodness of fit on F2 was 1.025.
A colorless orthorhombic crystal (0.4 × 0.36 × 0.11 mm) of 3 was grown from CD3OD. Crystal data: C24H34O9, M = 466.51, T = 109.45 K, orthorhombic, space group P212121, a = 9.8307 (12) Å, b = 17.7908 (13) Å, c = 27.106 (2) Å, α = 90.00°, β = 90.00°, γ = 90.00°, V = 4740.8 (8) Å3, Z = 8, ρ = 1.307 mg mm−3, μ(Cu Kα) = 0.830 mm−1, measured reflections = 18022, unique reflections = 8922 (Rint = 0.0306), largest difference peak/hole = 0.488/−0.371 e Å−3, and flack parameter = −0.07 (9). The final R indexes [I > 2σ(I)] were R1 = 0.0459, and wR2 = 0.1181. The final R indexes (all data) were R1 = 0.0494, and wR2 = 0.1213. The goodness of fit on F2 was 1.037.
Reagents and antibodies
3-(4,5-Dimethylthiazol-2-yl)-2,5-diphenyltetrazolium bromide (MTT), RNase A, propidium iodide (PI) were purchased from Sigma-Aldrich (MO, USA). Dulbecco's Modified Eagle's Medium (DMEM), RPMI 1640 medium, trypsin, penicillin, streptomycin, fetal bovine serum (FBS) were purchased from Gibco (CA, USA).The Annexin V-FITC apoptosis detection kit was obtained from Solarbio (Beijing, China).
Cytotoxicity viability assays
The assay was run in triplicate. The HeLa, Hep G2 and A549 cell lines were obtained from the National Infrastructure of Cell Line Resource (Beijing, China). Cells were cultured in RPMI-1640 containing 10% FBS, 2 mmol per L glutamine, 100 U per mL penicillin, and 100 μg per mL streptomycin at 37 °C in a humidified atmosphere with 5% CO2. The cells were seeded at a density of 5 × 10³ cells per well in 96-well plates and allowed to attach for 24 h. The thiazolyl blue tetrazolium blue (MTT) assay was performed to quantify cell viability following treatment with the isolated compounds or reference compound vorinostat.31 After 48 h, 20 mL MTT (5 mg mL−1) solution was added for 4 h at 37 °C. Then, the supernatant was discarded and dimethylsulfoxide (DMSO) was added to dissolve the formazan product. The intensity was measured at a wavelength of 540 nm.Morphological analysis with fluorescence microscopy
Apoptosis is one of the major pathways leading to cell death, and is associated with classical morphologies, including chromatin condensation and nuclear fragmentation. To evaluate the apoptotic activity of 3, we performed nuclear staining with the DNA-binding dye, Hoechst-33342. Briefly, K562/A02 cells were plated into 6-well plates (1 × 10⁵ cells in 3 mL) and treated with 0, 2.0, 4.0 or 6.0 μM of 3 for 48 h. Cells were collected by centrifugation at 1000 × g for 5 min, washed with ice-cold PBS and then incubated with Hoechst-33342 (10 μg mL−1) for 15 min in the dark, then placed on slides, and observed under a fluorescence microscope (excitation 346 nm, emission 460 nm; NIKON TE2000-E). Apoptotic cells were identified by condensation of chromatin and fragmentation of nuclei. Pictures were obtained using a video camera Q-imaging (Burnaby, BC, Canada).Apoptosis analysis
Cardivarolide H (3) induced apoptosis in Hep G2 cells were detected using Annexin V-FITC/PI apoptosis staining by flow cytometry. Cells were plated and treated with 3 (0, 2, 4, 8 μM) for 24 h. After harvested and washed twice with cold PBS, the cells were incubated with Annexin V in binding buffer for 10 min at room temperature in the dark, followed by PI for 5 min. Stained cells were detected and analyzed using FACS Calibur flow cytometry (Becton Dickinson, USA). Apoptotic rates were reported as the percentage of apoptotic cells among total cells.Cell cycle analysis
Cell cycle distribution was measured by staining DNA with PI. Cells (1 × 10⁶) were seeded in 6-well plates and treated with 3 (0, 2, 4, 8 μM) for 24 h. Then cells were harvested and fixed with 70% ethanol at −20 °C overnight. After washing twice with PBS, the cells were treated with RNase A for 20 min and then stained with PI (50 mg L−1) for 10 min in the dark at room temperature.32 The distribution of each phase in the cell cycle measured by DNA content was detected using FACS Calibur flow cytometry and analyzed by ModFit LT 4.0 software.Conclusion
In this work, six new highly oxygenated germacranolides (2–7), as well as one known analog (1) were isolated from the whole plant of C. divaricatum. Notably, a pair of isomers (3/5) was obtained from the same plant. The absolute configurations of 1 and 3 were unambiguously established by X-ray diffraction. The other compounds with the same skeleton were determined by comparison of NOESY and CD data with those of 1 and 3, respectively. To the best of our knowledge, it was the first report of the substituted groups linkage to C-8 of subtype IV, and 7 is the first 14α-methylgermacranolide of subtypes I and II. These findings are an important addition to the present knowledge on the germacranolide family. After screening, we found 3 and 6 showed significant cytotoxicity against two tumor cell lines, respectively. Further studies indicate that the possible mechanism of 3, was associated with reduced proliferation, induction of apoptosis and G0/G1 phase arrest, as revealed by colorimetric tests, morphological analysis, and flow cytometry. Therefore, novel compound 3 could be treated as a potential candidate for anticancer agents for further study.Conflicts of interest
The authors declare no conflict of interest.Acknowledgements
This work was financially supported by the Natural Sciences Foundation of Beijing (7194297), the CAMS Innovation Fund for Medical Sciences (CIFMS, 2016-I2M-1-010 and 2016-I2M-2-003), and the Chinese National S&T Special Project on Major New Drug Innovation (2017ZX09301059).Notes and references
- J. Wang, Y. S. Zhang, K. Thakur, S. S. Hussian, J. G. Zhang, G. R. Xiao and Z. J. Wei, Food Chem. Toxicol., 2018, 120, 407–417 CrossRef CAS PubMed.
- M. F. Yuen, J. L. Hou and A. Chutaputti, Asia Pacific Working Party on Prevention of Hepatocellular Carcinoma, J. Gastroenterol. Hepatol., 2009, 24, 346–353 CrossRef PubMed.
- J. Fu and H. Y. Wang, Cancer Lett., 2018, 412, 283–288 CrossRef CAS PubMed.
- H. Cui, Q. Q. Gao, L. Zhang, F. Feng and L. Wang, Life Sci., 2018, 213, 66–73 CrossRef CAS PubMed.
- D. J. Mabberley, Mabberley's Plant Book, Cambridge University Press, Cambridge, 3rd edn, 2008, p. 154 Search PubMed.
- J. P. Zhang, G. W. Wang, X. H. Tian, Y. X. Yang, Q. X. Liu, L. P. Chen, H. L. Li and W. D. Zhang, J. Ethnopharmacol., 2015, 163, 173–191 CrossRef CAS PubMed.
- Editorial board of Chinese Materia Medica, Chinese Materia Medica, Shanghai Science & Technology Press, Shanghai, 1999, vol. 21, p. 761 Search PubMed.
- E. J. Kim, H. K. Jin, Y. K. Kim, H. Y. Lee, S. Y. Lee, K. R. Lee, O. P. Zee, J. W. Han and H. W. Lee, Biochem. Pharmacol., 2001, 61, 903–910 CrossRef CAS PubMed.
- O. P. Zee, D. K. Kim, S. U. Choi, C. O. Lee and K. R. Lee, Arch. Pharmacal Res., 1999, 22, 225–227 CrossRef CAS.
- O. P. Zee, D. K. Kim and K. R. Lee, Arch. Pharmacal Res., 1998, 21, 618–620 CrossRef CAS.
- I. M. Chung, S. H. Seo, E. Y. Kang, W. H. Park, S. D. Park and H. I. Moon, Phytother. Res., 2010, 24, 451–453 CrossRef CAS PubMed.
- D. K. Kim, N. I. Beak, S. U. Choi, C. O. Lee, K. R. Lee and O. P. Zee, J. Nat. Prod., 1997, 60, 1199–1202 CrossRef CAS PubMed.
- M. Maruyama, Phytochemistry, 1990, 29, 547–550 CrossRef CAS.
- D. K. Kim, K. R. Lee and O. P. Zee, Phytochemistry, 1997, 46, 1245–1247 CrossRef CAS.
- W. D. Xie, X. R. Wang, L. S. Ma, X. Li and K. H. Row, Fitoterapia, 2012, 83, 1351–1355 CrossRef CAS PubMed.
- H. J. Lee, H. Jung, J. Kwon, H. Li, D. Y. Lee, H. J. Lim, M. R. Kim, D. C. Moon and J. H. Ryu, Can. J. Physiol. Pharmacol., 2011, 89, 232–237 CrossRef CAS PubMed.
- H. I. Moon and O. Zee, Rec. Nat. Prod., 2010, 4, 3149–3155 Search PubMed.
- H. I. Moon and O. Zee, Hum. Exp. Toxicol., 2010, 30, 1083–1087 CrossRef PubMed.
- R. N. Baruah, R. P. Sharma and G. Thyagarajan, J. Org. Chem., 1980, 45, 4838–4843 CrossRef CAS.
- N. C. Baruah, R. N. Baruah, R. P. Sharma and J. N. Baruah, J. Org. Chem., 1982, 47, 137–140 CrossRef CAS.
- A. C. Goswami, R. N. Baruah, R. P. Sharma, J. N. Baruah, P. Kulanthaivel and W. Herz, Phytochemistry, 1984, 23, 367–372 CrossRef CAS.
- F. Y. Wang, X. Q. Li, Q. Sun, S. Yao, C. Q. Ke, C. P. Tang, H. C. Liu, M. Y. Geng and Y. Ye, Phytochem. Lett., 2012, 5, 639–642 CrossRef CAS.
- A. G. Gonzalez, J. B. Barrera, J. T. Mendez, J. E. Martinez and M. L. Sanchez, Phytochemistry, 1992, 31, 330–331 CrossRef CAS.
- A. G. Gonzalez and J. Bermejo, J. Nat. Prod., 1995, 58, 432–437 CrossRef CAS.
- X. Gao, C. J. Lin and Z. J. Jia, J. Nat. Prod., 2007, 70, 830–834 CrossRef CAS PubMed.
- Y. L. Lin and J. C. Ou, J. Nat. Prod., 1996, 59, 991–993 CrossRef CAS.
- T. Zhang, J. H. Chen, J. G. Si, G. Ding, Q. B. Zhang, H. W. Zhang, H. M. Jia and Z. M. Zou, Sci. Rep., 2018, 8, 12418 CrossRef PubMed.
- Q. X. Liu, Y. X. Yang, J. P. Zhang, L. P. Chen, Y. H. Shen, H. L. Li and W. D. Zhang, J. Nat. Prod., 2016, 10, 2479–2486 CrossRef PubMed.
- J. W. Wu, C. P. Tang, Y. Y. Cai, C. Q. Ke, L. G. Lin, S. Yao and Y. Ye, Chin. Chem. Lett., 2017, 28, 927–930 CrossRef CAS.
- W. Stochlin, T. G. Waddell and T. A. Geissman, Tetrahedron, 1970, 29, 2397–2409 CrossRef.
- B. J. Wang, S. J. Won, Z. R. Su and C. L. Yu, Food Chem. Toxicol., 2005, 43, 543–552 CrossRef CAS PubMed.
- N. N. Danial, Clin. Cancer Res., 2007, 13, 7254–7263 CrossRef CAS PubMed.
Footnotes |
| † Electronic supplementary information (ESI) available: 1H NMR, 13C NMR, 2D NMR, UV, IR, HRESIMS and CD spectra of compounds 1–7, and X-ray data of compounds 1 and 3. CCDC 1585969 and 1841157. For ESI and crystallographic data in CIF or other electronic format see DOI: 10.1039/c9ra00478e |
| ‡ These authors contributed equally to this study. |
| This journal is © The Royal Society of Chemistry 2019 |