 Open Access Article
A highly sensitive and selective fluorescent probe for quantitative detection of Al3+ in food, water, and living cells†
Qian
Jiang
a,
Mingxin
Li
a,
Jie
Song
b,
Yiqin
Yang
cd,
Xu
Xu
ad,
Haijun
Xu
ad and
Shifa
Wang
 *ad
*ad
aNanjing Forestry University, China
bDepartment of Chemistry and Biochemistry, University of Michigan-Flint, USA
cNanjing Forestry University, College of Chemical Engineering, China
dInstitute of Chemical Engineering, Nanjing Forestry University, China
First published on 3rd April 2019
Abstract
Three novel β-pinene-based fluorescent probes 2a–2c were designed and synthesized for the selective detection of Al3+. Probe 2a showed higher fluorescence intensity toward Al3+ than the other two compounds. Probe 2a determined the concentration of Al3+ with a rapid response time (45 s), wide pH range (pH = 1–9), excellent sensitivity (LOD = 8.1 × 10⁻⁸ M) and good selectivity. The recognition mechanism of probe 2a toward Al3+ was confirmed by 1H NMR, HRMS and DFT analysis. Probe 2a was successfully used as a signal tool to quantitatively detect Al3+ in food samples and environmental water samples. Furthermore, probe 2a was successfully utilized to label intracellular Al3+, indicating its promising applications in living cells.
1. Introduction
As the third most abundant element and the most widely used metal ion on Earth, aluminum is extensively used in a variety of fields, but is harmful to the environment and living systems.1–4 The increasing concentration of Al3+ in pollutants can deeply influence the growth of plants, and lead to soil acidification5,6 and underground water contamination.7 Moreover, the accumulation of Al3+ in the body can greatly affect the absorption of calcium in bone tissue and induce several diseases such as Alzheimer's, Parkinson's epilepsy, seizures, and renal and liver damage.8–11 In 1989, the World Health Organization (WHO) and the United Nations Food and Agriculture Organization (UNFAO) identified Al3+ as a food pollutant to be controlled. In 2011, WHO/UNFAO revised the weekly allowable intake of Al3+ from 7 mg kg−1 to 2 mg kg−1.12 Therefore, it is significant to detect and control the Al3+ concentration in water and food samples.Compared to traditional detection methods, a fluorescent probe has become one of the most widely used tools for detecting metal ions.13–15 In the past few years, many fluorescent probes for Al3+ detection have been reported.16–25 However, there are still some shortcomings in reported Al3+ fluorescent probes, including a complex synthesis process, poor selectivity and sensitivity, easy interference by other metal ions, Zn2+, Cu2+, Cr3+, Hg2+, and even F−,26–30 and lack of applicability to water samples and food samples.31–35 Therefore, developing a fluorescence probe with high sensitivity, good selectivity, rapid response and low toxicity for detecting Al3+ is particularly meaningful.
Nopinone is obtained by the oxidation of β-pinene, which is a primary ingredient in natural turpentine. It is often used in the production of medicine and perfume. In addition, the rigid structure of the nopinone molecule can reduce the energy loss of non-radiative transitions in the fluorescence emission process. Furthermore, molecules with a nopinone skeleton structure have good biological compatibility and low cytotoxicity.36 Thus, the development of novel fluorescence probes from nopinone is very promising.
In this paper, we synthesized three new indazole derivatives for the specific detection of Al3+, using natural nopinone as the starting material. Probes 2a–2c could be synthesized by a simple two-step reaction and displayed a rapid ratiometric fluorescence toward Al3+ in aqueous solution (pH = 7.4). In addition, probe 2a had a high selectivity for Al3+ over other metal ions and a rapid response time. The detection limit of probe 2a was found to be 8.1 × 10⁻⁸ M, which is lower than that of many reported Al3+ fluorescence probes. The 1H NMR, HRMS and theoretical calculations showed the detection mechanism. Furthermore, probe 2a was successfully proved for the quantitative detection of Al3+ in food and environmental water samples. More importantly, cell experiments also demonstrated that probe 2a could be used as a signal tool to detect the concentration of Al3+ in living cells.
2. Experimental
2.1. General information
All reagents and solvents were of analytical grade and bought from commercial sources. UV-Vis absorption spectra were recorded by a PerkinElmer Lambda 950. PL emission spectra were tested using PerkinElmer LS55. The 1H NMR and 13C NMR spectra were recorded in CDCl3 solutions on a Bruker AV 400 spectrometer. The purity of the synthesized compounds was recorded by America Agilent 1260 Infinity liquid chromatography. All pH measurements were recorded using a Sartorius Basic pH-Meter PB-20. High-resolution mass spectra (HRMS) were tested by an America Agilent 5975c mass spectrometer. Melting points were recorded using an X-6 microscopic melting point apparatus. All measurements were performed at room temperature. The 5.0 × 10⁻⁵ M solutions of various metal ions (Ag+, Hg2+, Na+, Mg2+, K+, Ca2+, Fe2+, Fe3+, Co2+, Ni2+, Cu2+, Zn2+, Ba2+, Sn2+, Pb2+, Cr2+, Pb2+, Bi3+ and Al3+) were prepared in deionized water from their nitrate, chloride or sulfate, and stored at room temperature.2.2. Synthesis
![[thin space (1/6-em)]](https://www.rsc.org/images/entities/char_2009.gif) :
:![[thin space (1/6-em)]](https://www.rsc.org/images/entities/char_2009.gif) EA = 10
EA = 10![[thin space (1/6-em)]](https://www.rsc.org/images/entities/char_2009.gif) :
:![[thin space (1/6-em)]](https://www.rsc.org/images/entities/char_2009.gif) 1, v/v) to obtain compounds 1a–1c.
1, v/v) to obtain compounds 1a–1c.
Compound 1a was a pale yellow grease, yield: 71.3%; 1H NMR (400 MHz, CDCl3) δ: 15.58 (s, 1H), 8.68 (dd, J = 4.9, 1.7 Hz, 1H), 8.00 (d, J = 8.0 Hz, 1H), 7.88–7.72 (m, 1H), 7.35–7.30 (m, 1H), 3.28–2.95 (m, 2H), 2.59 (dt, J = 22.5, 5.4 Hz, 2H), 2.32 (qt, J = 5.9, 2.6 Hz, 1H), 1.49 (d, J = 9.9 Hz, 1H), 1.35 (s, 3H), 0.96 (s, 3H); 13C NMR (100 MHz, DMSO) δ: 153.35, 148.51, 137.18, 127.72, 124.90, 123.41, 121.44, 105.43, 57.40, 54.31, 48.29, 28.34, 27.26, 25.41, 21.18; HRMS (m/z): [M + H]+ calculated for C15H17NO2 + H+, 244.1341; found, 244.1335.
Compound 1b was a pale yellow grease, yield: 73.8%; 1H NMR (400 MHz, CDCl3) δ: 15.41 (s, 1H), 8.95 (dd, J = 2.2, 0.9 Hz, 1H), 8.67 (dd, J = 4.9, 1.7 Hz, 1H), 8.03 (dt, J = 8.0, 2.0 Hz, 1H), 7.40 (ddd, J = 7.9, 4.8, 0.9 Hz, 1H), 2.71 (dd, J = 4.0, 3.0 Hz, 2H), 2.65–2.53 (m, 2H), 2.32 (tt, J = 5.9, 3.1 Hz, 1H), 1.47 (d, J = 9.5 Hz, 1H), 1.36 (s, 3H), 0.97 (s, 3H); 13C NMR (100 MHz, CDCl3) δ: 209.55, 169.51, 150.69, 149.01, 135.67, 131.29, 123.24, 104.89, 54.84, 39.77, 39.61, 28.07, 27.66, 25.79, 21.54; HRMS (m/z): [M + H]+ calculated for C15H17NO2 + H+, 244.1338; found, 244.1331.
Compound 1c was a pale yellow grease, yield: 76.5%; 1H NMR (400 MHz, CDCl3) δ: 15.26 (s, 1H), 8.78–8.67 (m, 2H), 7.63–7.52 (m, 2H), 2.77–2.64 (m, 2H), 2.68–2.54 (m, 2H), 2.32 (tt, J = 6.0, 3.1 Hz, 1H), 1.47 (d, J = 9.8 Hz, 1H), 1.36 (s, 3H), 0.97 (s, 3H); 13C NMR (100 MHz, CDCl3) δ: 209.98, 168.74, 150.06, 142.47, 122.14, 105.30, 54.92, 39.65, 39.62, 27.95, 27.60, 25.78, 21.55; HRMS (m/z): [M + H]+ calculated for C15H17NO2 + H+, 244.1339; found, 244.1332.
![[thin space (1/6-em)]](https://www.rsc.org/images/entities/char_2009.gif) :
:![[thin space (1/6-em)]](https://www.rsc.org/images/entities/char_2009.gif) EA = 15
EA = 15![[thin space (1/6-em)]](https://www.rsc.org/images/entities/char_2009.gif) :
:![[thin space (1/6-em)]](https://www.rsc.org/images/entities/char_2009.gif) 1, v/v) to obtain compounds 2a–2c.
1, v/v) to obtain compounds 2a–2c.
Compound 2a was a white solid powder, yield: 85.6%, mp: 146.2–147.2 °C; 1H NMR (400 MHz, DMSO) δ: 12.59 (s, 1H), 8.61 (d, J = 4.8 Hz, 1H), 7.96–7.58 (m, 2H), 7.29 (t, J = 6.3 Hz, 1H), 3.00 (dd, J = 16.3, 3.0 Hz, 1H), 2.89 (dd, J = 16.3, 2.6 Hz, 1H), 2.80 (t, J = 5.2 Hz, 1H), 2.71 (dt, J = 9.3, 5.8 Hz, 1H), 2.29 (tt, J = 5.6, 2.8 Hz, 1H), 1.39 (s, 3H), 1.27 (d, J = 9.3 Hz, 1H), 0.65 (s, 3H); 13C NMR (100 MHz, CDCl3) δ: 160.79, 149.58, 149.04, 137.13, 136.77, 122.19, 120.15, 110.67, 41.96, 41.30, 41.07, 32.52, 26.36, 26.32, 21.49; HRMS (m/z): [M + H]+ calculated for C15H17N3 + H+, 240.1501; found, 240.1494.
Compound 2b was a white solid powder, yield: 82.4%, mp: 150.5–151.5 °C; 1H NMR (400 MHz, DMSO) δ: 12.61 (s, 1H), 8.94 (d, J = 2.3 Hz, 1H), 8.51 (dd, J = 4.8, 1.6 Hz, 1H), 8.07 (dt, J = 8.0, 2.0 Hz, 1H), 7.48 (dd, J = 8.0, 4.8 Hz, 1H), 2.98 (dd, J = 15.8, 3.1 Hz, 1H), 2.91–2.80 (m, 2H), 2.71 (dt, J = 9.3, 5.8 Hz, 1H), 2.31 (dt, J = 5.7, 2.9 Hz, 1H), 1.39 (s, 3H), 1.29 (d, J = 9.3 Hz, 1H), 0.66 (s, 3H); 13C NMR (100 MHz, CHCl3) δ: 157.91, 148.11, 146.80, 137.91, 132.80, 128.07, 123.70, 110.22, 58.08, 41.41, 41.14, 32.37, 26.23, 26.01, 21.46; HRMS (m/z): [M + H]+ calculated for C15H17NO2 + H+, 240.1504; found, 240.1497.
Compound 2c was a white solid powder, yield: 87.1%, mp: 157.1–158.1 °C; 1H NMR (400 MHz, DMSO) δ: 12.78 (s, 1H), 8.61 (d, J = 5.1 Hz, 2H), 7.65 (d, J = 5.2 Hz, 2H), 3.00 (dd, J = 15.9, 3.1 Hz, 1H), 2.93–2.80 (m, 2H), 2.72 (dt, J = 9.4, 5.8 Hz, 1H), 2.32 (dt, J = 5.7, 2.9 Hz, 1H), 1.40 (s, 3H), 1.28 (d, J = 9.4 Hz, 1H), 0.64 (s, 3H); 13C NMR (100 MHz, CDCl3) δ: 157.96, 150.07, 139.12, 119.83, 111.60, 41.39, 41.33, 41.14, 32.36, 26.25, 26.21, 21.46, 18.39; HRMS (m/z): [M + H]+ calculated for C15H17NO2 + H+, 240.1498; found, 240.1496.
2.3. Cell culture and imaging
HeLa cells were incubated with probe 2a (5.0 × 10⁻⁶ M) in Dulbecco's Modified Eagle's Medium (DMEM) for 24 h at 37 °C. The cells were treated with aluminum chloride (5.0 × 10⁻⁵ M). After incubation for 1 h, the cells were washed with phosphate-buffered saline (PBS) three times, and the treated cells were used for cell imaging. The cell images were obtained using a confocal microscope at an excitation wavelength between 300 and 340 nm. Subsequently, in the control experiment, HeLa cells were only incubated with 2a (5.0 × 10⁻⁶ M), and then washed with PBS three times for cell imaging. The cell images were obtained with a confocal microscope at an excitation wavelength between 300 and 340 nm.3. Results and discussion
3.1. Synthesis and structural characteristics of probes 2a–2c
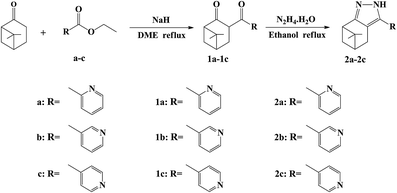
The synthetic procedure and molecular structure of probes 2a–2c are shown in Scheme 1. The probes 2a–2c were synthesized by two steps including the Claisen condensation of a–c with the β-pinene derivative nopinone catalyzed by NaH in a solution of 1,2-dimethoxyethane at reflux to obtain 1a–1c, and 1a–1c was further condensed with 60% N2H4·H2O at reflux to obtain 2a–2c.3.2. Fluorescence properties of 2a–2c toward different metals
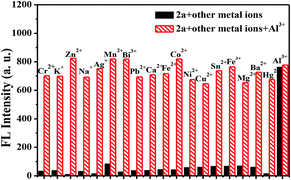
The selectivity behavior of probes 2a–2c toward various metal ions, including K+, Ba2+, Na+, Cr2+, Co2+, Mg2+, Fe2+, Fe3+, Mn2+, Ca2+, Pb2+, Cu2+, Ag+, Pb2+, Zn2+, Bi3+, Ni2+, Sn2+, and Al3+ was studied by fluorescence spectroscopy. The changes in the fluorescence spectroscopy of 2a–2c before and after the addition of various metal ions are shown in Fig. 1. This shows that compound 2a exhibited the best selectivity and highest fluorescence intensity toward Al3+, which implies a strong coordination ability between 2a and Al3+. The changes in the UV-Vis absorption spectra of 2a before and after the addition of various metal ions are shown in Fig. S1.† Upon addition of Al3+ (10 equiv.) to a solution of probe 2a, the absorption peak at 280 nm almost disappears and the peak at 330 nm is greatly enhanced. These results show that probe 2a could be used as a fluorescent probe to selectively detect the presence of Al3+.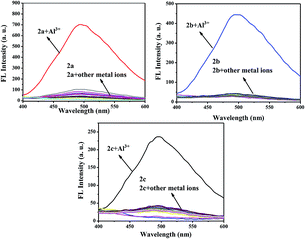 | ||
| Fig. 1 Fluorescence emission spectra of 2a–2c (5.0 × 10⁻⁶ M) upon the addition of 10 equiv. of various metal ions in C2H5OH solution. | ||
3.3. Optimization studies of probe toward Al3+
The detection conditions for probe 2a toward Al3+ were optimized by investigating the influence of the concentration of 2a, pH range, response time, and EtOH/HEPES buffer. The fluorescent intensity can reach a steady state after adding Al3+ into a solution of 2a for 45 s (Fig. S2C†). Further tests for determining the selectivity and sensitivity of probe 2a toward Al3+ were performed in aqueous buffer solution (EtOH/HEPES buffer, 10 mM, v/v = 6/4, pH = 7) (Fig. S2†); the concentration of probe 2a was 5.0 × 10⁻⁶ M (Fig. S2D†). As shown in Fig. S2A,† significant enhancement in fluorescence intensity was observed in the pH range 1–9, which indicated that it is suitable for application in living systems. We studied the photo-stability of the 2a–Al3+ complex in aqueous buffer solution (EtOH/HEPES buffer, 10 mM, v/v = 6/4, pH = 7). After continuous illumination for 60 h, the fluorescence intensity of the 2a–Al3+ complex did not show any obvious change in fluorescence (Fig. S3†). There was good photo-stability of the 2a–Al3+ complex, indicating that probe 2a could be identified as a practical method for Al3+ discrimination.3.4. Competitive selectivity of the 2a toward Al3+
To further investigate the selectivity of 2a as a fluorescence probe for Al3+, competition experiments were carried out in the presence of Al3+ mixed with other metal ions, such as K+, Ba2+, Na+, Cr2+, Co2+, Mg2+, Fe2+, Fe3+, Mn2+, Ca2+, Pb2+, Cu2+, Ag+, Pb2+, Zn2+, Bi3+, Ni2+, and Sn2+. As shown in Fig. 2, other metal ions had very little influence on the fluorescence intensity of the 2a–Al3+ complex. Combined with the data in Fig. 1, this demonstrates that probe 2a has very high selectivity toward Al3+.3.5. Sensitivity behavior of 2a toward Al3+
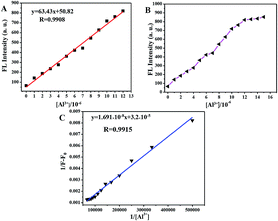
The sensitivity of probe 2a toward Al3+ was examined with a fluorescence titration method, and the fluorescence titration spectra of probe 2a toward Al3+ are shown in Fig. 3. As shown in Fig. 4B, the 5.0 × 10⁻⁶ M probe 2a solution (EtOH/HEPES buffer, v/v = 6/4, 10 mM HEPES, pH = 7.4) exhibited non-fluorescence. Upon the addition of Al3+ into the probe 2a solution (5.0 × 10⁻⁶ M), a green fluorescence dramatically appeared. Fig. 4A reveals that the fluorescence intensities at 495 nm increased linearly between the fluorescence intensity and the low Al3+ concentration in the range 0–1.2 × 10⁻⁵ M, y = 63.43x + 50.82, R2 = 0.9908 (fluorescence quantum yield Φ = 0.49, when the concentration of Al3+ was 1.5 × 10⁻⁵ M). The detection limit (LOD) for Al3+ was found to be 8.1 × 10⁻⁸ M by using DL = 3σ/k (where DL is the detection limit, σ is the standard deviation of the blank solution and k is the slope of the calibration plot). The association constant (KB) of probe 2a with Al3+ was determined to be 1.89 × 10³ M−1via the Benesi–Hildebrand equation37–39 (see Fig. 4C). Table S1† summarizes the detection limits of recently reported Al3+ fluorescent sensors and highlights their applications in food samples.40–46 The detection limit of 2a toward Al3+ is the lowest among these reported probes, implying that probe 2a can straightforwardly detect the concentration of Al3+ in water samples and food samples.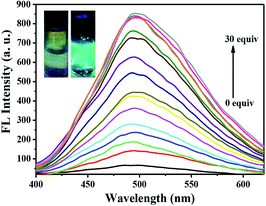 | ||
| Fig. 3 Fluorescence spectral changes in 2a (5.0 × 10⁻⁶ M) upon addition of Al3+ (0–1.5 × 10⁻⁵ M) in solution (EtOH/HEPES buffer, v/v = 6/4, 10 mM HEPES, pH = 7.4), λex = 330 nm. | ||
3.6. Binding ratio and detection mechanism between probe 2a and Al3+
A Job plot experiment was carried out to determine the stoichiometry between 2a and Al3+. As shown in Fig. S4,† the stoichiometry ratio of 2a to Al3+ was found to be 1![[thin space (1/6-em)]](https://www.rsc.org/images/entities/char_2009.gif) :
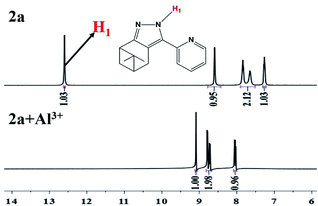
:![[thin space (1/6-em)]](https://www.rsc.org/images/entities/char_2009.gif) 1. The binding mode of probe 2a toward Al3+ was confirmed by 1H NMR experiments in DMSO, as shown in Fig. 5. In the presence of 1.0 equiv. of Al3+, the proton signal of pyrazole (H1) disappeared and the proton signal of the pyridine moiety shifted upfield. So, the sensing mechanism of probe 2a toward Al3+ could be the result of the synergistic complexation of the N atom in pyrazole and pyridine rings to Al3+ with a 1
1. The binding mode of probe 2a toward Al3+ was confirmed by 1H NMR experiments in DMSO, as shown in Fig. 5. In the presence of 1.0 equiv. of Al3+, the proton signal of pyrazole (H1) disappeared and the proton signal of the pyridine moiety shifted upfield. So, the sensing mechanism of probe 2a toward Al3+ could be the result of the synergistic complexation of the N atom in pyrazole and pyridine rings to Al3+ with a 1![[thin space (1/6-em)]](https://www.rsc.org/images/entities/char_2009.gif) :
:![[thin space (1/6-em)]](https://www.rsc.org/images/entities/char_2009.gif) 1 stoichiometry. From the HRMS spectra (Fig. S5†), the mass peak at m/z 359.1464 corresponds to [2a + Al3+ + 2Cl− + Na]+ (calculated at 359.2094). The proposed coordination mechanism is shown in Scheme 2. Furthermore, the energies of both the HOMO and LUMO of 2a and the 2a–Al3+ complex were calculated (Fig. S6†). The decrement in energy band gap confirms that there are obvious intramolecular charge-transfer (ICT) phenomena in 2a–Al3+ complexes. Therefore, the calculated results were in good agreement with the emission wavelengths of 2a and 2a–Al3+.
1 stoichiometry. From the HRMS spectra (Fig. S5†), the mass peak at m/z 359.1464 corresponds to [2a + Al3+ + 2Cl− + Na]+ (calculated at 359.2094). The proposed coordination mechanism is shown in Scheme 2. Furthermore, the energies of both the HOMO and LUMO of 2a and the 2a–Al3+ complex were calculated (Fig. S6†). The decrement in energy band gap confirms that there are obvious intramolecular charge-transfer (ICT) phenomena in 2a–Al3+ complexes. Therefore, the calculated results were in good agreement with the emission wavelengths of 2a and 2a–Al3+.
3.7. Preparation of the test strips
As shown in Fig. S7,† the test strips showed no fluorescence under 365 nm UV-lamp when they were prepared by soaking filter papers in an ethanol solution of 2a (2.0 × 10⁻⁴ M) and dried in air. When immersed in an aqueous solution of Al3+ (2.0 × 10⁻⁴ M), the test strips showed green fluorescence. Therefore, the 2a-based test strips show promising application for the detection of Al3+ in water by fluorimetric changes.3.8. Determination in different water samples
Novel probe 2a (5 × 10⁻⁵ M) was used for the detection of the concentration of Al3+ in tap water, distilled water, and lake water samples. All the water samples were collected and simply filtered. As shown in Fig. S8,† a good linear relationship was obtained between the fluorescence intensity at 495 nm and the concentration of Al3+ (0, 2, 5, 10, 15 × 10−6 M) in various water samples. The results listed in Table 1 show that in all the water samples recovery was higher than 95%. Therefore, the novel Al3+ fluorescent probe can be used for detection of the concentration of Al3+ in real water samples.| Samples | Add (1 × 10⁻⁶ M) | Detected (1 × 10⁻⁶ M) | Recovery (%) |
|---|---|---|---|
| Tap water | 0 | 0.62 | 0 |
| 2 | 2.04 | 102.80 | |
| 5 | 5.15 | 103.20 | |
| 10 | 9.85 | 98.46 | |
| 15 | 14.93 | 99.54 | |
| Distilled water | 0 | 0.17 | 0.00 |
| 2 | 1.95 | 97.50 | |
| 5 | 5.11 | 102.20 | |
| 10 | 10.13 | 101.30 | |
| 15 | 14.69 | 97.96 | |
| Lake water | 0 | 0.65 | 0.00 |
| 2 | 1.92 | 96 | |
| 5 | 4.91 | 98.2 | |
| 10 | 10.06 | 100.64 | |
| 15 | 14.31 | 95.4 |
3.9. Application in food samples
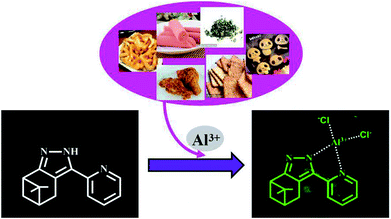
It is well known that Al3+ is widely used in food products. But, excessive ingested Al3+ may cause several diseases. Therefore, it is practically important to detect Al3+ in food products using this novel fluorescent probe. Some food samples containing Al3+, such as chips, fried chicken, tea, sausage, biscuit and baby biscuit were chosen to examine the application of probe 2a (5 × 10⁻⁵ M) in food samples. These food samples were first crushed and 20% (v/v) HCl aqueous solution was added. Then it was stirred for one day until the solution became turbid. The mixture was filtered to obtain the Al3+-containing filtrate. The fluorescence intensity at 495 nm displayed a good linear relationship with the concentration of Al3+ (0, 2, 5, 10, 15 × 10−6 M) (R2 = 0.992, Fig. S9†). The results listed in Table 2 show that probe 2a can detect the concentration of Al3+ in different food solutions with good recovery, ranging from 96 to 103%. Therefore, the novel Al3+ probe 2a can be applied as a simple method to detect the concentration of Al3+ in various food samples.| Samples | Al3+ (1 × 10⁻⁶ M) | Added (1 × 10⁻⁶ M) | Found (1 × 10⁻⁶ M) | Recovery (%) |
|---|---|---|---|---|
| Chips | 6.15 | 3 | 8.99 | 98.25 |
| 6 | 12.22 | 100.57 | ||
| Fried chicken | 5.13 | 3 | 8.32 | 102.33 |
| 6 | 10.96 | 98.47 | ||
| Sausage | 2.89 | 3 | 5.78 | 98.13 |
| 6 | 8.57 | 96.40 | ||
| Tea | 1.47 | 3 | 4.29 | 95.97 |
| 6 | 7.18 | 96.12 | ||
| Biscuit | 0.55 | 3 | 3.49 | 98.30 |
| 6 | 6.33 | 96.64 | ||
| Baby biscuit | 0 | 3 | 3.11 | 103.67 |
| 6 | 6.12 | 102 |
3.10. Cellular imaging
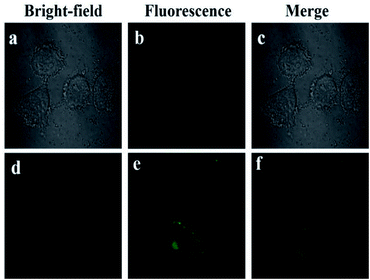
Fluorescence imaging experiments of 2a were performed to study the utility of probe 2a in living cells. Cytotoxicity assays results showed that compound 2a had low cytotoxicity to HeLa cells (Fig. S10†). HeLa cells were incubated with 2a (5.0 × 10⁻⁶ M) at 37 °C for 24 h. And no obvious fluorescence was observed. However, after HeLa cells were incubated with AlCl3 for 1 h, remarkable fluorescence enhancement can clearly be detected (Fig. 6). The fluorescence imaging experiments show that the novel Al3+ fluorescent probe 2a has potential application in living cells.4. Conclusions
In summary, we developed a β-pinene-based fluorescent probe 2a from natural β-pinene derivative nopinone for the detection of Al3+. The new fluorescent probe 2a exhibits advantages, such as clearer change in fluorescence, wider pH range, higher sensitivity, better selectivity, lower detection limit, and simpler synthetic procedures. The sensing mechanism of 2a with Al3+ was studied by 1H NMR, HRMS, and DFT analysis. Fluorescence probe 2a can be used as fluorescent sensing tool for the real-time detection of Al3+ in aqueous media, food samples, and living cells.Conflicts of interest
There are no conflicts to declare.Acknowledgements
The research was supported by the National Natural Science Foundation of China (No. 31470592), Jiangsu Provincial Key Lab for the Chemistry and Utilization of Agro-Forest Biomass, the open Fund of Jiangsu Key Laboratory for Biomass Energy and Material (JSBEM201702), and Priority Academic Program Development of Jiangsu Higher Education Institutions, China.Notes and references
- V. K. Gupta, A. K. Singh and N. Mergu, Electrochim. Acta, 2014, 117, 405–412 CrossRef CAS.
- S. Sen, T. Mukherjee and B. Chattopadhyay, Analyst, 2012, 137, 3975–3981 RSC.
- W. S. Miller, L. Zhuang and J. Bottema, Mater. Sci. Eng., A, 2000, 280, 37–49 CrossRef.
- N. W. Baylor, W. Egan and P. Richman, Vaccine, 2002, 20, S18–S23 CrossRef CAS.
- D. Maity and T. Govindaraju, Chem. Commun., 2010, 46, 4499–4501 RSC.
- S. Sooksin, V. Promarak and S. Ittisanronnachai, Sens. Actuators, B, 2018, 262, 720–732 CrossRef CAS.
- J. L. Yang, L. Zhang and L. I. Ying, Ann. Bot., 2006, 97, 579–584 CrossRef CAS.
- J. Lee, H. Kim and S. Kim, Dyes Pigm., 2013, 96, 590–594 CrossRef CAS.
- S. Kim, J. Y. Noh, K. Y. Kim and J. H. Kim, Inorg. Chem., 2012, 51, 3597–3602 CrossRef CAS.
- P. D. Darbre, J. Inorg. Biochem., 2005, 99, 1912–1919 CrossRef CAS.
- S. R. Paik, J. H. Lee and D. H. Kim, Arch. Biochem. Biophys., 1997, 344, 325–334 CrossRef CAS.
- J. Barceló and C. Poschenrieder, Environ. Exp. Bot., 2002, 48, 75–92 CrossRef.
- G. X. Zhang, R. X. Ji and X. Y. Kong, RSC Adv., 2019, 9, 1147–1150 RSC.
- Y. Li, C. Y. Liao and S. S. Huang, RSC Adv., 2016, 6, 25420–25426 RSC.
- T. L. Cui, S. Z. Yu and Z. J. Chen, RSC Adv., 2018, 8, 12276–12281 RSC.
- D. P. Singh, R. Dwivedi and A. K. Singh, Sens. Actuators, B, 2017, 238, 128–137 CrossRef CAS.
- X. L. Yue, Z. Q. Wang and C. R. Li, Spectrochim. Acta, Part A, 2017, 193, 415–421 CrossRef.
- F. Wang, Y. Xu and S. O. Aderinto, J. Photochem. Photobiol., A, 2017, 332, 273–282 CrossRef CAS.
- S. R. Gupta, P. Singh and B. Koch, J. Photochem. Photobiol., A, 2017, 348, 246–254 CrossRef CAS.
- Y. Wang, Z. Y. Ma and D. L. Zhang, Spectrochim. Acta, Part A, 2018, 195, 157–164 CrossRef CAS.
- H. Xie, Y. Wu and J. Huang, Talanta, 2016, 151, 8–13 CrossRef CAS.
- J. C. Qin, X. Y. Cheng and R. Fang, Spectrochim. Acta, Part A, 2016, 152, 352–357 CrossRef CAS.
- Y. Zhang, Y. Fang and N. Z. Xu, Chin. Chem. Lett., 2016, 11, 1673–1678 CrossRef.
- P. G. Ding, J. H. Wang and J. Y. Cheng, New J. Chem., 2015, 39, 342–348 RSC.
- X. Y. Li, M. M. Yu and F. L. Yang, New J. Chem., 2013, 37, 2257–2260 RSC.
- X. Zhang, P. Sun and F. Li, Sens. Actuators, B, 2017, 255, 366–373 CrossRef.
- M. Tajbakhsh, G. B. Chalmardi and A. Bekhradnia, Spectrochim. Acta, Part A, 2018, 189, 22–31 CrossRef CAS.
- S. Chemate and N. Sekar, Sens. Actuators, B, 2015, 220, 1196–1204 CrossRef CAS.
- B. J. Pang, C. R. Li and Z. Y. Yang, Spectrochim. Acta, Part A, 2018, 204, 641–647 CrossRef CAS.
- R. Lu, S. Cui and S. Li, Tetrahedron, 2017, 73, 915–922 CrossRef CAS.
- Q. Diao, P. Ma and L. Lv, Sens. Actuators, B, 2016, 229, 138–144 CrossRef CAS.
- C. Lim, H. Seo and J. H. Choi, J. Photochem. Photobiol., A, 2018, 356, 312–320 CrossRef CAS.
- C. Sun, J. Sun and F. Z. Qiu, Spectrochim. Acta, Part A, 2018, 188, 1–7 CrossRef CAS.
- H. Liang, Z. Li and D. Wu, Sens. Actuators, B, 2018, 269, 62–69 CrossRef CAS.
- Y. Tang, X. Kong and A. Xu, Angew. Chem., Int. Ed., 2016, 55, 3356–3359 CrossRef CAS.
- Z. l. Wang, Y. Zhang and J. Song, Dyes Pigm., 2019, 161, 172–181 CrossRef CAS.
- K. Huang, X. Jiao and C. Liu, Dyes Pigm., 2017, 142, 437–446 CrossRef CAS.
- J. M. Jung, J. H. Kang and J. Han, Sens. Actuators, B, 2018, 267, 58–69 CrossRef CAS.
- Z. Y. Li, H. K. Su and K. Zhou, Dyes Pigm., 2018, 149, 921–926 CrossRef CAS.
- E. Feng, C. Fan and N. Wang, Dyes Pigm., 2018, 151, 22–27 CrossRef CAS.
- E. Feng, R. Lu and C. Fan, Tetrahedron Lett., 2017, 58, 1390–1394 CrossRef CAS.
- Q. Wang, X. Wen and Z. Fan, J. Photochem. Photobiol., A, 2018, 358, 92–99 CrossRef CAS.
- D. Wang, X. Fan and S. Sun, Sens. Actuators, B, 2018, 264, 304–311 CrossRef CAS.
- X. Gan, W. Li and C. Li, Sens. Actuators, B, 2017, 239, 642–651 CrossRef CAS.
- Y. Wang, Z. Y. Ma and D. L. Zhang, Spectrochim. Acta, Part A, 2018, 195, 157–164 CrossRef CAS.
- L. Li, H. Li and G. Liu, J. Photochem. Photobiol., A, 2017, 338, 192–200 CrossRef CAS.
Footnote |
| † Electronic supplementary information (ESI) available. See DOI: 10.1039/c9ra00447e |
| This journal is © The Royal Society of Chemistry 2019 |

