 Open Access Article
Simple and efficient dual-wavelength spectroscopy for the determination of organic matter in sewage sludge from wastewater treatment
Xiaojie Tua,
Zhanbo Hu *b,
Xin-Sheng Chaic and
Yuting Sub
aCollege of Forestry, Guangxi University, Nanning, China
bSchool of Resources, Environment and Materials, Guangxi University, Nanning, China. E-mail: huzhanbo@gxu.edu.cn
cState Key Laboratory of Pulp and Paper Engineering, South China University of Technology, Guangzhou, China
First published on 23rd April 2019
Abstract
In this study, a dual-wavelength spectroscopic method for rapid determination of organic matter in sludge was developed. The contents of the organic matter were calculated by determining the consumption of potassium dichromate (K2Cr2O7) based on the production of trivalent chromium ions (Cr3+). Cr3+ could be determined by subtracting the absorption at 800 nm (spectral interference) from the absorption at 650 nm (only contributed by Cr3+). The results showed that the relative standard deviation in the test was less than 5%. The same set of samples was used and when the content of organic matter was more than 150 g kg−1, the relative difference between the spectroscopic method and titration method was within 1%. Furthermore, the method does not require calibration based on the standard samples. In conclusion, the present method is simple, reliable, accurate and suitable for application in mass testing for sludge samples.
1. Introduction
Sewage sludge is a sort of semi-solid slurry from wastewater treatment processes.1 Because of the rich contents of organic matter (OM) in such sludge (ranging from 40 to 60%),2 it can be utilized as a fertilizer or soil conditioner for the growth of plants and soil improvement.3–6 Since the content of OM in sewage sludge is an important parameter for soil related sludge utilization, it is highly desired to have an efficient method for OM quantification in related research and applications.Currently, the content of OM in a sludge sample is determined by either the Walkley–Black (WB) method (based on potassium dichromate oxidation) or the combustion method (determined by ignition of the samples at 550 °C).7–10 In the WB method, the organic matter reacts with an overdosed dichromate ion (Cr2O72−) to form Cr3+ in a sulfuric acid medium.11 The excessive amount of dichromate ions is then quantified by the titration with a ferrous sulfate standard solution,12 from which the content of OM in the sludge sample can be determined. Besides the complicity in preparing the standard ferrous sulfate solution, the titration procedure is also complicated and time-consuming. The major problem in the combustion method is the interferences from some inorganic components, typically the carbonate and bicarbonate salts.
Recently, a method combining Fourier-transform infrared photoacoustic (FTIR-PAS) and Raman spectroscopies has been proposed for the OM quantification.12 In this method, the soil samples were scanned by FTIR-PAS and Raman spectrometers in the range of 4000–400 cm−1 and 180–3200 cm−1, respectively, from which the content of OM in the samples can be predicted based on a calibration model. Although the sample pretreatment in this non-destructive method is very simple, an exhausting measurements based on the above reference method for a set of training samples (>30) is required in the model establishment.13 Moreover, besides the expensive cost in the instruments and their maintenance, the model will be no longer valid if the background of samples changes.14
According to WB method, the Cr3+ ions are the product from the reaction between the organic matter in soil and dichromate ions (Cr2O72−). Since Cr3+ ions have a color (dark green) in the visible wavelength range, they can be easily analyzed by visible spectroscopy according to Beer's law. However, it could be the major challenge to eliminate the spectral interference from other co-existing species in the above post-reaction medium.
In this work, we proposed a simple and efficient spectroscopic method for the determination of OM content in sludge samples, based on the dichromate oxidation. The major focuses were to find the suitable wavelength for the Cr3+ quantification and the method for correcting the effect of light scattering caused by the tiny particles (from soil) in the reaction medium. The performance of the method (e.g., the measurement precision and accuracy) was also evaluated.
2. Experimental
2.1 Materials
All of these chemicals used in this study were analytical grade and provided by local chemical manufacturers, which included potassium dichromate (purity > 99.8%), sulfuric acid (purity > 98%), phenanthroline (purity > 99.5%), ferrisulphas (purity > 99.5%), quartz sand, potassium hydrogen phthalate (purity > 99.8%). Distilled and deionized water used in all experiments was prepared by Ultra-pure Water Purifier (Barnstead Smart2Pure, Thermo Scientific, Waltham, MA).The sludge samples were collected from a municipal wastewater treatment plant located in Nanning (Guangxi, China). Prior to analysis, the samples were air-dried, crushed at room temperature, and screened through a 0.25 mm mesh sieve for removing any plant roots and debris.
2.2 Apparatus
A Graphite dissociator (DigiPREP MS, SCP SCIENCE, CANADA), preheated to 180 °C, was employed for the digestion of sludge. A UV-Vis spectrophotometer (Shimadzu UV-1800, JAPAN) equipped with a 0.5 cm quartz cell was used for the measurements. Absorptive spectra of the solutions were recorded over the wavelength 200–800 nm at a scan speed of 2800 nm min−1 with the fixed width of slit (1 nm).2.3 Sample preparation and experimental procedures
Accurately weigh 123.35, 236.70, 493.40, and 740.10 g of potassium hydrogen phthalate, followed by mixing with the different amount of quartz sand to reach a total weight of 1000 g (the contents of OM in these samples were 100, 200, 400, and 600 g kg−1, respectively).
A 0.05 g of sample and 20 mL of digestion solution were added into a 50 mL PTFT digestion tube and blended well. After the graphite dissociator was preheated to 180 °C, the digestion tube placed in and let the solution be boiled for 5 min. Then the tube was taken out for cooling to the room temperature.
For a comparison, a series of parallel samples were digested and the resulting solution were also determined by a reference titration method,15 based on the following procedures: the solution in the digestion tube was completely transferred into the 250 mL conical flask (with 2–3 times' water washing) to keep the total volume of solution about 100 mL. After add 3 drops of phenanthroline indicator, the solution was titrated by the ferrisulphas standard solution to the end-point color (brown reddish). The volume of the standard solution consumed at the end-point was recorded.
3. Results and discussion
3.1 Spectral characteristics of Cr2O72− and Cr3+
The present method is based on the reaction between the C of OM in sludge and potassium dichromate (overdosed), i.e.,| Cr2O72− + C + H+ → Cr3+ + CO2 + H2O |
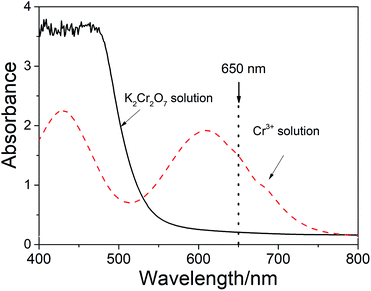
After the digestion reaction, some part of Cr2O72− is converted to Cr3+. Therefore, both Cr2O72− and Cr3+ ions present in the medium. Fig. 1 shows the spectra of Cr2O72− and Cr3+ in the solutions. It can be seen from the figure that the spectra of these two species are completely overlapped at the visible wavelengths below 650 nm. However, the absorbance (A) at the wavelength range between 650 nm and 800 nm is only contributed by Cr3+ (which has a maximum absorptivity at 605 nm).
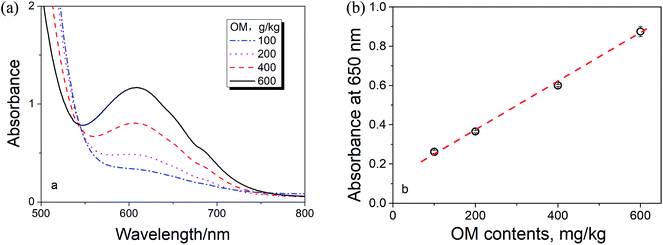
Fig. 2a shows the spectra of Cr3+ in the digested medium with different OM contents. Fig. 2b shows the linear relationship between the spectral absorption at 650 nm (for Cr3+) and the OM content in the solution, i.e., agreed to Beer's law.16 Therefore, the content of Cr3+ (proportional to the OM content) in the digested medium can be simply determined by the spectroscopic measurement at 650 nm if there is no any spectral interference.
 | ||
| Fig. 2 (a) The spectra of Cr3+ and (b) the relationship between the absorption at 650 nm vs. the OM content in the samples. | ||
3.2 Spectral interferences
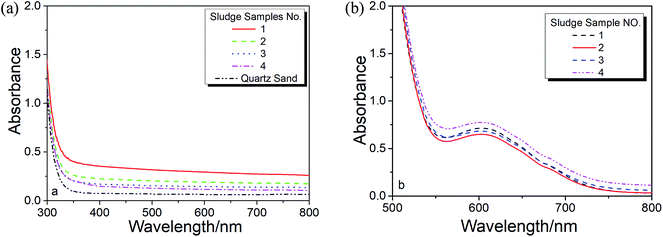
As noticed in Fig. 2a, there is a baseline shifting at 650 nm even for these artificial prepared sample (make up with quartz sand), which leads to an intercept in the absorbance calibration curve shown in Fig. 2b. The baseline shifting is mainly caused by the light scattering (due to the presence of tiny particles in the solutions), including refraction, reflection, diffraction and absorption, which weakens the transmitted light and increase the measured absorbance.17,18To figure out this effect, we conducted the spectroscopic measurement on a quartz sand and several sludge samples with and without oxidation and their spectra are shown in Fig. 3. It is clear that the baseline shifting caused by the light scattering takes place in the entire visible wavelength range in both cases. No doubt, the above baseline shifting definitely affects the accuracy of the method based on the absorbance measurement at 605 nm. Fortunately, because the effect of the shifting at 650 nm is very closed to that at 800 nm, a wavelength without Cr3+ absorption (see Fig. 1 and 3a), we can easily minimize the spectral interference caused by the particles' light scattering by subtracting the absorbance at 800 nm (as the reference).
 | ||
| Fig. 3 Effect light scattering from (a) un-oxidized and (b) in this figure oxidized sewage sludge digested samples. | ||
3.3 Establishment of dual-wavelength spectrometric method
According to Fig. 1, the absorbance at 650 nm is contributed by the absorbances caused by Cr3+ and particles' light scattering, i.e.,| A650 = Acr3+,650 + Ass,650 | (1) |
As shown in Fig. 3a, the absorbance of 650 nm is nearly close to that of 800 nm, i.e.,
| Ass,650 = A800 | (2) |
Based on eqn (2) and Beer's law (A = εc), eqn (1) can be rewritten as
| ACr3+,650 = A650 − A800 = εCr3+,650cCr3+ | (3) |
The absorptivity of Cr3+ at 650 nm can be obtained based on a set of standard solutions, which is 1.75, an average value from the measurements with different concentration (as listed in Table 1).
| Concentration of Cr3+, mol L−1 | εCr3+,650, L mol−1 cm−1 |
|---|---|
| 0.8 | 1.67 |
| 0.6 | 1.75 |
| 0.4 | 1.82 |
| Average | 1.75 |
Thus, the concentrations of Cr3+ in the reaction solution can be calculated by
 | (4) |
 | (5) |
3.4 Method evaluation
| Times | OM, g kg−1 | |||||
|---|---|---|---|---|---|---|
| Sample 1 | Sample 2 | Sample 3 | Sample 4 | Sample 5 | Sample 6 | |
| 1 | 365 | 358 | 365 | 357 | 357 | 306 |
| 2 | 372 | 355 | 348 | 364 | 360 | 313 |
| 3 | 381 | 354 | 339 | 336 | 364 | 310 |
| Average | 373 | 356 | 351 | 352 | 360 | 310 |
| RSD% | 2.14 | 0.54 | 3.69 | 4.06 | 1.11 | 1.13 |
| Sample no. | OM, g kg−1 | Recovered% | |
|---|---|---|---|
| Added | Measured | ||
| 1 | 100 | 112 | 112 |
| 2 | 150 | 150 | 100 |
| 3 | 200 | 201 | 100 |
| 4 | 300 | 290 | 96.7 |
| 5 | 400 | 375 | 93.7 |
| 6 | 600 | 558 | 93.0 |
A comparison study was also conducted based on a set of real sludge samples from the wastewater treatment processes. The contents of OM in these samples were determined by both the present method and a reference titration method, and the results were shown in Table 4. It can be seen from the table that the data obtained by these two methods have a good agreement. It further proves that the present method is justifiable to be used for the determination of OM content in the sludge samples, especially for the samples with high OM contents.
| Sample no. | OM, g kg−1 | RD% | Sample no. | OM, g kg−1 | RD% | ||
|---|---|---|---|---|---|---|---|
| Titration method (n = 3) | Present method (n = 3) | Titration method (n = 3) | Present method (n = 3) | ||||
| 1 | 34 ± 3 | 45 ± 5 | 13.9 | 11 | 217 ± 8 | 210 ± 8 | −1.64 |
| 2 | 33 ± 3 | 50 ± 4 | 20.4 | 12 | 295 ± 1 | 290 ± 1 | −0.85 |
| 3 | 46 ± 3 | 40 ± 2 | −6.98 | 13 | 327 ± 8 | 353 ± 13 | 3.82 |
| 4 | 43 ± 6 | 60 ± 2 | 16.5 | 14 | 352 ± 9 | 354 ± 14 | 0.28 |
| 5 | 114 ± 8 | 107 ± 8 | −3.17 | 15 | 364 ± 3 | 357 ± 2 | −0.97 |
| 6 | 151 ± 11 | 149 ± 4 | −0.67 | 16 | 378 ± 2 | 375 ± 8 | −0.40 |
| 7 | 172 ± 1 | 164 ± 1 | −2.38 | 17 | 429 ± 4 | 422 ± 4 | −0.82 |
| 8 | 175 ± 2 | 167 ± 2 | −2.34 | 18 | 427 ± 2 | 420 ± 2 | −0.82 |
| 9 | 179 ± 1 | 173 ± 2 | −1.70 | 19 | 814 ± 10 | 807 ± 10 | −0.43 |
| 10 | 182 ± 2 | 175 ± 1 | −1.96 | 20 | 816 ± 13 | 801 ± 3 | −0.93 |
| y = 0.0013(±0.0001)x + 0.0511(±0.0087) | (6) |
 | (7) |
4. Conclusions
A spectroscopic method for the determination of OM content in sludge samples has been developed. The results showed that the spectral interference caused by the particles' light scattering can be effectively minimized by a dual-wavelength measurement. Compared to the reference methods currently used in the determination of the OM content in sludge samples, the present method is much simple and efficient. Therefore, the proposed method can be used as a valuable tool to evaluate the OM content in sludge, especially for those to be converted to fertilizer or soil conditioner's applications.Conflicts of interest
There are no conflicts to declare.Acknowledgements
The authors acknowledge the financial supports from the Key Project of the Science and Technology Ministry of Nanning, China (Grant No. 20183045-2).References
- Q. Zhang, J. Hu, D. Lee, Y. Chang and Y. Lee, Bioresour. Technol., 2017, 243, 1159 CrossRef CAS PubMed.
- P. Theodoratos, A. Moirou, A. Xenidis and I. Paspaliaris, J. Hazard. Mater., 2000, 77, 177 CrossRef CAS PubMed.
- Q. H. Zhang, W. N. Yang, H. H. Ngo, W. S. Guo, P. K. Jin, M. Dzakpasu, S. J. Yang, Q. Wang, X. C. Wang and D. Ao, Environ. Int., 2016, 92–93, 11 CrossRef CAS PubMed.
- G. Yang, G. Zhang and H. Wang, Water Res., 2015, 78, 60 CrossRef CAS PubMed.
- B. O. Clarke and S. R. Smith, Environ. Int., 2011, 37, 226 CrossRef CAS PubMed.
- A. Navas, F. Bermúdez and J. Machín, Geoderma, 1998, 87, 123 CrossRef.
- H. Zhong, H. Wang, X. Liu, C. Liu, G. Liu, Y. Tian, X. Feng and Y. Chen, Chemosphere, 2017, 180, 57 CrossRef CAS PubMed.
- D. Kulikowska, Waste Manage., 2016, 49, 196 CrossRef CAS PubMed.
- H. Liu, Sci. Total Environ., 2016, 566–567, 8 CrossRef CAS PubMed.
- X. Zhao, B. Li, J. Ni and D. Xie, J. Integr. Agric., 2016, 15, 232 CrossRef CAS.
- I. Raya-Moreno, R. Cañizares, X. Domene, V. Carabassa and J. M. Alcañiz, Sci. Total Environ., 2017, 598, 604 CrossRef CAS PubMed.
- Z. Xing, C. Du, K. Tian, F. Ma, Y. Shen and J. Zhou, Talanta, 2016, 158, 262 CrossRef CAS PubMed.
- R. A. V. Rossel and T. Behrens, Geoderma, 2010, 158, 46 CrossRef CAS.
- Y. Ogena, C. Neumann, S. Chabrillat, N. Goldshleger and E. B. Dor, Geoderma, 2018, 321, 100 CrossRef.
- A. Walkley and I. A. Black, Soil Sci., 1934, 37, 29 CrossRef CAS.
- J. M. Parnis and K. B. Oldham, J. Photochem. Photobiol., A, 2013, 267, 6 CrossRef CAS.
- J. Wu, C. Ho, C. Huang, A. Srivastav, J. Tzeng and Y. Lin, Sensors, 2014, 14, 22670 CrossRef CAS PubMed.
- S. Fogelman, H. Zhao and M. Blumenstein, Anal. Bioanal. Chem., 2006, 386, 1773 CrossRef CAS PubMed.
| This journal is © The Royal Society of Chemistry 2019 |

