 Open Access Article
Investigation of novel nanomaterial for the removal of toxic substances from contaminated water
Wessam N. El-Sayeda,
Khalid Z. Elwakeel b,
Ahmed Shahat
 a and
Md. Rabiul Awual
 *c
*c
aChemistry Department, Faculty of Science, Suez University, Suez 43518, Egypt. E-mail: wessam_nader@yahoo.com
bDepartment of Environmental Science, Faculty of Science, Port-Said University, Port-Said, Egypt
cDepartment of Applied Chemistry and Chemical Engineering, University of Dhaka, Dhaka-1000, Bangladesh. E-mail: rawual76@yahoo.com
First published on 7th May 2019
Abstract
Ligand-functionalized nanomaterials exhibit great potential for the removal of hazardous substances from the environment and industrial wastewater. In this work, a composite nanosphere material was fabricated using mesoporous silica and organic ligand, and employed for the efficient detection and subsequent removal of toxic sulfanilamide (SNA) from waste samples. The organic ligand 2-naphthol was successfully conjugated onto the mesoporous nanospheres, which then captured SNA under suitable conditions. A naked-eye color change was observed even when a trace amount of SNA interacted with the material, which is the most promising advantage of the fabricated material. A low limit of detection and quantification limit were also determined, and the new nanosphere material revealed the ultra-trace detection performance of 0.27 μg L−1 of SNA in aqueous media. The effect of solution pH, competing ions, color optimization and initial concentration of SNA on the nanosphere material was investigated under the optimum conditions. The nanosphere material exhibited rapid adsorption properties, and its maximum adsorption capability approached 79.20 mg g−1. Several compounds were examined as common interfering substances including vanillin, glucose, lactose, starch and sucrose, which did not adversely interfere in both the detection and adsorption systems using the proposed nanosphere material. The data emphasized that the proposed material is highly suitable for the capture of SNA from contaminated water based on its selectivity, sensitivity, cost-effectiveness and eco-friendly approach. The results also indicate that this nanosphere material will attract attention from researchers for the efficient and selective capture of the toxic SNA.
1. Introduction
Toxic compounds adversely affect human health and the environment. Sulfanilamide (SNA) is chemically known as 4-aminobenzenesulfonamide, and it is used as a therapeutic compound for protection from major microbial infections in the form of crystals or fine powder.1–3 Also, SNA is frequently used in the treatment of surface and internal infections in the form of a pill, topical cream or powder. However, recently it was confirmed that SNA enters organs as an antibacterial drug and has adverse effects on the environment and human beings.4 Therefore, it is necessary to detect and remove trace amounts of SNA before the disposal of SNA-containing waste into the environment to safeguard public health.Many methods have been reported for the detection of SNA in pharmaceutical preparations, including HPLC, flow injection analysis and electrochemical methods.5–9 However, they are very intensive and highly sensitive and used only in developed countries. In addition, they are very expensive, time consuming and need well-controlled instruments and complicated sample preparation. Therefore, these methods are unsuitable in developing countries, for onsite detection and application without trained analysts.10–12 Accordingly, suitable and simple methods based on visualization and no need for sophisticated instrumentation are desirable.13–16 Recently, optical materials have drawn attention since they develop color upon binding with toxic substances and elements. Moreover, they are technologically feasible due to their reuse without deterioration in structural properties and high sensitivity and selectivity for metal ions and toxic substances.17–19 Therefore, ligand-based nanosphere materials are promising for the efficient capture of SNA in contaminated water.
Several removal technologies including liquid–liquid extraction, complexion, precipitation, and ion-exchange adsorption have been utilized to remove metal ions and specific toxic compounds from wastewater.20–22 However, many of them are unsuitable due to their cost, amount of reagent required, incomplete removal, single use, and production of toxic sludge, which requires another disposal operation. On the other hand, the adsorption process has several advantages such as complete removal up to the permissible limit and ability to perform many cycles without decline in performance efficiency for the adsorption of a wide range of toxic substances and toxic ions.23–25 Moreover, removal by solid materials is more effective to take up ultra-trace levels of harmful elements from wastewater samples with high kinetic performances. However, many of the adsorbent materials are expensive and the operational procedure is costly.26–29 Therefore, researchers have focused their efforts on fabricating low-cost materials with high selectivity, high kinetic performances, reversibility and simple operation.
Ligand-functionalized nanosphere materials are promising contenders to capture toxic substances and metal ions under suitable conditions in the second generation nanotechnology of solid–liquid adsorption systems.30,31 Mesoporous nanosphere materials are key materials due to their large surface area, large pore sizes, highly ordered structure and long-term structural stability. Therefore, specific ligand-containing nanosphere materials are attractive from the point of view of stable complexation mechanism, and tremendous sensitivity and selectivity with remarkable adsorption capacity.32,33 Many ligands are not selective, thus it is imperative to fabricate selective materials for the capture of toxic substances.34–37 Specific materials are desirable in terms of stable complexation and sensitive removal or capturing of diverse substances and elements from wastewater samples. Herein, we fabricated a new functional ligand-impregnated advanced mesoporous nanosphere material for the selective optical capturing of SNA from contaminated water.
In this study, we developed an optical nanosphere material for the efficient and selective detection of the toxic SNA and its removal from contaminated water based on a low-cost, simple and reliable method. The present method involves the diazotization of toxic SNA in the presence of sodium nitrite, and the binding of the resulting material with 2-naphthol to evolve a reddish orange azo dye, which is measured using colorimetric visualization. All experimental procedures were carried out in batch mode operation. The experimental parameters in the detection and removal of SNA were optimized consistently, and suitable procedures are reported. The synthesized nanosphere material presented interesting results due to its extreme sensitivity, selectivity and great adsorption capacity with optical visualization.
2. Experimental
2.1. Materials
All chemicals purchased were of analytical grade. Cetyltrimethylammonium bromide (CTAB), tetraethylorthosilicate (TEOS), sodium nitrite and ethyl ether were purchased from Sigma-Aldrich. SNA and 2-naphthol were purchased from Merck. All solutions were prepared according to AAS grade. For pH adjustment during the detection operation, buffer reagents of 0.2 M KCl–HCl and 0.1 M CH3COOH–CH3COONa were employed for pH adjustment from 1.0 to 6.0. HEPES and Na2HPO4 were used to adjust the pH from 7.0 to 12.0 in addition to sodium hydroxide solution.2.2. Fabrication of mesoporous silica nanospheres
An emulsion system of ethyl ether, tetraethylorthosilicate (TEOS) and cetyltrimethylammonium bromide (CTAB) surfactant was used to synthesize nanosphere silica.28 In a typical synthesis, 0.25 g CTAB was dissolved in 35 g distilled H2O with stirring, followed by the addition of a mixture of 15 mL ethyl ether and 1.5 mL TEOS dropwise under vigorous stirring, and then the pH of the resulting mixture was adjusted to 11.0 with NH4OH (25 wt%). Subsequently, the resulting gel was stirred in a closed vessel at room temperature for 12 h at 240 rpm, followed by aging at 100 °C for 24 h. After filtering, washing and drying in air, the obtained solid was calcined at 823 K in the air for 13 h.2.3. Fabrication of 2-naphthol solid nanosphere material
The synthesis of the nanosphere material is displayed in Scheme 1. The nanosphere material was fabricated via a direct approach, where 1.0 g of grounded porous silica was mixed with 55 mg of 2-naphthol in 45 mL ethanol solution and agitated for 6 h. After complete separation, the mesoporous nanosphere material was rinsed with water several times to check leaching of the organic compound. The highest anchoring was optimized to obtain the maximum adsorption capacity by the nanosphere materials. Then the nanosphere material was dried in an oven at 55 °C for 15 h. The 2-naphthol saturation amount was determined (1.6 mmol g−1) from the following equation:| Q = (C0 − C)V/m | (1) |
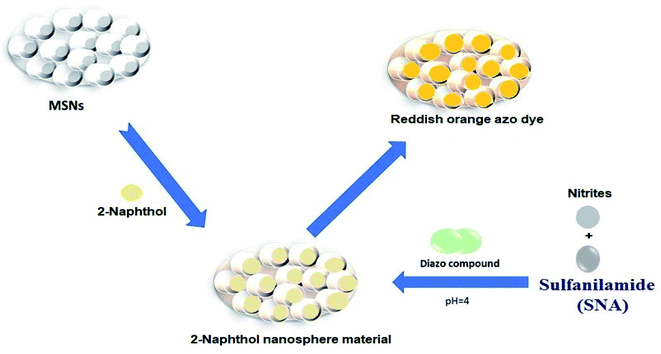 | ||
| Scheme 1 Schematic illustration of SNA capture by the nanosphere material fabricated using 2-naphthol ligand and MSNs. | ||
2.4. SNA detection procedures
The visual detection of SNA using the nanosphere material was carried out in a wide pH range. In each fraction, the SNA concentration and nanosphere material content (10 mg) were the same, and the solution pH was varied in the range of 2.0 to 12.0, where the solution volume was 25 mL, and the amount of sodium nitrate added was 5 mg. Then the solution mixture was shaken by a mechanical shaker for 10 min. Subsequently the solid nanosphere material was isolated by suction filtration. The color assessment was carried out by optical vision, DIC techniques and absorption spectroscopy.2.5. SNA detection by digital imaging approach
A Sony Z2 mobile camera (20 mega pixels) was used and the color scanning scales were also determined. The detection features of each image were transformed into color coordinates using Adobe Photoshop. Here, an elliptical region was determined in the middle position of the image using the ‘‘Crop’’ tool as defined by the “Elliptical Marquee Tool” and the different intensities of each image were gained with the ‘‘Histogram” tool. Then the data was exported to Microsoft Excel, and the Origin Pro was used for data interpretation and measurement.2.6. Instruments
The absorption intensity of the material was recorded using a Shimadzu UV-2600 solid-state spectrophotometer. Small-angle X-ray diffraction (SAXRD) was conducted on an X'Pert PRO PANalytical instrument with CuKα radiation (λ = 1.54060 Å). N2 adsorption–desorption isotherms were obtained using a Quantachrom Autosorb. Before the analysis, each sample was degassed at 90 °C for 3 h. The total surface areas including pore size and volume were determined according to a reported method. FESEM images were accumulated using a Zeiss Leo Supra55 microscope. HR-TEM images were captured using a Tecnai G20, FEI, Netherlands. The SNA concentration was determined via GC-MS. A trace GC ultra-gas chromatograph (THERMO Scientific Corp., Waltham, MA, USA) was coupled with a thermo mass spectrometer detector (ISQ Single Quadrupole Mass Spectrometer). The GC-MS system was equipped with a TG-5MS column (30 m × 0.25 mm i.d., 0.25 μm film thickness). The other protocol was in standard mode.3. Results and discussion
3.1. The properties of the mesoporous nanospheres (MSNs)
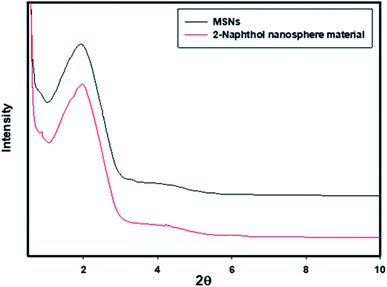
Porous silica materials, which were used as a carrier for the ligand, should have favorable characteristics regarding mesoporous structure, surface area, porosity and pores volumes. These characteristics enable mesoporous silica to enhance the properties of the organic ligand such as selectivity and sensitivity. Therefore, initially, we investigated the effect of the ligand on the characteristics of silica mesoporous itself by comparing the characteristics of silica before and after modification of it surface with the desired organic ligand.The XRD small-angle patterns of the MSNs and the nanosensor (Fig. 1) show a broad peak at 2θ ≈ 2.2°, which indicates the existence of a long-range and periodic mesostructure, and this pattern was not affected by the immobilization of the organic ligand. Thus, the immobilization process does not affect the mesostructure pattern or its order.
From the N2 adsorption–desorption data, the mesoporous silica exhibited a type IV isotherm, with a shaky adsorption step of p/po = 0.1 and broad hysteresis loop at p/po = 0.25–1.0, as shown in Fig. 2A. The data compiled indicate a bimodal mesostructure, as depicted in Fig. 2B. The pore size was 3.5 nm, which indicated that the mesoporous silica template was made of CTAB. On the other hand, the wide pore size of around 20 nm was also evident of the superfluous ethyl ether on the CTAB surfactants.38,39 This confirmed that the extended pore on the silica surface subsequently shrunk to a mesostructure.
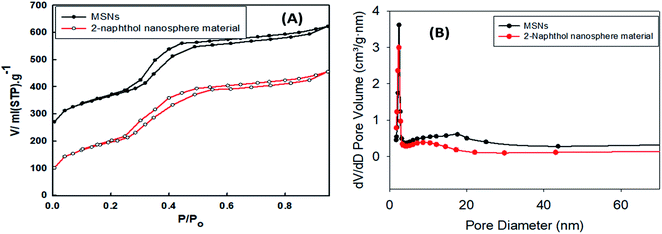 | ||
| Fig. 2 N2 adsorption–desorption isotherms (A) and pore size distribution (B) of silica MSNs and the ligand-modified nanosphere material. | ||
The N2 isotherms data is depicted in Fig. 2A, where the total surface area of the carrier mesoporous silica was higher than the ligand-anchored nanosphere material, as expected. The total surface area of the silica materials and the ligand-immobilized nanosphere material was 983.22 and 810.11 m2 g−1, respectively. Similarly, the pore volume decreased after the modification, with values of 1.159 and 0.857 cm3 g−1 for the carrier inorganic silica and the ligand-embedded nanosphere material, respectively. The reduction in the surface area and pore volume is attributed to the stacking due to the anchoring of the 2-naphthol, which was embedded and scattered on the surface of the carrier silica. Also, the results indicate that the nanosphere material maintains its mesostructure, which is vital for the access of 2-naphthol into the inorganic silica. The pore distribution of the pristine and 2-naphthol-embedded silica was around 3.81 and 3.077 nm in diameter, respectively, as shown in Fig. 2B.
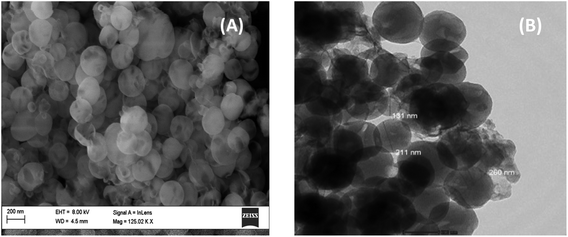
The FESEM image of the silica sample is depicted in Fig. 3A. According to the FESEM images, the particles exhibited a spherical morphology. It also demonstrated that the particle size was in the range of 150–250 nm, which is consistent with the TEM images shown in Fig. 3B.
3.2. Effect of solution pH
The potential and extreme performance of the as-fabricated ligand nanosphere material were affected by solution pH, reaction time, complexation mechanism, the amount of fabricate material and reaction conditions.40–42 In the detection system, the material homogeneity also enhanced the color formation and signal intensity in terms of significant color visualization by the naked eye. The signal intensity upon the addition of SNA to the nanosphere material was affected by the solution acidity, and the results are shown in Fig. 4. Optical color formation and high absorbance were observed at pH 4.0. This is because the strong complexation of [SNA-2-naphthol]n+ is expected in this pH region. It should be noted that the SNA concentration, solution volume and other parameters were the same in each pH fraction. The adsorption pH was also the same as that of the detection pH for the nanosphere material. Therefore, pH 4.0 was selected as the optimum pH to define the other experimental parameters in this study.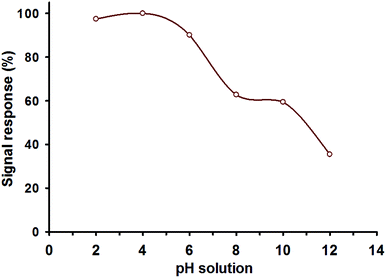 | ||
| Fig. 4 SNA detection by the nanosphere material, where the solution pH was varied, and the others parameter were fixed. | ||
3.3. Optical detection of SNA using nanosphere material
The developed nanosphere material showed a remarkable improvement in both sensitivity and selectivity for SNA. The current nanosphere material exhibited the advanced features of the MSNs after immobilization of the organic ligand. The prepared nanosphere material was highly sensitive, even with the addition of an ultra-trace amount of SNA. With an increase in SNA concentration, the color was optimized and similarly the absorbance signal intensity increased, as concluded from Fig. 5. Thus, the data indicates that the chemical nanosphere material offers easy recognition for both the quantification and visual color formation of SNA without using highly sophisticated apparatus. However, the colorimetric studies utilized signal measurement by UV-vis spectroscopy, which enabled the quantitative detection of a specific recognition range (DR) in the SNA detection system.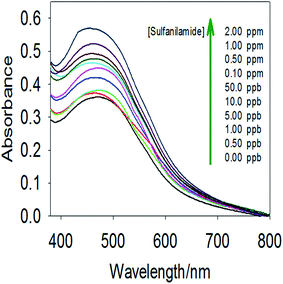 | ||
| Fig. 5 Increasing signal intensity based on the color optimization of the nanosphere material with an increase in the concentration of SNA at pH 4.0. | ||
3.4. Low limit detection and quantification
The calibration data was plotted in the low-level concentration range, as defined in Fig. 5, and data showed a linear correlation, as shown in Fig. 6. The graph confirmed that SNA monitoring was possible in a broad concentration range with extreme sensitivity. The limit of detection (LD) and quantitation (LQ) were determined from the following equation.27,29| LD or LQ = kSb/m | (2) |
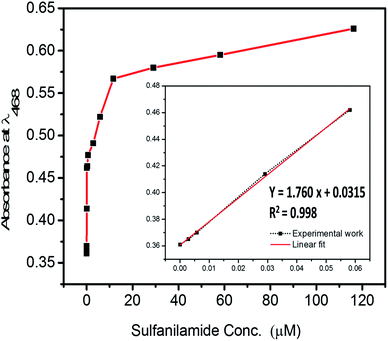 | ||
| Fig. 6 Determination of limit of detection and quantification according to the calibration graphs of the nanosphere material at 468 nm with varying SNA concentrations. | ||
3.5. Ion-selectivity study for potentiality
To use any materials in practical operation, their ion selectivity and competing ion effect are key factors to judge their performance from a scientific point of view. In contaminated water, many compounds or substances co-exist, and many of them adversely affect the target substance, ion detection or adsorption. Thus, we tested the selectivity of the proposed nanosphere material towards vanillin, glucose, lactose, starch, and sucrose, and the results confirmed that they did not interfere (data are not shown) in the selective detection operation under suitable conditions.3.6. Structural stability of the nanosphere material
Long-term structural stability is an important criterion for large-scale use. Thus, the proposed nanosphere material was stored for six months in the dark to evaluate its stability.38,41 It should be noted that the color of the material can change due to light; thus it was stored in the dark. Subsequently, the material color and morphology were examined, and no remarkable changes were observed. Therefore, the nanosphere material can retain its functionality even after several months of storage for SNA detection from contaminated water.3.7. Adsorption isotherms and capacity
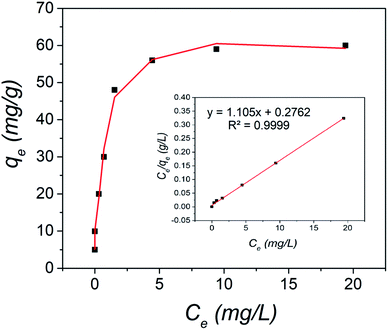
Optimum adsorption is related to the nature of binding between the target ions and the proposed material surface. Ion-exchange fibrous adsorbents and ligand exchange materials form hydrogen bonds for specific ion adsorption from contaminated solution, with high kinetic performances.46–48 Then we determined the equilibrium capacity for SNA adsorption by the nanosphere material. The SNA concentration was varied in the range of 1.0 to 50 mg L−1, and the solution volume was kept constant at 50 mL. In addition, the amount of nanosphere material was fixed at 10 mg, and the solution pH was 4.0. The results are shown in Fig. 7. The adsorption of SNA increased with an increase in the initial SNA concentration, and then plateaued, as shown in Fig. 7. Then the maximum adsorption of SNA was estimated using different adsorption isotherm models. The nanosphere material was highly porous even after ligand anchoring, and thus it was expected that the Langmuir adsorption model will well-fit the results, where the specific homogenous site of the nanosphere material was open. The Langmuir isotherm model corresponds with the adsorbed ions occupying open functional sites, and no binding can be observed on the occupied surface sites. In addition, monolayer adsorption occurs with homogeneity. Therefore, the maximum adsorption capacity was determined from the following Langmuir isotherm equation:49| Ce/qe = Ce/qm + 1/KLqm | (3) |
3.8. Colorimetric quantification by digital image-based method
The quantification of colored images by digital images is an advanced technique to determine the limit of detection and limit of quantification. In the color optimization based on the concentration effect, the image in Table 1 was considered. The images were optimized with a variety of intensities based on the color formed after the addition of SNA at different concentrations to the nanosphere material. It was observed that as the concentration of SNA increased, the optimized color was displayed in the images, and then the mean integer value for each RGB component dramatically decreased, as expected.The green component of the nanosphere material was reduced with an increase in concentration of SNA, as shown in Fig. 8. However, the red and blue components were reduced less compared to the green component with an increase in SNA concentration. Basically, the green color is the integral of the red color, resulting in the highest absorbance intensity according to the hypothetical test observation. To construct a similar curve to that in Fig. 7, the color intensity was determined for each fraction using the following equation:
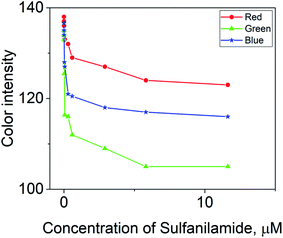 | ||
| Fig. 8 Combination of different concentrations of SNA with mean integer value for particular RGB component intensity. | ||
The relation between AX and the individual concentration of SNA was measured and the data is summarized in Fig. 9, which is consistent with the results in Fig. 6. In addition, a linear value was also determined according to the mean integer for the particular RGB component and the amount of SNA, as depicted in Fig. 10. The data clarified that the nanosphere material can detect SNA with extreme sensitivity, even at ultra-trace levels. According to the DIC method, the limits of detection (LD) and limit of quantification (LQ) were 0.07 μg L−1 and 0.23 μg L−1, respectively. These values are comparable to the spectrometry method of limit of detection (LD: 0.27 μg L−1) and limit of quantification (LQ: 91 μg L−1). Thus, it is assumed that the DIC method is also competitive for the quantification of substances and ions, as evidenced by the quantification of SNA in this study.
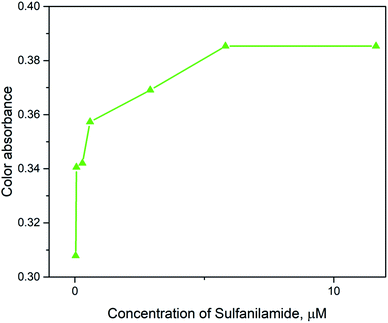 | ||
| Fig. 9 Combination of various concentrations of SNA with mean integer value for distinct RGB component absorbance. | ||
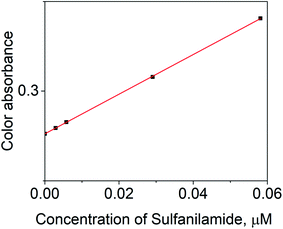 | ||
| Fig. 10 Calibration graph of the linear correlation, which is consistent with the mean integer value of each RGB component absorbance and the different amounts of SNA. | ||
4. Conclusions
Herein, we were fabricated a mesoporous nanosphere material by anchoring a ligand onto a porous silica material for the sensitive and selective monitoring and adsorptive removal of toxic sulfanilamide (SNA) from contaminated water. The nanosphere material consisted of orderly pore with a large surface area for the successful treatment of SNA. The experimental parameters were systematically optimized for both the recognition and removal systems. The optimized pH was 4.0 in both cases of monitoring and adsorption. The accumulated data confirmed that highly sophisticated instrumentation is not necessary for the capturing of SNA from contaminated water. The Digital Image-Based Colorimetric (DIC) method was also evaluated, and the data were also compared with the spectrophotometric method. The limits of detection and quantification were 0.27 and 0.91 μg L−1, respectively based on the spectrophotometric method. On the other hand, the limits of detection and quantification were 0.07 and 0.23 μg L−1, respectively, based on the DIC approach. Therefore, both strategies have potential for the rapid and sensitive capturing of SNA according to the data presented. The data was completely consistent with Langmuir adsorption isotherms, and the highest determined capacity was 79.20 mg g−1. Thus, this promising experimental data is encouraging to the scientific community for the potential real-time application of novel nanosphere materials for the detection and removal of SNA on a large scale.Conflicts of interest
There are no conflicts to declare.Acknowledgements
We thank the Science & Technology Development Fund (STDF) in Egypt through (Project ID 5939), Suez University. We also thank the Suez Nirite Co., Salah Neseeim Street, El Zaytiat, Suez, Egypt, for their helpful allowing for the determination of the examined ions. The authors also want to thank the anonymous reviewers and editor for their helpful suggestions, remarks, and enlightening comments.References
- S. Louis, Sulfanilamide, Sigma-Aldrich, Inc., 2013 Search PubMed.
- Sulfanilamide, http//www.wikipedia, the free encyclopedia, 2009 Search PubMed.
- Company: Sigma-Aldrich Chemie GmbH, "Sulfanilamide" sigma-aldrich.com, 2013.
- M. Kent, Advanced Biology”, Oxford University Press, 2000 p.46 Search PubMed.
- A. V. Herrera-Herrera, J. Hernandez-Borges, M. M. Afonso, J. A. Palenzuela and M. A. Rodriguez-Delgado, Talanta, 2013, 116, 695–703 CrossRef CAS PubMed.
- M. M. Waleed, N. D. H. Khaleel, G. M. Hadad, R. A. Abdel-Salam and A. Haiss, Clean: Soil, Air, Water, 2013, 41, 907–916 Search PubMed.
- H. Shaaban and T. Górecki, J. Sep. Sci., 2011, 35, 216–224 CrossRef PubMed.
- M. C. Icardo, J. V. G. Mateo, M. F. Lozano and J. M. Calatayud, Anal. Chim. Acta, 2003, 499, 57–69 CrossRef CAS.
- S. Betageri, M. Kulkarni, K. H. Shivaprasad and M. Shivshankar, Der. Pharma. Chemica, 2011, 3, 227–235 Search PubMed.
- M. Tuzen, O. D. Uluozlu, D. Mendil, M. Soylak, L. O. R. Machado, W. N. L. dos Santos and S. L. C. Ferreira, Food Chem., 2018, 245, 380–384 CrossRef CAS PubMed.
- E. Yilmaz and M. Soylak, Talanta, 2017, 174, 605–609 CrossRef CAS PubMed.
- S. Khan, T. G. Kazi and M. Soylak, J. Ind. Eng. Chem., 2015, 27, 149–152 CrossRef CAS.
- (a) T. A. Sheikh, M. N. Arshad, M. M. Rahman, A. M. Asiri, H. M. Marwani, M. R. Awual and W. A. Bawazir, Inorg. Chim. Acta, 2017, 464, 157–166 CrossRef CAS; (b) S. H. Teo, A. Islam, E. S. Chan, S. Y. T. Choong, N. H. Alharthi, Y. H. Taufiq-Yap and M. R. Awual, J. Cleaner Prod., 2019, 208, 816–826 CrossRef CAS; (c) M. Ali, A. J. Mian, M. N. Islam, M. R. Awual, S. F. E-Karim and A. M. S. Chowdhury, Indian J. Fibre Text. Res., 2001, 26, 414–417 CAS; (d) T. A. Sheikh, M. M. Rahman, A. M. Asiri, H. M. Marwani and M. R. Awual, J. Ind. Eng. Chem., 2018, 66, 446–455 CrossRef CAS.
- (a) K. Abbas, H. Znad and M. R. Awual, Chem. Eng. J., 2018, 334, 432–443 CrossRef CAS; (b) M. R. Awual, N. H. Alharthi, M. M. Hasan, M. R. Karim, A. Islam, H. Znad, M. A. Hossain, M. E. Halim, M. M. Rahman and M. A. Khaleque, Chem. Eng. J., 2017, 324, 130–139 CrossRef CAS; (c) M. R. Awual, N. H. Alharthi, Y. Okamoto, M. R. Karim, M. E. Halim, M. M. Hasan, M. M. Rahman, M. M. Islam, M. A. Khaleque and M. C. Sheikh, Chem. Eng. J., 2017, 320, 427–435 CrossRef CAS; (d) S. A. El-Safty, M. A. Shenashen, M. Ismael, M. Khairy and M. R. Awual, Microporous Mesoporous Mater., 2013, 166, 195–205 CrossRef CAS.
- (a) M. R. Awual, Chem. Eng. J., 2015, 266, 368–375 CrossRef CAS; (b) M. R. Awual, T. Yaita, S. A. El-Safty, H. Shiwaku, S. Suzuki and Y. Okamoto, Chem. Eng. J., 2013, 221, 322–330 CrossRef CAS; (c) M. R. Awual, M. Ismael, T. Yaita, S. A. El-Safty, H. Shiwaku, Y. Okamoto and S. Suzuki, Chem. Eng. J., 2013, 222, 67–76 CrossRef CAS; (d) S. A. El-Safty, M. R. Awual, M. A. Shenashen and A. Shahat, Sens. Actuators, B, 2013, 176, 1015–1025 CrossRef CAS.
- (a) M. R. Awual, A. M. Asiri, M. M. Rahman and N. H. Alharthi, Chem. Eng. J., 2019, 363, 64–72 CrossRef CAS; (b) M. R. Awual, T. Yaita, H. Shiwaku and S. Suzuki, Chem. Eng. J., 2015, 276, 1–10 CrossRef CAS; (c) B. C. Roy, M. R. Awual and M. Goto, J. Appl. Biosci., 2007, 7, 1053–1060 CAS; (d) B. C. Roy, M. R. Awual and M. Goto, J. Appl. Biosci., 2006, 6, 411–415 CAS.
- (a) M. R. Awual, Chem. Eng. J., 2016, 300, 264–272 CrossRef CAS; (b) M. R. Awual, M. M. Hasan, T. Ihara and T. Yaita, Microporous Mesoporous Mater., 2014, 197, 331–338 CrossRef; (c) M. R. Awual, M. M. Hasan, M. A. Khaleque and M. C. Sheikh, Chem. Eng. J., 2016, 288, 368–376 CrossRef CAS; (d) M. R. Awual and T. Yaita, Sens. Actuators, B, 2013, 183, 332–341 CrossRef CAS.
- (a) M. R. Awual, M. Miyazaki, T. Taguchi, H. Shiwaku and T. Yaita, Chem. Eng. J., 2016, 291, 128–137 CrossRef CAS; (b) M. R. Awual, M. M. Hasan, G. E. Eldesoky, M. A. Khaleque, M. M. Rahman and M. Naushad, Chem. Eng. J., 2016, 290, 243–251 CrossRef CAS; (c) M. R. Awual, Chem. Eng. J., 2016, 289, 65–73 CrossRef CAS; (d) M. R. Awual and M. M. Hasan, Microporous Mesoporous Mater., 2014, 196, 261–269 CrossRef CAS.
- (a) M. R. Awual, M. M. Hasan, A. Shahat, M. Naushad, H. Shiwaku and T. Yaita, Chem. Eng. J., 2015, 265, 210–218 CrossRef CAS; (b) M. R. Awual, M. A. Khaleque, Y. Ratna and H. Znad, J. Ind. Eng. Chem., 2015, 21, 405–413 CrossRef CAS; (c) M. R. Awual and M. M. Hasan, J. Ind. Eng. Chem., 2015, 21, 507–515 CrossRef CAS; (d) M. R. Awual, M. M. Hasan and H. Znad, Chem. Eng. J., 2015, 259, 611–619 CrossRef CAS.
- Y. Han, Z. Xu and C. Gao, Adv. Funct. Mater., 2013, 23, 3693–3700 CrossRef CAS.
- X. Chen, K. F. Lam, S. F. Mak and K. L. Yeung, J. Hazard. Mater., 2011, 186, 902–910 CrossRef CAS PubMed.
- T. Jiang, W. Liu, Y. Mao, L. Zhang, J. Cheng, M. Gong, H. Zhao, L. Dai, S. i Zhang and Q. Zhao, Chem. Eng. J., 2015, 259, 603–610 CrossRef CAS.
- G. Zhao, J. Li, X. Ren, C. Chen and X. Wang, Environ. Sci. Technol., 2011, 45, 10454–10462 CrossRef CAS PubMed.
- W. Sun, W. Pan, F. Wang and N. Xu, Chem. Eng. J., 2015, 273, 353–362 CrossRef CAS.
- R. E. C. Torrejos, G. M. Nisola, M. J. Park, H. K. Shon, J. G. Seo, S. Koo and W. J. Chung, Chem. Eng. J., 2015, 264, 89–98 CrossRef CAS.
- (a) M. R. Awual and M. Ismael, Sens. Actuators, B, 2014, 196, 457–466 CrossRef CAS; (b) M. R. Awual, M. A. Khaleque, M. Ferdows, A. M. S. Chowdhury and T. Yaita, Microchem. J., 2013, 110, 591–598 CrossRef CAS; (c) M. R. Awual, M. M. Hasan and M. A. Khaleque, Sens. Actuators, B, 2015, 209, 194–202 CrossRef CAS; (d) M. R. Awual, M. M. Hasan, M. Naushad, H. Shiwaku and T. Yaita, Sens. Actuators, B, 2015, 209, 790–797 CrossRef CAS.
- (a) S. A. El-Safty, A. Shahat, M. R. Awual and M. Mekawy, J. Mater. Chem., 2011, 21, 5593–5603 RSC; (b) M. R. Awual and M. M. Hasan, Sens. Actuators, B, 2014, 202, 395–403 CrossRef CAS; (c) M. R. Awual and M. M. Hasan, Sens. Actuators, B, 2015, 206, 692–700 CrossRef CAS; (d) M. R. Awual, T. Yaita, Y. Miyazaki, D. Matsumura, H. Shiwaku and T. Taguchi, Sci. Rep., 2016, 6, 19937, DOI:10.1038/srep19937.
- (a) M. R. Karim, M. O. Aijaz, N. H. Alharth, H. F. Alharbi, F. S. Al-Mubaddel and M. R. Awual, Ecotoxicol. Environ. Saf., 2019, 169, 479–486 CrossRef CAS PubMed; (b) M. Naushad, Z. A. ALOthman, M. R. Awual, M. M. Alam and G. E. Eldesoky, Ionics, 2015, 21, 2237–2245 CrossRef CAS; (c) M. N. Arshad, T. A. Sheikh, M. M. Rahman, A. M. Asiri, H. M. Marwani and M. R. Awual, J. Organomet. Chem., 2017, 827, 49–55 CrossRef CAS; (d) M. R. Awual, J. Ind. Eng. Chem., 2014, 20, 3493–3501 CrossRef CAS.
- (a) S. A. El-Safty, M. A. Shenashen, M. Ismael, M. Khairy and M. R. Awual, Analyst, 2012, 137, 5278–5290 RSC; (b) M. R. Awual, T. Yaita, S. A. El-Safty, H. Shiwaku, Y. Okamoto and S. Suzuki, Chem. Eng. J., 2013, 222, 172–179 CrossRef CAS; (c) M. R. Awual, T. Yaita and H. Shiwaku, Chem. Eng. J., 2013, 228, 327–335 CrossRef CAS; (d) M. R. Awual, M. Ismael, M. A. Khaleque and T. Yaita, J. Ind. Eng. Chem., 2014, 20, 2332–2340 CrossRef CAS.
- (a) S. A. El-Safty, A. Shahat and M. R. Awual, J. Colloid Interface Sci., 2011, 359, 9–18 CrossRef CAS PubMed; (b) M. R. Awual, T. Yaita and Y. Okamoto, Sens. Actuators, B, 2014, 203, 71–80 CrossRef CAS; (c) H. Znad, K. Abbas, S. Hena and M. R. Awual, J. Environ. Chem. Eng., 2018, 6, 218–227 CrossRef CAS; (d) M. R. Awual, T. Kobayashi, Y. Miyazaki, R. Motokawa, H. Shiwaku, S. Suzuki, Y. Okamoto and T. Yaita, J. Hazard. Mater., 2013, 252–253, 313–320 CrossRef CAS PubMed.
- R. Yueming, X. Wei and M. Zhang, J. Hazard. Mater., 2008, 158, 14–22 CrossRef PubMed.
- M. Ghaedi, H. Hossainian, M. Montazerozohori, A. Shokrollahi, F. Shojaipour, M. Soylak and M. K. Purkait, Desalination, 2011, 281, 226–233 CrossRef CAS.
- B. Kemer, D. Ozdes, A. Gundogdu, V. N. Bulut, C. Duran and M. Soylak, J. Hazard. Mater., 2009, 168, 888–894 CrossRef CAS PubMed.
- (a) M. R. Awual, T. Kobayashi, H. Shiwaku, Y. Miyazaki, R. Motokawa, S. Suzuki, Y. Okamoto and T. Yaita, Chem. Eng. J., 2013, 225, 558–566 CrossRef CAS; (b) M. R. Awual, G. E. Eldesoky, T. Yaita, M. Naushad, H. Shiwaku, Z. A. AlOthman and S. Suzuki, Chem. Eng. J., 2015, 279, 639–647 CrossRef CAS; (c) M. R. Awual, S. Suzuki, T. Taguchi, H. Shiwaku, Y. Okamoto and T. Yaita, Chem. Eng. J., 2014, 242, 127–135 CrossRef CAS; (d) M. R. Awual, T. Yaita, T. Taguchi, H. Shiwaku, S. Suzuki and Y. Okamoto, J. Hazard. Mater., 2014, 278, 227–235 CrossRef CAS PubMed.
- (a) M. R. Awual, M. Khraisheh, N. H. Alharthi, M. Luqman, A. Islam, M. R. Karim, M. M. Rahman and M. A. Khaleque, Chem. Eng. J., 2018, 343, 118–127 CrossRef CAS; (b) A. Shahat, H. M. A. Hassan, M. F. El-Shahat, O. El Shahawy and M. R. Awual, Chem. Eng. J., 2018, 334, 957–967 CrossRef CAS; (c) M. R. Awual, I. M. M. Rahman, T. Yaita, M. A. Khaleque and M. Ferdows, Chem. Eng. J., 2014, 236, 100–109 CrossRef CAS; (d) A. Shahat, H. M. A. Hassan, H. M. E. Azzazy, E. A. El-Sharkawy, H. M. Abdou and M. R. Awual, Chem. Eng. J., 2018, 332, 377–386 CrossRef CAS.
- A. Naeem, M. T. Saddique, S. Mustafa, S. Tasleem, K. H. Shah and M. Waseem, J. Hazard. Mater., 2009, 172, 124–128 CrossRef CAS PubMed.
- (a) M. M. Alam, A. M. Asiri, M. T. Uddin, M. A. Islam, M. R. Awual and M. M. Rahman, New J. Chem., 2019, 43, 4849–4858 RSC; (b) M. M. Rahman, T. A. Sheikh, A. M. Asiri and M. R. Awual, New J. Chem., 2019, 43, 4620–4632 RSC; (c) M. M. Rahman, M. M. Alam, A. M. Asiri and M. R. Awual, New J. Chem., 2017, 41, 9159–9169 RSC.
- (a) A. Shahat, M. R. Awual, M. A. Khaleque, M. Z. Alam, M. Naushad and A. M. S. Chowdhury, Chem. Eng. J., 2015, 273, 286–295 CrossRef CAS; (b) A. Shahat, M. R. Awual and M. Naushad, Chem. Eng. J., 2015, 271, 155–163 CrossRef CAS; (c) M. R. Awual, T. Yaita, S. Suzuki and H. Shiwaku, J. Hazard. Mater., 2015, 291, 111–119 CrossRef CAS PubMed; (d) M. R. Awual, M. Ismael and T. Yaita, Sens. Actuators, B, 2014, 191, 9–18 CrossRef CAS.
- G. D. Christian, Analytical Chemistry, Wiley, New York, 6th edn, 2003 Search PubMed.
- (a) M. R. Awual, Chem. Eng. J., 2017, 307, 85–94 CrossRef CAS; (b) M. R. Awual, Chem. Eng. J., 2017, 307, 456–465 CrossRef CAS; (c) M. R. Awual, Chem. Eng. J., 2016, 303, 539–546 CrossRef CAS; (d) M. R. Awual, M. Hasan and A. Shahat, Sens. Actuators, B, 2014, 203, 854–863 CrossRef CAS.
- (a) M. R. Awual, A. Islam, M. M. Hasan, M. M. Rahman, A. M. Asiri, M. A. Khaleque and M. C. Sheikh, J. Cleaner Prod., 2019, 224, 920–929 CrossRef CAS; (b) M. R. Awual, M. M. Hasan, A. M. Asiri and M. M. Rahman, J. Mol. Liq., 2019, 283, 704–712 CrossRef CAS; (c) M. M. Hussain, M. M. Rahman, A. M. Asiri and M. R. Awual, RSC Adv., 2016, 6, 80511–80521 RSC; (d) A. M. Mazrouaa, N. A. Mansour, M. Y. Abed, M. A. Youssif, M. A. Shenashen and M. R. Awual, J. Environ. Chem. Eng., 2019, 7, 103002, DOI:10.1016/j.jece.2019.103002.
- (a) M. R. Awual, M. M. Hasan, M. M. Rahman and A. M. Asiri, J. Mol. Liq., 2019, 283, 772–780 CrossRef CAS; (b) M. R. Awual, J. Mol. Liq., 2019, 284, 502–510 CrossRef CAS; (c) M. R. Awual, Mater. Sci. Eng., C, 2019, 101, 686–695 CrossRef CAS PubMed; (d) M. R. Awual, J. Environ. Chem. Eng., 2019, 7(3), 103087 CrossRef CAS; (e) R. M. Kamel, A. Shahat, W. H. Hegazy, E. M. Khodier and M. R. Awual, J. Mol. Liq., 2019, 285, 20–26 CrossRef CAS.
- A. M. Mohamed, H. F. Askal and G. M. Saleh, J. Pharm. Biomed. Anal., 1991, 9, 531–538 CrossRef CAS PubMed.
- G. R. Rao, S. S. N. Murthy, P. J. Rao and I. R. K. Raju, Indian Res. J. Pharm. Sci., 1988, 50, 138–140 CAS.
- A. G. Fogg and N. M. Fayad, Anal. Chim. Acta, 1979, 106, 365–367 CrossRef CAS.
- (a) A. Shahat, H. M. A. Hassan, H. M. E. Azzazy, M. Hosni and M. R. Awual, Chem. Eng. J., 2018, 331, 54–63 CrossRef CAS; (b) M. R. Awual, M. A. Hossain, M. A. Shenashen, T. Yaita, S. Suzuki and A. Jyo, Environ. Sci. Pollut. Res., 2013, 20, 421–430 CrossRef CAS PubMed; (c) M. R. Awual, M. A. Shenashen, T. Yaita, H. Shiwaku and A. Jyo, Water Res., 2012, 46, 5541–5550 CrossRef CAS PubMed; (d) M. R. Awual and A. Jyo, Desalination, 2011, 281, 111–117 CrossRef CAS.
- (a) M. R. Awual, A. Jyo, T. Ihara, N. Seko, M. Tamada and K. T. Lim, Water Res., 2011, 45, 4592–4600 CrossRef CAS PubMed; (b) M. R. Awual, A. Jyo, S. A. El-Safty, M. Tamada and N. Seko, J. Hazard. Mater., 2011, 188, 164–171 CrossRef CAS PubMed; (c) M. R. Awual, S. A. El-Safty and A. Jyo, J. Environ. Sci., 2011, 23, 1947–1954 CrossRef CAS; (d) M. R. Awual and A. Jyo, Water Res., 2009, 43, 1229–1236 CrossRef CAS PubMed.
- (a) M. R. Awual, S. Urata, A. Jyo, M. Tamada and A. Katakai, Water Res., 2008, 42, 689–696 CrossRef CAS PubMed; (b) M. R. Awual, M. A. Shenashen, A. Jyo, H. Shiwaku and T. Yaita, J. Ind. Eng. Chem., 2014, 20, 2840–2847 CrossRef CAS; (c) M. R. Awual, A. Jyo, M. Tamada and A. Katakai, J. Ion Exch., 2007, 18, 422–427 CrossRef CAS; (d) A. Jyo, M. R. Awual and K. Kobayashi, Soc. Chem. Ind., 2008, 487–494 Search PubMed.
- I. Langmuir, J. Am. Chem. Soc., 1918, 40, 1361–1403 CrossRef CAS.
- M. Kompany-Zareh, M. Mansourian and F. Ravaee, Anal. Chim. Acta, 2002, 471, 97–104 CrossRef CAS.
| This journal is © The Royal Society of Chemistry 2019 |

