 Open Access Article
Highly photoluminescent and temperature-sensitive P, N, B-co-doped carbon quantum dots and their highly sensitive recognition for curcumin†
Bin Wuab,
Xiaolong Liua,
Xiaofeng Shia,
Wei Hana,
Chunru Wang a and
Li Jiang
 *ab
*ab
aCAS Key Laboratory of Molecular Nanostructure and Nanotechnology, CAS Research/Education Center for Excellence in Molecular Sciences, Institute of Chemistry, Chinese Academy of Sciences (CAS), Beijing 100190, P. R. China. E-mail: jiangli@iccas.ac.cn
bUniversity of Chinese Academy of Sciences, Beijing 100049, P. R. China
First published on 13th March 2019
Abstract
Water-soluble P, N, B-co-doped carbon quantum dots (PNBCDs) synthesized using a convenient hydrothermal method exhibit many excellent features, such as strong fluorescence, excitation-independent emission, high monodispersity, good stability, and excellent water solubility with a fluorescence quantum yield of 21.95%. The as-prepared PNBCDs possessed remarkable selectivity and sensitivity towards curcumin with the linear range of 0–1.5 μmol L−1 and the detection limit for curcumin was 68 nmol L−1 (3σ/k). Additionally, the wonderfully reversible and repeatable sensitivity to external temperature makes it possible that the PNBCDs could be used as a biocompatible fluorescent ink and for thermo-sensitive devices.
1. Introduction
As a biologically active constituent of turmeric,1 curcumin exhibits diverse biological and pharmacological activities such as anti-inflammatory,2 antibacterial,3 hepatoprotective,4 anticarcinogenic,5 antioxidant6,7 and antidyspeptic8 properties. As a result, curcumin has been widely applied in pharmacology for many years. However, it also has been reported that curcumin can induce a significant increase in the frequency of chromosomal aberrations in Chinese hamster ovary (CHO) cells,9–14 which required that more attention should be paid to figure out the properties of that with a high-efficiency detection for curcumin as a precondition. Many detection methods, such as high-performance liquid chromatography,15 voltammetry,16 liquid–liquid microextraction17 and electrochemical techniques18 have been applied but usually require expensive equipment, intricate sample pretreatment or time-consuming operation. More highly-effective, economical and sensitive methods for curcumin detection are still in urgent demand.In recent years, carbon dots (CDs) as a novel photoluminescent nanomaterial have received extensive attention. Comparing with traditional semiconductor-based quantum dots with toxic heavy metals, CDs demonstrated many remarkable characteristics, such as high photostability, low toxicity, good biocompatibility as well as easy synthesis and functionalization,19 that have been applied in catalysis, chemical sensor, optoelectronic devices, bioimaging, etc.20–28 The doping of hetero atoms could modulate effectively band gap and electronic density of CDs as well as enhance the fluorescent quantum yield (QY) of CDs.29 Moreover, heteroatom-doped CDs also have shown great promises in various types of applications including cell imaging,30 fluorescent probe.31 Literatures have reported successful N and B doping in the CDs. The N atom is electron abundant and could act as a donor. On the other hand, the B atom is electron deficient, which is a good feature for being an acceptor. Thus, significant charge transfer is anticipated in the doped CDs. Moreover, the boron–carbon bond is longer than that of a carbon–carbon bond due to one less electron in bonding orbitals, resulting in weaker binding. Thus, a certain extent of chemical disorder could be expected, and the introduction of B renders fascinating optical properties and has wider scope of applications.32 It is also reported that the n-type donor of CDs can be realized via doping phosphorus, which contains lone pair electron, into the sp3-bonded carbon structure.33 Thus, we suppose that through simultaneously doping B, N and P, manipulation of electronic characteristics for CDs could be achieved.
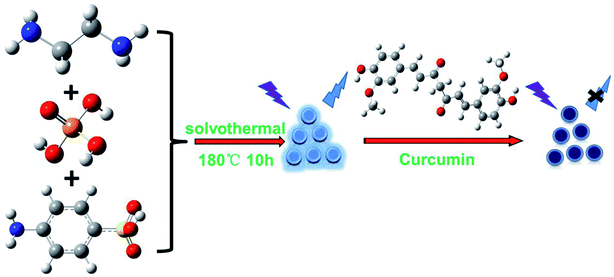
In our previous work, we reported a kind of N, P-co-doped CDs (PNCDs) with high fluorescent quantum yields of 25.47%, which could realize double detection of Cr(VI) and dopamine (DA).34 In this work, we further incorporating B atom into CDs to construct triple-doped CDs with tunable optical property for the first time, which was used as a fluorescent nanosensor for detecting curcumin. Unlike the previous carbon dots, we synthesized the N, P, B triple-doped carbon dots for the first time. Furthermore, compared to the previous few literatures on detection of curcumin, our carbon dots achieved ultra-high sensitivity to detection of curcumin (Scheme 1).
2. Experimental section
2.1 Materials
Ethylenediamine (EDA), phosphoric acid (H3PO4), curcumin (C21H20O6) and ascorbic acid (AA) were purchased from Aladdin Ltd. (Shanghai, China) and used without further purification. 4-Aminophenylboronic acid was obtained from Alfa Aesar (china) Chemical Co. Ltd and urea (CH4N2O) procured from Sigma-Aldrich. All the other reagents were obtained from Sinopharm Chemical Reagent Co., Ltd (Shanghai, China). All the chemicals were of analytical grade. Ultrapure water was used throughout all experiments.2.2 Synthesis of phosphorus/nitrogen/boron co-doped carbon quantum dots (PNBCDs)
The ethylenediamine (1 mL), H3PO4 (1 mL) and 4-aminophenylboronic acid (0.2 g) were rapidly dissolved and mixed into 50 mL of ultrapure water in a 100 mL Teflon equipped stainless steel autoclave with vigorous stirring at room temperature to form a homogeneous solution for 30 min. After that, Teflon equipped stainless steel autoclave was placed in oven and heated at 180 °C for 10 h. After being cooled to room temperature, the products were purified using a 0.22 μm filtration membrane to remove non-fluorescent deposits. The purification of the filtrate was dialyzed in dialysis bag with MWCO of 500 Da (Shanghai Baoman Biological technology Co., Ltd) for roughly 24 h to remove impurities. Finally, PNBCDs solution in medium brown were collected and lyophilized to obtain the dry PNBCDs product.2.3 Characterization
The transmission electron microscopic (TEM) images were obtained on a JEOL JEM-2100F transmission electron microscopy (Tokyo, Japan). The X-ray photoelectron spectra (XPS) were recorded on a Kratos AXIS ULTRA DLD X-ray photoelectron spectrometer (Tokyo, Japan). The Fourier transform infrared spectra (FTIR) were acquired on a Bruker Tensor II FTIR spectrometer (Bremen, Germany). The UV-vis fluorescence spectra of PNBCDs were performed on a Lambda 950 absorption spectrophotometer (PerkinElmer, Llantrisant, UK) and Hitachi F-4500 spectrofluorometer (Tokyo, Japan) which was coupled with a thermostatic bath to control the sample temperature with an accuracy of ±1 °C (the temperature range investigated was from 25 °C to 60 °C), respectively. Nanosecond fluorescence lifetime assays were recorded by FLS 980 fluorescence spectrometer time-correlated single-photon counting (TCSPC) system (Edinburgh Instruments Ltd, England). The quantum yields (QYs) of the as-prepared carbon dots were examined using quinine sulfate in 0.1 M H2SO4 (literature QYs: 54.6%) as the standard sample by comparing the integrated fluorescence intensities (excitation at 310 nm) and absorbance values at 310 nm of the carbon dots aqueous solutions with those of quinine sulfate, which was determined by FLS 980 spectrophotometer.352.4 Determination of curcumin with PNBCDs based fluorescent nanosensor
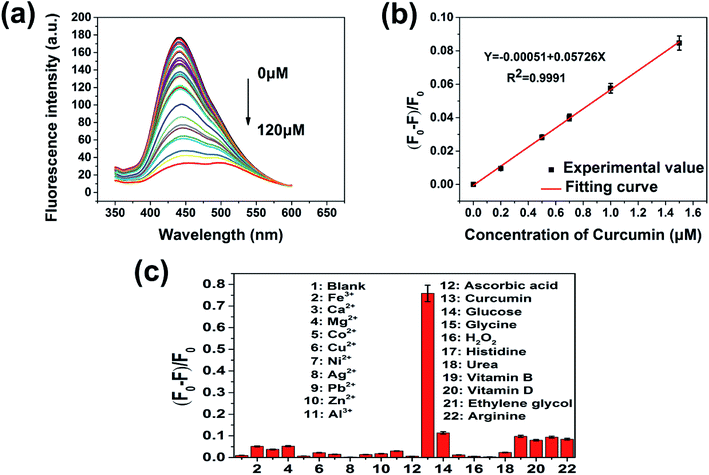
The concentration of PNBCDs in 0.01 M PBS buffer solution (pH 7.4) was 0.30 mg mL−1. The detection of curcumin was carried out in aqueous solution at room temperature when curcumin was dissolved in ethyl alcohol to form homogeneous solution and other metal ions and biological micromolecule stock solutions were prepared by dissolving appropriate amounts of metal salts in ultrapure water, respectively. Then different volume curcumin solutions were added into PNBCDs solution drop by drop and a series of calculated concentration (0, 0.2, 0.5, 0.7, 1, 1.5, 3, 5, 6, 7, 8, 9, 10, 12, 14, 16, 18, 20, 30, 40, 50, 60, 70, 80, 90, 100, 120 μM) were prepared. After solution mixed to equilibrium, the PL spectra were recorded (λex = 311 nm) when PL emission maintained stabilization. The relative fluorescence intensity (F0 − F)/F0 versus curcumin concentration was used for calibration. Here, F0 and F are the fluorescence intensities of the PNBCDs in the absence and presence of curcumin, respectively. The selectivity of PNBCDs-based nanoprobe for curcumin was assessed by adding other interferents containing (Ca2+, Fe3+, Mg2+, Co2+, Cu2+, Ni2+, Ag+, Pb2+, Zn2+, Al3+ and ascorbic acid, glucose, glycine, H2O2, histidine, urea, vitamin B, vitamin D, ethylene glycol, arginine) instead of curcumin in a same way. The final concentration of all the metal ions and biological micromolecule were all 100 μM.3. Results and discussion
3.1 Characterization of PNBCDs
Fig. 1a shows the TEM images of the as-made PNBCDs. The relatively monodisperse PNBCDs which are black spots in Fig. 1a, are quasi-spherical with average diameter of 5.74 nm. Meanwhile, the high-resolution TEM (HRTEM) images (the inset images of Fig. 1b) show that PNBCDs sample possesses the crystalline structure with lattice spacing of 0.23 nm, which are very close to the (100) diffraction planes of graphite.36,37 AFM image was displayed in Fig. S1a.† It can be seen that well-dispersed quantum dots were produced. The corresponding AFM image indicates that the PNBCDs are approximately 2.7 nm in diameter and quasi-spherical shape. The height profile in Fig. S1b† shows that the mean typical topographic height of the PNBCDs is about 3.5 nm.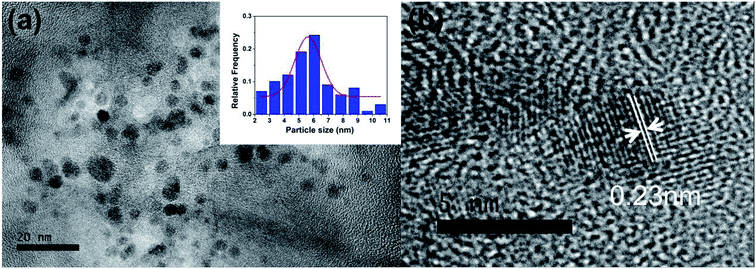 | ||
| Fig. 1 (a) TEM image of PNBCDs; inset images are magnification of a single nanoparticle. (b) The particle size distribution histograms of PNBCDs. | ||
Chemical and structural information about the PNBCDs was further investigated from the FTIR spectra. Fig. S2† shows the FTIR spectrum of PNBCDs. Firstly, a strong and broad peak corresponding to a free O–H or N–H stretching vibration at 3438 cm−1 for PNBCDs was observed, which originated in hydroxyl or amine groups on the surface.38,39 Peaks at 1569 cm−1, 1659 cm−1 and 2854 cm−1 displayed the existence of the C![[double bond, length as m-dash]](https://www.rsc.org/images/entities/char_e001.gif) N stretching vibrations, C
N stretching vibrations, C![[double bond, length as m-dash]](https://www.rsc.org/images/entities/char_e001.gif) O or C
O or C![[double bond, length as m-dash]](https://www.rsc.org/images/entities/char_e001.gif) C stretching vibrations and C–H stretching vibrations, respectively.39,40 Other characteristic peaks identified with phosphorus and oxygen-containing groups, such as P–OH bending (2495–2748 cm−1), hydrogen-bonded P
C stretching vibrations and C–H stretching vibrations, respectively.39,40 Other characteristic peaks identified with phosphorus and oxygen-containing groups, such as P–OH bending (2495–2748 cm−1), hydrogen-bonded P![[double bond, length as m-dash]](https://www.rsc.org/images/entities/char_e001.gif) O (1141 cm−1) and P–O–C (aromatic) (1080 cm−1) were obtained.40–42 The obvious absorption bands located at 1204 and 1025 cm−1 could be in accord with the B–O–H bending vibration and the B–O–H deformation vibration, respectively.43
O (1141 cm−1) and P–O–C (aromatic) (1080 cm−1) were obtained.40–42 The obvious absorption bands located at 1204 and 1025 cm−1 could be in accord with the B–O–H bending vibration and the B–O–H deformation vibration, respectively.43
The XPS spectra showed that the PNBCDs samples both include mainly carbon, nitrogen, phosphorus, boron and oxygen (Fig. 2a), confirming introduction of N, P and B into the CDs. The C1s peak of PNBCDs-160 exhibited four predominant peaks at284.9 eV, 285.8 eV, 286.5 eV, 286.5 eV and 289 eV, which are attributed to C![[double bond, length as m-dash]](https://www.rsc.org/images/entities/char_e001.gif) C/C–C, C–OH/C–O–C, C
C/C–C, C–OH/C–O–C, C![[double bond, length as m-dash]](https://www.rsc.org/images/entities/char_e001.gif) N and O–C
N and O–C![[double bond, length as m-dash]](https://www.rsc.org/images/entities/char_e001.gif) O groups, respectively (Fig. 2b).44 The N1s spectrum showed the characteristic peaks at 399.2 eV, 400.4 eV and 401.2 eV were associated with pyridinic, pyrrolic and graphitic N (Fig. 2c).45,46 The B1s spectrum of BNCDs in Fig. 2d displayed four distinct peaks at 192.5 eV, 191.4 eV, 190.5 eV, and 189.5 eV were assigned to B–O, B–CO2, B–N and B–C3, respectively.47,48 The surface components of the PNBCDs characterized by XPS are in agreement with the FT-IR analysis, which convictively suggest the successful synthesis of PNBCDs.
O groups, respectively (Fig. 2b).44 The N1s spectrum showed the characteristic peaks at 399.2 eV, 400.4 eV and 401.2 eV were associated with pyridinic, pyrrolic and graphitic N (Fig. 2c).45,46 The B1s spectrum of BNCDs in Fig. 2d displayed four distinct peaks at 192.5 eV, 191.4 eV, 190.5 eV, and 189.5 eV were assigned to B–O, B–CO2, B–N and B–C3, respectively.47,48 The surface components of the PNBCDs characterized by XPS are in agreement with the FT-IR analysis, which convictively suggest the successful synthesis of PNBCDs.
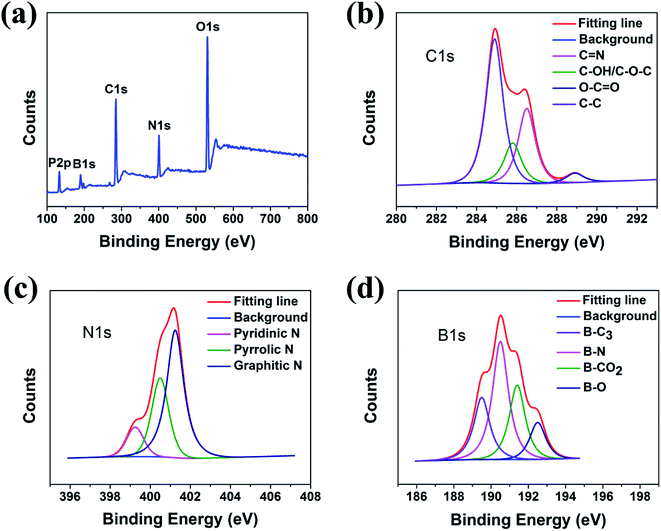 | ||
| Fig. 2 (a) Full-scan XPS spectra of PNBCDs. High-resolution XPS spectra of C1s (b), N1s (c) and B1s (d) peaks for PNCDs. | ||
3.2 The stability of the as-prepared PNBCDs
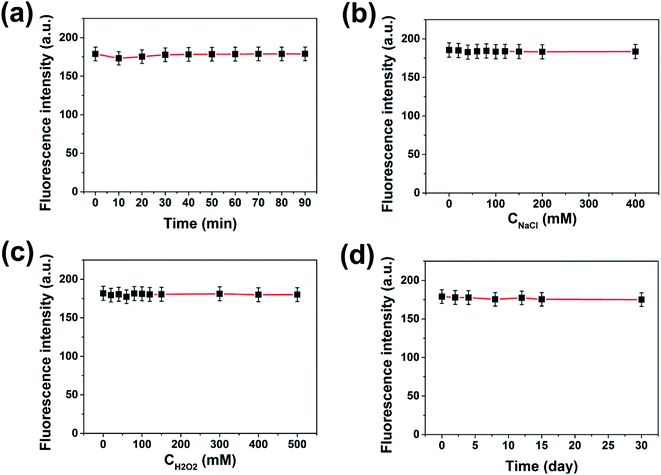
When the carbon dots are used for practical sensing applications, good water solubility and fluorescence stability are quite necessary. XPS and FT-IR analysis have proved that the prepared PNBCDs were intrinsically water-soluble because of abundant oxygen-rich functional groups in the structures. To investigate the fluorescence stability, the influences of various conditions on the carbon dots were studied. As shown in Fig. 3a, their fluorescence intensities remained unchanged under UV irradiation for 90 min, indicating that the PNBCDs possessed excellent tolerance for photobleaching. Additionally, their fluorescence intensities did not change with increasing concentrations of NaCl in aqueous solution (up to 400 mM) in Fig. 3b, suggesting high stability of the PNBCDs even under the high ionic-strength conditions. For Fig. 3c, the antioxidant capacity of the PNBCDs was investigated by changing the concentration of H2O2, the results revealed that the as-made PNBCDs had very strong fluorescence intensity even if the concentration of H2O2 was as high as 500 mM. Furthermore, there were also no fade significantly in color and fluorescence intensities for PNBCDs after 1 month storage at room temperature (Fig. 3d), showing their excellent photostability and chemical stability.3.3 Optical properties of PNBCDs
To further explore the optical properties of PNBCDs, their optical properties were examined with their PL spectra and UV-Vis absorption spectra at room temperature. Fig. 4a–c revealed the UV-Vis absorption spectra of PNBCDs and fluorescence emission spectra of PNBCDs. The UV/vis spectrum exhibited two absorption peaks centered at 237 and 283 nm, which were attributed to the π–π* transition of the aromatic sp2 domains (Fig. 4a).49 Simultaneously, the absorption peaks at 396 nm were probably ascribed to the n–π* transition of the C![[double bond, length as m-dash]](https://www.rsc.org/images/entities/char_e001.gif) O/C
O/C![[double bond, length as m-dash]](https://www.rsc.org/images/entities/char_e001.gif) N groups on the surface of the PNBCDs.50 In fluorescence spectra, the PNBCDs had maximal excitation and emission wavelengths at 311 nm and 441 nm. Moreover, the QYs of the as-prepared PNBCDs were calculated to be 21.95%.35 Meanwhile, with the increasing excitation wavelength from 291 to 361 nm, the corresponding PL emission peaks kept unchanged for the PNBCDs, indicating that PL of PNBCDs was excitation-independent in Fig. 4b. This phenomenon may due to the homogeneous distribution of same emissive trap sites, the high degree of consistency in particle size and small amount of multi fluorescence components in PNBCDs.
N groups on the surface of the PNBCDs.50 In fluorescence spectra, the PNBCDs had maximal excitation and emission wavelengths at 311 nm and 441 nm. Moreover, the QYs of the as-prepared PNBCDs were calculated to be 21.95%.35 Meanwhile, with the increasing excitation wavelength from 291 to 361 nm, the corresponding PL emission peaks kept unchanged for the PNBCDs, indicating that PL of PNBCDs was excitation-independent in Fig. 4b. This phenomenon may due to the homogeneous distribution of same emissive trap sites, the high degree of consistency in particle size and small amount of multi fluorescence components in PNBCDs.
 | ||
| Fig. 4 (a) UV-vis absorption (blue line), PL excitation (green line) and emission (red line) spectra of PNBCDs in aqueous solution (0.30 mg mL−1). (b) Excitation-dependent PL behavior of PNBCDs. | ||
3.4 Fluorescence response of PNBCDs towards curcumin
In view of the pH and ionic strength effect on the fluorescence response of PNBCDs towards curcumin, the pH and ionic strength influence on the PNBCDs responding to curcumin was investigated in Fig. S3.† As shown in Fig. S3a,† after addition of curcumin with concentration is 20 μmol L−1, quenching efficiency increased with pH increase and had a maximum value at pH 7, and then decreased as the pH increased above 7. Thus, the experiments that followed were set at pH 7.4. Additionally, in the same condition, quenching efficiency did not obviously change with increasing concentrations of NaCl in aqueous solution (up to 400 mM) in Fig. S3b,† suggesting high ionic-strength had barely effect on the response of PNBCDs to curcumin. To ensure the presented PNBCDs-based nanoprobe can be used for highly sensitive quantification of curcumin, the fluorescence responses were carried out with the PNBCDs in the PBS solution (pH = 7.4). A series of fluorescence emission spectra were obtained upon the addition of curcumin ranging from 0 μM to 120 μM. Fig. 5a clearly illustrated that the fluorescence of PNBCDs solution decreased gradually with increase of curcumin concentration. There was an excellent linear relationship between the quenching efficiency (F0 − F/F0) and the concentration of curcumin in the range from 0 to 1.5 μM as shown in Fig. 5b with calibration equation as follows: F0 − F/F0 = −0.00051 + 0.05726[c] (R2 = 0.9991), where F0 and F are the fluorescence intensities of PNBCDs at λex of 311 nm without and with curcumin, respectively. Meanwhile c (mol L−1) represents the concentration of curcumin. The limit of detection (LOD) was calculated to be 68 nM in a similar manner. (LOD = 3σ/S, where σ is represents standard deviation of the blank PNBCDs sample recorded (N = 10) and S is the slope of the calibration curve). In order to evaluate the detection specificity of the proposed detection system, the selectivity of the PNBCDs toward curcumin was investigated in the PBS solution (pH = 7.4), to examine the interference of different metal ions and biological micromolecule. At the same concentration of 100 μM, significant fluorescence quenching effect was observed with the addition of curcumin, whereas, other various metal ions and biological micromolecule (Ca2+, Fe3+, Mg2+, Co2+, Cu2+, Ni2+, Ag+, Pb2+, Zn2+, Al3+ and ascorbic acid, glucose, glycine, H2O2, histidine, urea, vitamin B, vitamin D, ethylene glycol, arginine) did not cause obvious fluorescence changes as shown in Fig. 5c. These results prove that this determination system displayed an outstanding selectivity toward curcumin sensing.3.5 Mechanism of PNBCDs quenching
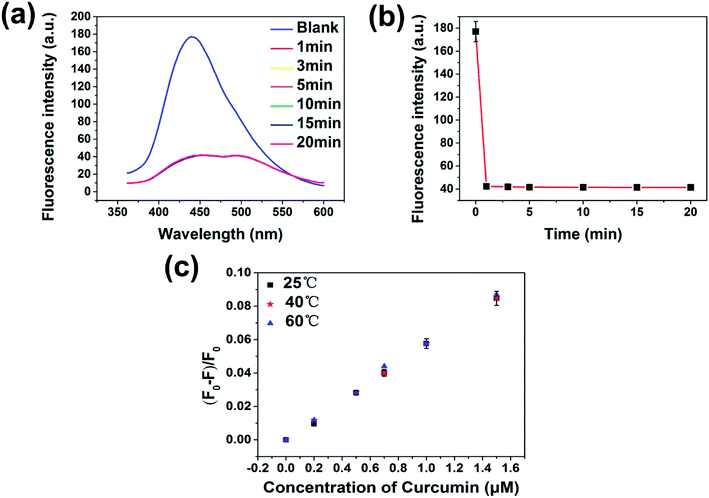
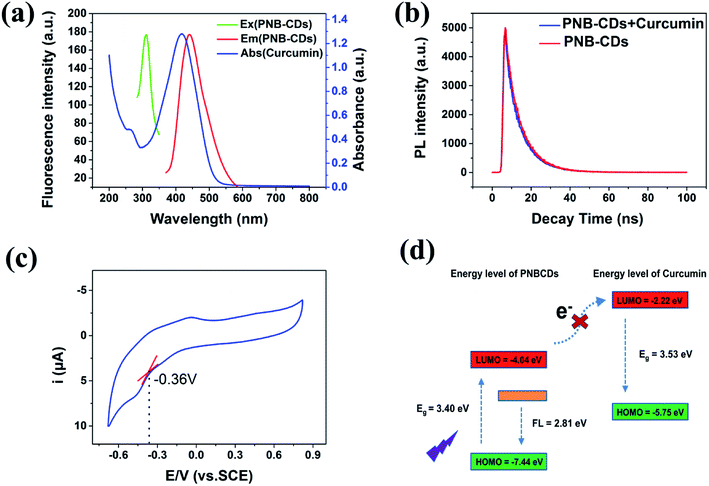
Kinetic studies show that the fluorescence quenching of curcumin is relatively fast; the fluorescence of the PNBCDs was almost completely quenched within 1 min after adding the curcumin into the system (Fig. 6). However, no time-dependent fluorescence changes were observed for the PNBCDs themselves in solution in the absence of curcumin, implying that the time-independent changes depicted in Fig. 6a and b originate from the curcumin-filtering fluorescence quenching of PNBCDs. In addition, the fluorescence intensity ratios at different temperatures were tested and are exhibited in Fig. 6c. As the reaction temperature increases, the fluorescence intensity ratios induced by different concentrations of curcumin almost keep unchanged, which further demonstrates the IFE-induced fluorescence quenching.In order to figure out the PL quenching mechanism of PNBCDs against interfering substances, the possible mechanism was performed through a series of experiments. Usually, emission spectra of PNBCDs showed quite precise overlapping with the absorption band of curcumin so that curcumin could absorb the emission light of PNBCDs (Fig. 7a). The spectral overlapping suggested that the fluorescence change might be related to the energy transfer, IFE process, or electron transfer.51–53 Both the decay curves fitted with third order exponential curve were shown in Fig. 7b. The calculated average lifetime of the PNBCDs in the absence and presence of 100 μM curcumin at 310 nm excitation is found to be all 8.21 ns. The almost no lifetime change of the PNBCDs indicated that there is no significant excited-state interaction between PNBCDs and curcumin (Fig. 7b), indicating that no energy transfer happened between PNBCDs and curcumin.54 Also, curcumin is negatively charged, and electrostatic interaction could never take place between PNBCDs and curcumin. This can support our demonstration that the fluorescence sensing would be distinctly based on the IFE rather than other possible approaches.
To evaluate the Highest Occupied Molecular Orbital (HOMO) and Lowest Unoccupied Molecular Orbital (LUMO) energy levels of PNBCDs, cyclic voltammetry (CV) has been carried out by using a standard three electrode system, which was made up of glassy carbon as the working electrode, a Pt-wire counter electrode and an Ag/AgCl reference electrode. By using cyclic voltammetry with the potential sweeping between −1.5 V and 1.0 V at a scan rate of 0.1 V s−1, ECL signals of the PNBCDs (0.3 mg mL−1) are recorded in DMF containing 0.1 M (Bu)4NBF4 as the supporting electrolyte (Fig. 7c).
The HOMO and LUMO energy levels and the initial potentials for the oxidation (EOx) and reduction (ERed) of BGQDs can be depicted by the empirical formula:55
| ELOMO = −e(ERed + 4.4) | (1) |
| EHOMO = −e(EOx + 4.4) | (2) |
| EHOMO = ELOMO − Eg | (3) |
The ERed was determined to be ∼0.36 V (vs. SCE) from the cyclic voltammogram of the BGQDs (Fig. 7c). The corresponding ELOMO was calculated to be −4.04 eV. The EHOMO could not be estimated from eqn (2) due to the irreversible of the oxidation behaviour. However, the EHOMO could be estimated using eqn (3). To determine the HOMO levels of PNBCDs, we combine ERed with the optical energy band gap (Eg, resulting from the absorption edge in the absorption spectrum), which is estimated to be 3.4 eV. So the EHOMO of PNBCDs is calculated to be −7.44 eV. Meanwhile, the EHOMO and ELUMO of curcumin could be calculated as −5.75 eV and −2.22 eV obtained from DFT calculations. Obviously, as shown in Fig. 7d, it is impossible for the electron in the LUMO of the PNBCDs to transfer to the LUMO of the curcumin.
Moreover, the Stern–Volmer's model53 was used to model the quenching kinetics of PNBCDs with curcumin.
| F0/F = 1 + Ksv[c] = 1 + Kqτ0[c] | (4) |
At the same time, considering the unshifted absorption band of curcumin in the presence of PNBCDs, no complex formation or energy transfer existed between PNBCDs and curcumin (Fig. S4†).56 Consequently, IFE was the only possible dominated reason for the fluorescence quenching of PNBCDs induced by curcumin.
3.6 Construction of thermo-sensitive sensor based temperature-responsive reversibility and stable fluorescent ink
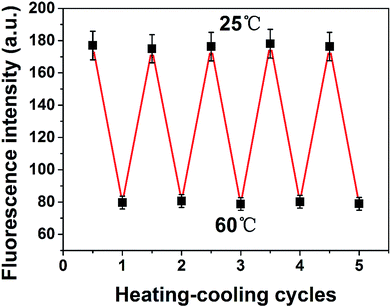
It is demonstrated that the reproducibility of PNBCDs fluorescence intensity corresponding to the temperature variation as shown in Fig. 8. After experiencing five cycles from heating (at 60 °C) to cooling (at 25 °C) cycles, PNBCDs show a temperature-dependent on–off PL property. Importantly, the intensity of PNBCDs can almost revert back to the original value. The good reversibility make PNBCDs present a bright future to be a thermo-sensitive sensor. This phenomenon is due to that with increased temperature, the movement of carbon dots in solution accelerated, increasing the probability of collision, which caused a plurality of carbon dots to agglomerate into large particles. Aggregation into large particles caused the fluorescence intensity to be quenched. Conversely, when the temperature was lowered to room temperature, the agglomerated large particles were dispersed into small carbon dots, so that the fluorescence intensity is restored. Moreover, application of PNCDs as a fluorescent ink for display purposes was investigated in Fig. S5† and experimental result showed that PNCDs ink is clear, permanent, pollution free, and easily washable. Therefore, PNCDs ink might be an alternative and potential application for fluorescent pens.3.7 Detection of curcumin in real samples
To deeply investigate the practicability, the sensing of curcumin in mineral water and tap water were performed. The real samples were spiked with curcumin at different concentration levels and then analyzed with the proposed method. As shown in Table 1, the recoveries for the selective detections of spiked curcumin in mineral water and tap water were in the ranges of 101% to 105% and 95% to 102%, respectively. Therefore, the proposed method with high sensitivity and selectivity can detect curcumin accurately in real samples.| Sample | Spiked concentration (μM) | Total found (μM) | Recovery (%) N = 3 | RSD (%) N = 3 |
|---|---|---|---|---|
| Mineral water | 0 | Not found | — | — |
| 0.2 | 0.21 | 105 | 1.27 | |
| 0.5 | 0.52 | 104 | 1.73 | |
| 1 | 1.01 | 101 | 0.87 | |
| Tap water | 0 | Not found | — | — |
| 0.2 | 0.19 | 95 | 0.49 | |
| 0.5 | 0.51 | 102 | 0.96 | |
| 1 | 0.95 | 95 | 0.76 |
Finally, we compared this work with the reported work for detecting curcumin as shown in Table 2. PNBCDs in our work showed excellent limit of detection (LOD) although linear range was less satisfying than that of others. But it is believed that excellent detection limit offers a good platform for an ultra-highly sensitive fluorescent probe for the quantitative determination of curcumin, which could broaden practical applications in detection of water and soil pollutants.
4. Conclusions
PNBCDs were successfully prepared in a one-step hydrothermal treatment of ethylenediamine, H3PO4 and 4-aminophenylboronic acid. The prepared PNBCDs nanosensors possessing excellent optical and chemical properties were verified to be a highly sensitive and selective sensor for curcumin. Meanwhile, the PNBCDs show a reversible and repeatable sensitivity to external temperature, which display potential applications in thermo-sensitive devices.Conflicts of interest
There are no conflicts to declare.Acknowledgements
The authors thank the financial support by the National Natural Science Foundation of China (Grant No. 21673257, 51472248, and 51672281).References
- S. Shome, A. Das Talukdar, M. Dutta Choudhury, M. K. Bhattacharya and H. Upadhyaya, J. Pharm. Pharmacol., 2016, 68, 1481–1500 CrossRef CAS PubMed.
- N. Pourreza and H. Golmohammadi, RSC Adv., 2015, 5, 1712–1717 RSC.
- Y. Wang, Z. X. Lu, H. Wu and F. X. Lv, Int. J. Food Microbiol., 2009, 136, 71–74 CrossRef CAS PubMed.
- S. Rahmani, S. Asgary, G. Askari, M. Keshvari, M. Hatamipour, A. Feizi and A. Sahebkar, Phytother. Res., 2016, 30, 1540–1548 CrossRef CAS PubMed.
- A. A. Momtazi and A. Sahebkar, Curr. Pharm. Des., 2016, 22, 4386–4397 CrossRef CAS PubMed.
- D. Banji, J. Pinnapureddy, O. J. F. Banji, A. Saidulu and M. S. Hayath, Eur. J. Pharmacol., 2011, 668, 293–298 CrossRef CAS PubMed.
- P. Pizzo, C. Scapin, M. Vitadello, C. Florean, L. Gorza and J. Cell, Mol. Med., 2010, 14, 970–981 CAS.
- A. Khonche, O. Biglarian, Y. Panahi, G. Valizadegan, S. S. Soflaei, M. E. Ghamarchehreh, Y. Panahi, S. S. Soflaei, M. Majeed and A. Sahebkar, Drug Res., 2016, 66, 444–448 CrossRef CAS PubMed.
- B. Kocaadam and N. Sanlier, Crit. Rev. Food Sci. Nutr., 2017, 57, 2889–2895 CrossRef CAS PubMed.
- S. S. S. Wang, K. N. Liu and W. H. Lee, Biophys. Chem., 2009, 144, 78–87 CrossRef CAS PubMed.
- K. N. Liu, C. M. Lai, Y. T. Lee, S. N. Wang, R. P. Y. Chen, J. S. Jan, H. S. Liu and S. S. S. Wang, Biochim. Biophys. Acta, Gen. Subj., 2012, 1820, 1774–1786 CrossRef CAS PubMed.
- M. S. Borana, P. Mishra, R. R. S. Pissurlenkar, R. V. Hosur and B. Ahmad, Biochim. Biophys. Acta, Proteins Proteomics, 2014, 1844, 670–680 CrossRef CAS PubMed.
- M. Mouslmani, J. M. Rosenholm, N. Prabhakar, M. Peurla, E. Baydoun and D. Patra, RSC Adv., 2015, 5, 18740–18750 RSC.
- M. Rahimi, P. Hashemi and F. Nazari, Anal. Chim. Acta, 2014, 826, 35–42 CrossRef CAS PubMed.
- G. K. Ziyatdinova, A. M. Nizamova and H. C. Budnikov, J. Anal. Chem., 2012, 67, 591–594 CrossRef CAS.
- S. P. Singh, W. Wahajuddin and G. K. Jain, J. Bioanal. Biomed., 2010, 2, 79–84 CAS.
- P. Daneshgar, P. Norouzi, A. A. Moosavi-Movahedi, M. R. Ganjali, E. Haghshenas, F. Dousty and M. Farhadi, J. Appl. Electrochem., 2009, 39, 1983–1992 CrossRef CAS.
- S. N. Baker and G. A. Baker, Angew. Chem., Int. Ed., 2010, 49, 6726–6744 CrossRef CAS PubMed.
- Y. Q. Lin, C. Wang, L. B. Li, H. Wang, K. Y. Liu, K. Q. Wang and B. Li, ACS Appl. Mater. Interfaces, 2015, 7, 28346–28352 CrossRef PubMed.
- S. W. Zhang, H. H. Gao, X. Liu, Y. S. Huang, X. J. Xu, N. S. Alharbi, T. Hayat and J. X. Li, ACS Appl. Mater. Interfaces, 2016, 8, 35138–35149 CrossRef CAS PubMed.
- L. Zhang, Z. C. Ding, T. Tong and J. Liu, Nanoscale, 2017, 9, 3524–3529 RSC.
- R. Guo, S. Zhou, Y. Li, X. Li, L. Fan and H. V. Nicolas, ACS Appl. Mater. Interfaces, 2015, 7, 23958–23966 CrossRef CAS PubMed.
- Y. Y. Dai, Z. C. Liu, Y. F. Bai, Z. Z. Chen, J. Qin and F. Feng, RSC Adv., 2018, 8, 42246–42252 RSC.
- M. Chen, W. Wu, Y. Y. Chen, Q. Q. Pan, Y. Z. Chen, Z. F. Zheng, Y. J. Zheng, L. Y. Huang and S. H. Weng, RSC Adv., 2018, 8, 41432–41438 RSC.
- J. F. Wei, H. K. Li, Y. Yuan, C. Y. Sun, D. Hao, G. Zheng and R. Wang, RSC Adv., 2018, 8, 37028–37034 RSC.
- Y. F. Wang, F. L. Wang, Y. P. Feng, Z. J. Xie, Q. X. Zhang, X. Y. Jin, H. J. Liu, Y. Liu, W. Y. Lv and G. G. Liu, Dalton Trans., 2018, 47, 1284–1293 RSC.
- H. Xu, X. P. Yang, G. Li, C. Zhao and X. J. Liao, J. Agric. Food Chem., 2015, 63, 6707–6714 CrossRef CAS PubMed.
- A. M. Su, Q. M. Zhong, Y. Y. Chen and Y. L. Wang, Anal. Chim. Acta, 2018, 1023, 115–120 CrossRef CAS PubMed.
- J. Chen, J. Liu, J. Li, L. Xu and Y. Qiao, J. Colloid Interface Sci., 2017, 485, 167–174 CrossRef CAS PubMed.
- S. Zou, C. Hou, H. Fa, L. Zhang, Y. Ma, L. Dong, D. Li, D. Huo and M. Yang, Sens. Actuators, B, 2017, 239, 1033–1041 CrossRef CAS.
- A. B. Bourlinos, G. Trivizas, M. A. Karakassides, M. Baikousi, A. Kouloumpis, D. Gournis, A. Bakandritsos, K. Hola, O. Kozak, R. Zboril, I. Papagiannouli, P. Aloukos and S. Couris, Carbon, 2015, 83, 173–179 CrossRef CAS.
- Y. A. Kim, K. Fujisawa, H. Muramatsu, T. Hayashi, M. Endo, T. Fujimori, K. Kaneko, M. Terrones, J. Behrends, A. Eckmann, C. Casiraghi, K. S. Novoselov, R. Saito and M. S. Dresselhaus, ACS Nano, 2012, 6, 6293–6300 CrossRef CAS PubMed.
- J. Zhou, X. Shan, J. Ma, Y. Gu, Z. Qian, J. Chen and H. Feng, RSC Adv., 2014, 4, 5465–5468 RSC.
- B. Wu, X. F. Shi, W. Han, T. S. Wang, C. R. Wang and L. Jiang, RSC Adv., 2018, 8, 31793–31802 RSC.
- H. Zheng, Q. Wang, Y. Long, H. Zhang, X. Huang and R. Zhu, Chem. Commun., 2011, 47, 10650–10652 RSC.
- Y. Dong, N. Zhou, X. Lin, J. Lin, Y. Chi and G. Chen, Chem. Mater., 2010, 22, 5895–5899 CrossRef CAS.
- W. Kwon and S. W. Rhee, Chem. Commun., 2012, 48, 5256–5258 RSC.
- Z. A. Qiao, Y. Wang, Y. Gao, H. Li, T. Dai and Y. Liu, Chem. Commun., 2010, 8812–8814 RSC.
- A. Mandal, A. Dandapat and G. De, Analyst, 2012, 3, 765–772 RSC.
- X. Jin, X. Sun, G. Chen, L. Ding, Y. Li, Z. Liu, Z. Wang, W. Pan, C. Hu and J. Wang, Carbon, 2015, 81, 388–395 CrossRef CAS.
- X. Gong, Q. Hu, M. C. Paau, Y. Zhang, S. Shuang, C. Dong and M. M. F. Choi, Nanoscale, 2014, 6, 8162–8170 RSC.
- Z. Q. Xu, L. Y. Yang, X. Y. Fan, J. C. Jin, J. Mei, W. Peng, F. L. Jiang, Q. Xiao and Y. Liu, Carbon, 2014, 66, 351–360 CrossRef CAS.
- Y. Han, D. Tang, Y. Yang, C. Li, W. Kong, H. Huang, Y. Liu and Z. Kang, Nanoscale, 2015, 7, 5955–5962 RSC.
- X. Chen, Q. Jin, L. Wu, C. Tung and X. Tang, Angew. Chem., Int. Ed., 2014, 46, 12542–12547 Search PubMed.
- Y. Xu, M. Wu, Y. Liu, X. Z. Feng, X. B. Yin, X. W. He and Y. K. Zhang, Chem.–Eur. J., 2013, 19, 2276–2283 CrossRef CAS PubMed.
- S. Liu, J. Tian, W. Lei, Y. Zhang, X. Qin, Y. Luo, A. M. Asiri, A. O. AlYoubi and X. Sun, Adv. Mater., 2012, 24, 2037–2041 CrossRef CAS PubMed.
- M. Cattelan, S. Agnoli, M. Favaro, D. Garoli, F. Romanato and M. Meneghetti, Chem. Mater., 2013, 9, 1490–1495 CrossRef.
- T. F. Yeh, W. L. Huang, C. J. Chung, I. T. Chiang, L. C. Chen, H. Y. Chang, W. C. Su, C. Cheng, S. J. Chen and H. Teng, J. Phys. Chem. Lett., 2016, 7, 2087–2092 CrossRef CAS PubMed.
- S. Li, Y. Li, J. Cao, J. Zhu, L. Fan and X. Li, Anal. Chem., 2014, 86, 10201–10207 CrossRef CAS PubMed.
- S. Chen, X. Hai, X. W. Chen and J. H. Wang, Anal. Chem., 2014, 86, 6689–6694 CrossRef CAS PubMed.
- H. Zhu, F. Lu, X. C. Wu and J. J. Zhu, Analyst, 2015, 140, 7622–7628 RSC.
- M. Q. Yu, H. Wang, F. Fu, L. Y. Li, J. Li, G. Li, Y. Song, M. T. Swihart and E. Q. Song, Anal. Chem., 2017, 89, 4085–4090 CrossRef CAS PubMed.
- M. Lin, H. Y. Zou, T. Yang, Z. X. Liu, H. Liu and C. Z. Huang, Nanoscale, 2016, 8, 2999–3007 RSC.
- H. J. Zhang, Y. L. Chen, M. J. Liang, L. F. Xu, S. D. Qi, H. L. Chen and X. G. Chen, Anal. Chem., 2014, 86, 9846–9852 CrossRef CAS PubMed.
- B. Liang, C. Jiang, Z. Chen, X. Zhang, H. Shi and Y. Cao, J. Mater. Chem., 2006, 16, 1281–1286 RSC.
- J. Li, X. Li, X. Shi, X. He, W. Wei, N. Ma and H. Chen, ACS Appl. Mater. Interfaces, 2013, 5, 9798–9802 CrossRef CAS PubMed.
- Y. Shi, C. Y. Li, S. P. Liu, Z. F. Liu, J. H. Zhu, J. D. Yang and X. L. Hu, RSC Adv., 2015, 5, 64790–64796 RSC.
- M. M. F. Baig and Y. C. Chen, J. Colloid Interface Sci., 2017, 501, 341–349 CrossRef CAS PubMed.
- B. Tang, L. Ma, H. Y. Wang and G. Y. Zhang, J. Agric. Food Chem., 2002, 50, 1355–1361 CrossRef CAS PubMed.
- M. J. Ansari, S. Ahmad, K. Kohli, J. Ali and R. K. Khar, J. Pharm. Biomed. Anal., 2005, 39, 132–138 CrossRef CAS PubMed.
Footnote |
| † Electronic supplementary information (ESI) available. See DOI: 10.1039/c9ra00183b |
| This journal is © The Royal Society of Chemistry 2019 |

