
 Open Access Article
 This Open Access Article is licensed under a Creative Commons Attribution-Non Commercial 3.0 Unported Licence
Large-scale and fast synthesis of nano-hydroxyapatite powder by a microwave-hydrothermal method†
Zhengwei Cai ab,
Xinyu Wang*ab,
Zongrui Zhangc,
Yingchao Han*ab,
Jing Luoab,
Mingzheng Huangab,
BoWen Zhangab and
Yuanjing Houab
ab,
Xinyu Wang*ab,
Zongrui Zhangc,
Yingchao Han*ab,
Jing Luoab,
Mingzheng Huangab,
BoWen Zhangab and
Yuanjing Houab
aState Key Laboratory of Advanced Technology for Materials Synthesis and Processing, Wuhan University of Technology, Wuhan 430070, China. E-mail: wangxinyu@whut.edu.cn; Fax: +86-27-87880734; Tel: +86-27-87651853
bBiomedical Materials and Engineering Research Center of Hubei Province, Wuhan 430070, China
cCollege of Biochemical Engineering, Anhui Polytechnic University, Wuhu, 241000, China
First published on 2nd May 2019
Abstract
A microwave-hydrothermal (M-H) method assisted with ultrasonic atomization precipitation was developed for large-scale and fast synthesis of nano-hydroxyapatite (nano-HAP) powder. This technology combines the uniform mixing effect of ultrasonic atomization precipitation at high concentration with the rapid and uniform heating effect of the M-H method, aiming to obtain a high quality product with low agglomeration, homogeneous size distribution, accurate stoichiometry, and high purity while improving the yield. The influences of reaction temperature, reaction time and reactant concentration on the formation of nano-HAP were investigated. The results show that the crystallinity increases significantly and the diameter of nano-HAP increases to some extent, but the length does not change obviously while the reaction temperature increase from 60 °C to 160 °C and the reaction time increases from 1 minute to 40 minutes respectively. The crystallinity, dispersion and crystal size of nano-HAP do not change obviously while the concentration of Na2HPO4·12H2O increases from 0.06 mol L−1 to 0.4 mol L−1. When the reaction temperature is 160 °C, the reaction time is 40 min, and the concentration of Na2HPO4·12H2O is 0.4 mol L−1, the yield of nano-HAP powder achieved a maximum yield (0.033 kg L−1). The obtained nano-HAP powder exhibits a uniform size and good dispersibility, with a size of 87.62 ± 22.44 nm and crystallinity of 0.92, respectively. This study indicates that the M-H method assisted with ultrasonic atomization precipitation is a facile one-pot method for the rapid and large-scale synthesis of highly crystalline, dispersible nano-HAP particles.
Introduction
Hydroxyapatite (Ca10(PO4)6(OH)2, HAP) is a major inorganic component of calcified tissues such as human bones and teeth.1 It has extensive application prospects owing to its excellent osteoconductive properties and biocompatibility.2 Generally, HAP is recognized as a good bone replacement material which can form strong chemical bonds with bone tissue and guide the growth of bone without stimulus response and rejection reaction on the tissue.3 Nano-HAP particles, with appropriate stoichiometry, morphology and purity, have stimulated great interest.4 The nano-HAP powder has a small particle size, a large specific surface area and a high chemical activity, which can remarkably reduce the sintering densification of ceramic materials and save energy.5 What's more, nano-HAP has been more widely used due to its excellent performance. It can be used as a carrier material for drugs, proteins and genes.6,7 Rare-earth doped nano-HAP has great potential as a fluorescent probe,8 and nano-HAP can be used as an adsorbent to purify waste.9 Some studies have also shown that nano-HAp can significantly reduce apoptotic cell death and hence improve cell proliferation and cellular activity related to bone growth.10There are several methods to synthesize nano-HAP such as hydrothermal,11–13 chemical precipitation,14 Sol–gel method15 and ultrasonic method.16 However, there're some problems limit the large-scale preparation and application remain in these methods such as the agglomeration and the nonuniform distribution of nano-HAP. Microwave-hydrothermal (M-H) method is an effective method to overcome these problems, which enables to synthesize the nano-powder with small particle sizes, high-purity and narrow size distribution in a short time.17 Compared with the general heating process, microwave heating can effectively reduce the thermal stress and the temperature gradient in heated materials, as a consequence, both the core and the surface of materials can be heated quickly and uniformly with high efficient energy transformation. Since then M-H method has successfully synthesized many types of nano-materials including inorganic, metallic, polymeric nano-structures and their composites.18–20 The preparation of nano-HAP with M-H method has important economic and efficiency significance.21–23 M-H method was only used to prepare a small amount of nano-HAP.24,25 It is effective to increase the reactant concentration so as to achieve large-scale preparation of nano-HAP powders. However, it may cause severe agglomeration of the nanocrystals.
Ultrasonic chemistry is a new method for preparing ultrafine powder materials, which can accelerate and control chemical reactions by ultrasonic cavitation.26 Ultrasonic atomization precipitation method can sufficiently mix the reactants, which may be reducing product agglomeration under high concentration of reactants. In this work, M-H method assisted with ultrasonic atomization precipitation was developed for large-scale and fast synthesis of nano-HAP power. The effects of reaction time, reaction temperature and reactant concentration on crystal size, crystallinity, morphology and crystal dispersion of nano-HAP were investigated.
Experimental
Synthesis of nano-HAP power
A 100 mL volume of different concentrations of calcium chloride solution (CaCl2·2H2O, Aldrich Chemical, 99.995%) (0.1 mol L−1, 0.2 mol L−1, 0.334 mol L−1, 0.668 mol L−1 and 0.835 mol L−1) was added to an equal volume of different concentrations of disodium hydrogen phosphate solution (Na2HPO4·12H2O, Aldrich Chemical, 99.995%) (0.06 mol L−1, 0.12 mol L−1, 0.2 mol L−1, 0.4 mol L−1 and 0.5 mol L−1) by ultrasonic nebulizer at a flow rate of 7 mL min−1, and maintain the solution having a Ca/P molar ratio of 1.67. In this process, NH3·H2O is added to the solution to keep the pH of the solution at 10. After vigorously stirring for three minutes, the mixed solution was transferred to Teflon reactors of the Master-14 (SINEO, China, frequency = 2450 ± 50 MHz). The heating rate is 7 °C min−1 when the temperature is below 120 °C, and the heating rate is 10 °C min−1 when the temperature range is over 120 °C. The solution is heated to the set temperature (60, 80, 100,120, 140, 160 and 180 °C) and then maintained at this temperature for 1–50 minutes. After reaction, the solution was cooled to room temperature, it was washed five times with deionized water and then freeze-dried for 24 hours to obtain powder sample.In the first group, the two reactants, 0.668 mol L−1 calcium chloride solution and 0.4 mol L−1 disodium hydrogen phosphate solution, were directly mixed and then reacted at 160 °C for 40 minutes by hydrothermal reaction. The heating rate is 7 °C min−1.In the second groups, the mixed two reactants same as first control group were further treated by ultrasonic nebulizer at a flow rate of 7 mL min−1. In the third groups, the two reactants, the same as the concentration of the first group of reactants, were directly mixed and then reacted at 160 °C for 40 minutes by M-H method.
In this study, nano-HAP powders synthesized by M-H method (nano-HAPM-H) were compared with nano-HAP synthesized by hydrothermal method (nano-HAPH) provided by Nanjing Epry Nanomaterials Co., Ltd. The nano-HAPH powder is the smallest size nano-HAP powder of the company and has been industrially produced. Two kinds of powders were formed by cold isostatic pressing under 180 MPa pressure for 20 minutes by dry pressing, and then sintered in a muffle furnace (SX2-4-10, China) without pressure. The sintering temperature is 1200 °C, the holding time is 30 minutes, and the heating rate is 10 °C min−1.
Characterization
XRD patterns of the prepared sample were determined by Powder X-ray Diffraction (D8 Advance, Bruker) with CuKα radiation (λ = 0.154184 nm), which were recorded in the 2θ range of 5–80°. The crystallinity degree and crystallite size of the sample can be calculated from the information provided by the XRD patterns. The formula for calculating the crystallinity of HAP powder is as follows:| Xc = 1 − (V112/300/I300) | (1) |
Xhkl = kλ/β1/2![[thin space (1/6-em)]](https://www.rsc.org/images/entities/char_2009.gif) cosθ cosθ
| (2) |
The functional groups and purity of the synthetic sample can be determined by Fourier Transform Infrared Spectroscopy (FT-IR, Nexus, Thermo Nicolet, USA) in the wave number region 400–4000 cm−1.
Scanning Electron Microscopy (SEM, JEM-7500F, JEOL, Japan) was utilized to morphological and microstructural analyses of HAP powder.
The morphology and crystalline structure of nano-HAP were observed in detail by high resolution transmission electron microscopy (HRTEM, JEM2100F, JEOL, Japan).
In order to obtain the size distribution of nano-HAP powder, Dynamic Light Scattering (DLS) was used. 10 mg of nano-HAP powder was dispersed in 10 mL of distilled water with 4 mg of sodium polyacrylate, and then ultrasonicated for 10 minutes to obtain transparent suspension.
The thermal analysis of synthesized nano-HAp powders was determined by Thermo Gravimetric Analysis-Differential Scanning Calorimeter (TG-DSC, STA449F3, NETZSCH, Germany).
The bending strength of ceramics is tested by a universal testing machine (Instron 5967, China). The bending strength is calculated using the three-point bending method. The formula is as follows: R = (3F × L)/(2b × h × h). The F is the breaking load, L is the fulcrum span (the span of the fulcrum in this experiment is 30 mm), b is the width of the sample to be tested, and h is the thickness of the sample to be tested.
Osteoblast were obtained from China Center for Type Culture Collection (CCTCC) of Wuhan University. Cells were maintained in a complete DMEM medium with 10% fetal bovine serum. The nano-HAP suspension was diluted to the concentration range of 0.025–0.2 mg mL−1 by using culture media. Cells were inoculated in 96-well plate at a density of 4000 cells per well, then transferred to 37 °C and 5% CO2 incubator at 95% humidity for 24 hours. Then, the original culture medium of 96-well plate was removed and fresh culture medium containing nano-HAP was added. The cells were cultured with nano-HAP for 1–5 days. Cell viability was evaluated using MTT assay. The absorbance (OD values) was measured at 595 nm using a Bio-Tek Synergy HT microplate reader. The calculation formula is as follows: cell viability (%) = [(Acontrol − Atreated)/Acontrol] × 100%.
Results and discussion
Fig. 1 is the XRD patterns and crystallinity of nano-HAP prepared by M-H method (nano-HAPM-H) (40 minutes, 0.06 mol L−1 of Na2HPO4·12H2O and 0.1 mol L−1 of CaCl2·2H2O) at different temperature (60 °C to 180 °C). It can be seen from Fig. 1 that when the reaction temperature is 60 °C, the diffraction peak of HAP has appeared with large half width and the crystallinity is 0.208. At lower reaction temperatures (60 °C to 80 °C), the crystallinity of nano-HAP increases not significantly; when the reaction temperature rises to 100 °C, the crystallinity of nano-HAP increases from 0.22 to 0.59; when the reaction temperature rises to 160 °C the crystallinity of nano-HAP reaches 0.92. However, there was no further effect on the crystallinity when the reaction temperature continues to increase to 180 °C. It can be observed that the full width at half maximum (FWHM) of the nano-HAP becomes narrower as the reaction temperature rises.29 This indicates that the crystallinity increases with increasing temperature, but it is not linear dependence, and the crystallinity does not increase after reaching a certain temperature.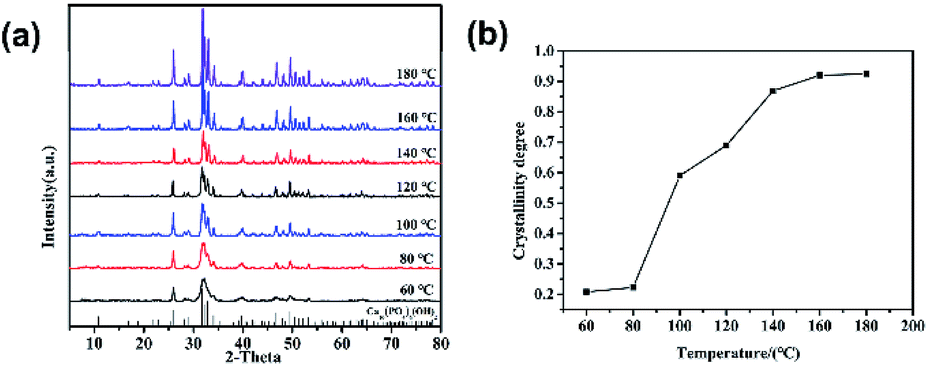 | ||
| Fig. 1 (a) XRD patterns and (b) crystallinity of HAP with different reaction temperatures. | ||
Fig. 2 is the SEM micrographs of nano-HAPM-H (40 minutes, 0.06 mol L−1 of Na2HPO4·12H2O and 0.1 mol L−1 of CaCl2·2H2O) at different temperature (60 °C, 100 °C, 160 °C). As shown in pictures (Fig. 2a–c), the effect of temperature on the morphology and dispersion of nano-HAP is obvious. When the reaction temperature is 60 °C, the nano-HAP particles are rod-like (Fig. 3a) and the substrate contains a small amount of flaky crystals, while the boundary of grains is blurred. This indicates that the sample obtained at this temperature has poor crystallinity, which also proved by the X-ray diffraction patterns. When the reaction temperature is 100 °C, flaky crystals disappear and the crystals only exist in the form of rod-like (Fig. 2b). The length of crystal is 57.06 ± 13.02 nm and the diameter is 20.4 ± 4.87 nm. It can be seen that as the temperature increases, the rod becomes significantly thicker and the dispersibility of the powder was improved. When the reaction temperature is 160 °C, the crystals are still rod-like (Fig. 2c) with a particle size of 64.71 ± 13.61 nm and the diameter is 29.1 ± 3.86 nm. The nanocrystals have fairly smooth surfaces and the boundaries are well-crystallized. Moreover, the agglomeration of particles decreases with increasing temperature and 160 °C is the optimal reaction temperature.
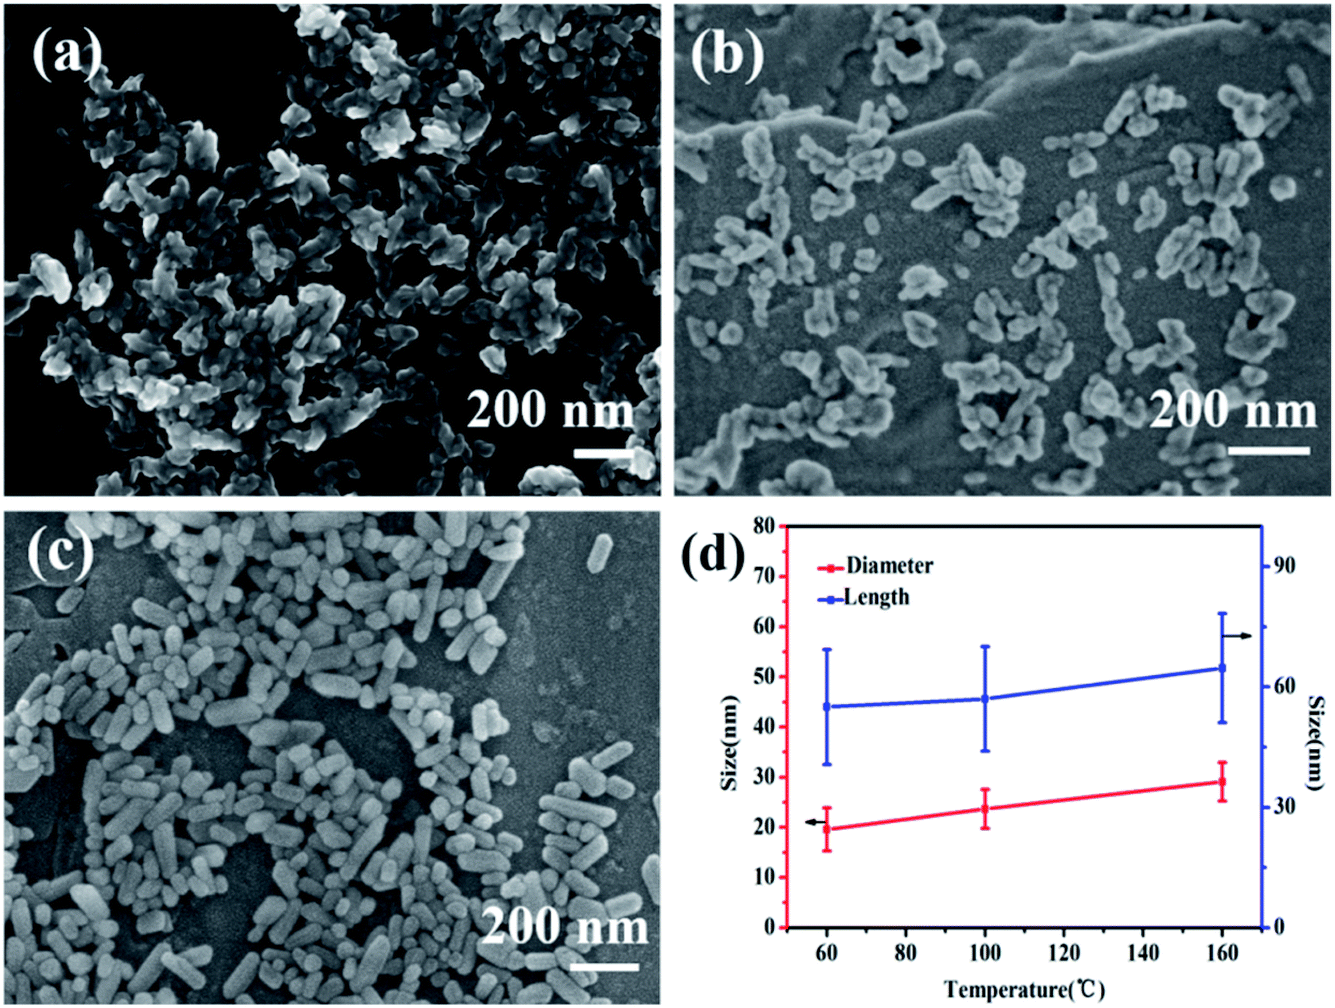 | ||
| Fig. 2 SEM images of nano-HAPM-H samples obtained at (a) 60 °C for 40 minutes, (b) 100 °C for 40 minutes, (c) 160 °C for 40 minutes, and (d) the size of samples obtained at different reaction temperature. | ||
 | ||
| Fig. 3 (a) XRD patterns and (b) crystallinity of HAP with different reaction time. | ||
Fig. 3 is the XRD patterns and crystallinity of nano-HAPM-H (160 °C, 0.06 mol L−1 of Na2HPO4·12H2O and 0.1 mol L−1 of CaCl2·2H2O) at different reaction time (1 to 50 minutes). It can be seen from Fig. 3 that HAP nanoparticles with high crystallinity could be synthesized at 160 °C for only 1 minute under this system. The peaks of sample are narrow and sharp, indicating that the samples with different reaction time have great crystallinity. The crystallinity of nano-HAP at different reaction time are shown in Fig. 3b, we can see that the crystallinity of the synthesized sample can be up to 0.61 by reacting at 160 °C for as short as 1 min and the crystallinity of the sample obviously increases with the increasing of reaction time. However, there is no obvious effect on the crystallinity after the reaction time increasing to 40 minutes.
As shown in the figure (Fig. 4a–c), the effects of reaction time on the morphology and dispersibility of HAP are obvious. At a reaction temperature of 160 °C for 1 min, the obtained sample are needle-shaped (Fig. 4a), the diameter is 19.6 ± 4.29 nm and the average length is 55.98 ± 18.48 nm. The crystal boundary is clear, indicating that HAP already has a relatively high crystallinity,30 which corresponds to the X-ray diffraction patterns. When the reaction time prolongs to 20 minutes, the average length of nano-HAP is 56.43 ± 12.87 nm and the diameter is 19.6 ± 4.29 nm, the width is wider and the size distribution is more uniform. Prolonging the reaction time to 40 minutes, the morphology t change little, and the crystal boundary of gains are much more clear. As the reaction time increases, the diameter of the sample increases. These characteristics indicate that nano-HAP with good crystallinity can be synthesized by M-H method within 1 min. Based on the information of SEM images and XRD pattern, 40 minutes is the optimal reaction condition.
 | ||
| Fig. 4 SEM images of nano-HAPM-H obtained at (a) 160 °C for 1 minute, (b) 160 °C for 20 minutes, (c) 160 °C for 40 minutes, and (d) the size of samples obtained at different time. | ||
In order to realize the possibility of engineering production of nano-HAP, we should increase the concentration of the reactant as much as possible on the premise of keeping uniform size distribution and good dispersibility. Fig. 5 and Fig. 6 are the XRD pattern and TEM micrographs of nano-HAPM-H (160 °C, 40 minutes, Ca/P = 1.67) (0.06 mol L−1, 0.12 mol L−1, 0.2 mol L−1 and 0.4 mol L−1 of Na2HPO4·12H2O). Seen from the XRD pattern, there is no significant difference among different reactant concentrations, and all samples have high crystallinity. As shown in the SEM pictures, the products of Fig. 6a–d have fairly smooth surfaces and the boundaries are clearly demarcated. Moreover, they all have uniform size distribution, good dispersibility and no obvious agglomeration. Well, the interplanar spacing is about 0.342 nm, which corresponds to the (002) crystal plane of HAP crystal structure according to the ICDD-PDF #84-1998.
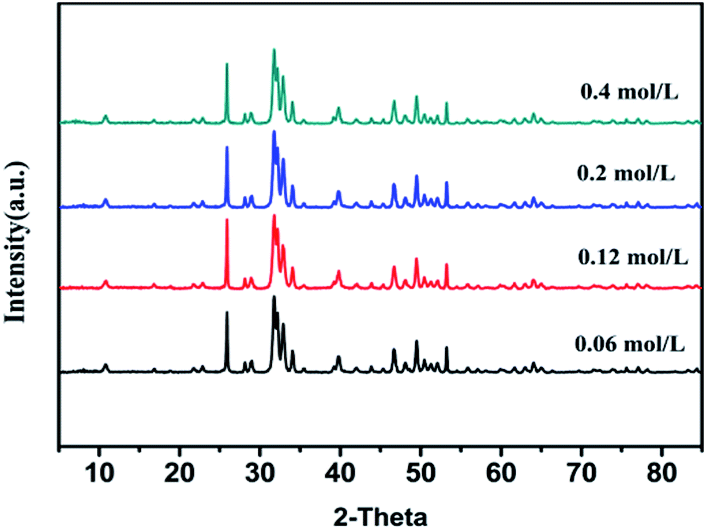 | ||
| Fig. 5 XRD patterns of HAP with different reaction concentration of Na2HPO4. | ||
 | ||
| Fig. 6 TEM images of samples with different concentration of Na2HPO4 (a) 0.06 mol L−1, (b) 0.12 mol L−1, (c) 0.2mol L−1, (d) 0.4 mol L−1, (e) 0.5 mol L−1 synthesized by M-H method and (f) size distribution of samples with different Na2HPO4 concentration. | ||
It can be seen from Fig. 6 and Table 1 that when the concentration rises to 0.12 mol L−1, the length increases. When the concentration increases from 0.12 mol L−1 to 0.4 mol L−1, the size of HAP grain does not change exceedingly, the dispersibility is good, and no obvious agglomeration was observed. The length of the HAP nanocrystal is 64.7–87.62 nm, he diameter is about 25–30 nm. However, when the concentration reaches to 0.5 mol L−1, the nano-crystals are agglomerated in large quantities (Fig. 6e) with poor size distribution (Fig. S1†). This may be caused by the high concentration of the reactants, which is close to the saturated concentration of Na2HPO4·12H2O at normal temperature. The size distribution of samples with different Na2HPO4·12H2O concentration is shown in Fig. 6f, the intensity average particle sizes (diameter) of the DLS did not change significantly as the reactant concentration increased.
| PO43− (mol L−1) | 0.06 | 0.12 | 0.2 | 0.4 | 0.5 |
| Length (nm) | 64.71 ± 13.61 | 83.84 ± 15.23 | 84.09 ± 14.64 | 87.62 ± 22.44 | 96 ± 32.36 |
| Diameter (nm) | 29.1 ± 3.86 | 27.88 ± 4.25 | 25.68 ± 3.52 | 25.73 ± 3.44 | 29 ± 6.53 |
Fig. 7 is the TEM micrographs of HAP powders synthesized under the same reaction conditions (160 °C, 40 min, Ca/P = 1.67, 0.4 mol L−1 of Na2HPO4·12H2O) with different preparation methods, the Fig. 7d(1), Fig. 7d(2) and Fig. 7d(3) correspond to the size distribution of Fig. 7c, Fig. 7b and Fig. 7a, respectively. Comparing Fig. 6d with Fig. 7a, it can be seen that ultrasonic atomization can significantly improve the dispersibility of crystal grains and decrease the particle diameter. The ultrasonic atomizer can make the high concentration of reactants mixed in the form of fog particles, thus avoiding the serious agglomeration of precursors. Well, it is much more clearly to know this by comparing Fig. 7b with Fig. 7c. Comparing Fig. 7a with Fig. 7c, we can know that even if the ultrasonic spray can make the high concentration of reactant into the mist particles, but because the concentration of reactant is too high, the precursor will have serious agglomeration during the crystallization process. M-H method can significantly improve the dispersibility and reduce the size of nano-HAP, which also proved in Fig. 6d and 7b. Therefore, combining M-H method with ultrasonic atomization can effectively reduce the agglomeration and the size of nano-HAP.
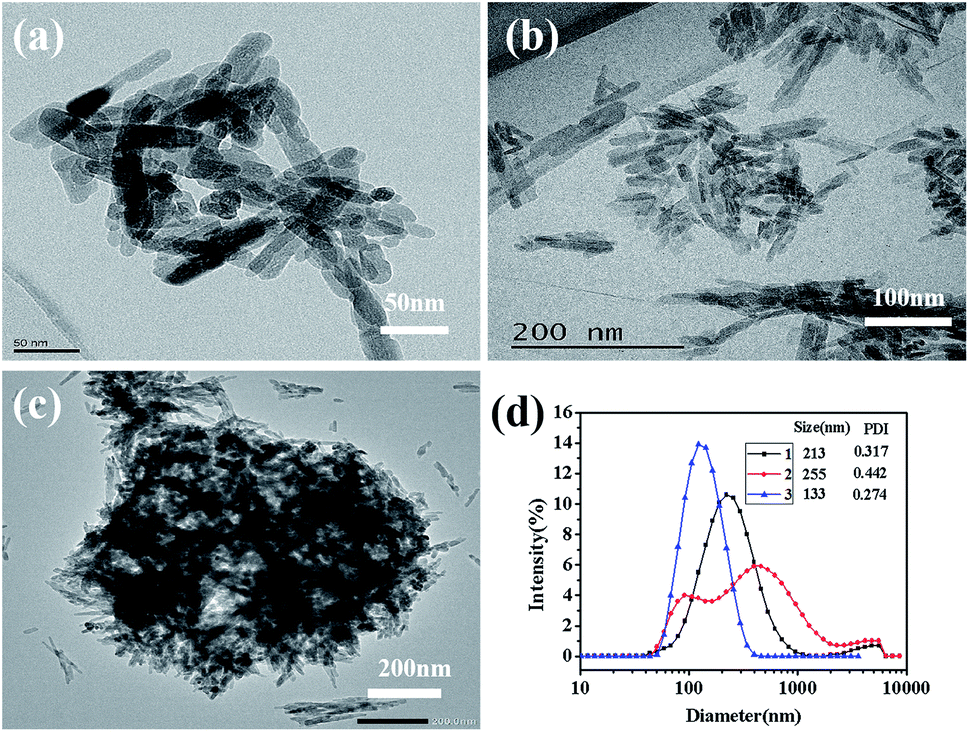 | ||
| Fig. 7 TEM images of HAP samples (a) synthesized by M-H without ultrasonic atomization treatment, (b) synthesized by hydrothermal with ultrasonic atomization treatment, (c) synthesized by hydrothermal and (d) size distribution of different HAP samples. | ||
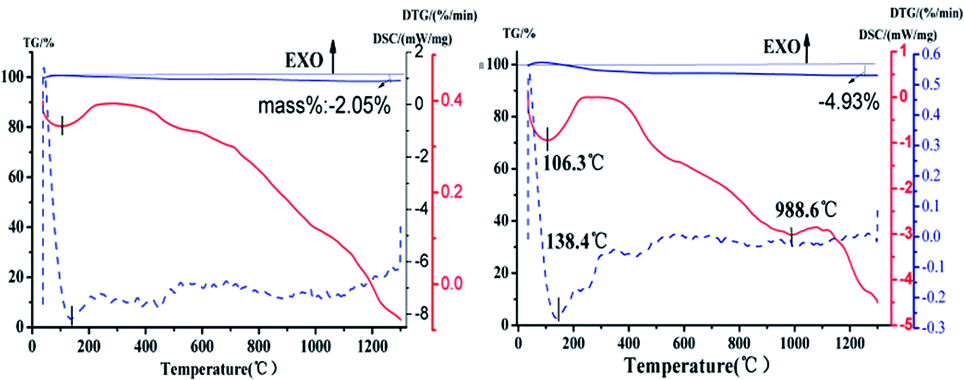
Seen from Fig. 8, the TG-DSC thermogram of HAP powder synthesized under the same reaction conditions (160 °C, 40 min, Ca/P = 1.67, 0.4 mol L−1 of Na2HPO4) with different preparation methods. In the initial stage, different forms of water are lost. The physically adsorbed water was lost below 250 °C, when the temperature is higher than 250 °C, the strongly bound water will be further lost and converted into oxyapatite. The chemical reaction formula is as follows: 2Ca5(PO4)2OH → Ca10(P04)6Ox(OH)2(1−x) + xH2O.31 The weight of the HAP does not drastically lose below 800 °C.32 There is no obvious steep slope in TG-DSC curve and the percent of weight loss was slowly decreased by 2.05% over the test temperature range, which means the nano-HAP powder has excellent thermal stability. And there are no other endothermic and exothermic peaks up to 1100 °C were detected. As it can be seen from Fig. 8b, the percent of weight loss was decreased by 4.93%. It can be seen that the mass reduction of nano-HAPH is much higher than nano-HAPM-H. This may be due to the low crystallinity of the samples synthesized by hydrothermal method, which resulted in crystallization in the sintering process. The chemical equation is as follows: 5Ca9HPO4(PO4)5OH + 4H2O → 9Ca5(PO4)3OH + 3H3PO4.33 At high temperatures, H3PO4 further decomposes into H2O, resulting in a reduction in sample weight. Moreover, a significant endothermic peak is found at 988.5 °C in the TG-DSC curve, which may be due to the phase transformation of HAP. To confirm this, the samples are calcined at 990 °C for 1 h.
 | ||
| Fig. 8 TG-DSC thermogram of (a) HAPM-H, (b) HAPH. | ||
As shown in Fig. 9, a diffraction peak was found at the d value of 2.8809 in the XRD patterns of HAP synthesized by hydrothermal, which is the strong diffraction peak of β-TCP. It means that the HAP start to transform to β-TCP phase at 990 °C. This indicated that the Ca/P ratio of samples synthesized by microwave hydrothermal method was 1.67. However, the Ca/P ratio of samples synthesized by hydrothermal method is not up to 1.67, which was estimated to the phase transformation of HAP into the β-TCP phase at 990 °C. The chemical reaction formula is as follows: Ca10(P04)6Ox(OH)2(1−x) → 3Ca3(PO4)2 + CaO + (1−x)H2O.31 It is obvious that the nano-HAP powder synthesized by M-H method exhibited greater thermal stability than that synthesized by hydrothermal.
 | ||
| Fig. 9 XRD patterns and FTIR spectrum of (a) HAPM-H, (b) HAPH. | ||
The FTIR spectra of HAP synthesized by hydrothermal and M-H method are depicted in Fig. 9b. The strong peaks at 3443 cm−1 and 1638 cm−1 indicate that both H2O and OH-groups are present in the sample. In addition, the typical absorption peak of the PO43− ion can also be easily recognized. The wide band near 1092 cm−1, 1032 cm−1, 962 cm−1, 603 cm−1, 564 cm−1 corresponds to the asymmetric stretching vibration peaks of P–O in the phosphate. The wide band near 874 cm−1 and 1446–1420 cm−1 corresponds to C–O stretching, which may be due to the absorption of carbon dioxide in an alkaline environment during the preparation of the sample. The band of O–H stretching in the nano-HAP powder appeared near 633 cm−1 and 3571 cm−1. The peaks at 2925 cm−1 and 2856 cm−1 may be assigned to HCO3− and H2PO4− respectively,34 which show that the sample is incompletely crystallized. However, the product synthesized by M-H method under the same reaction conditions is pure HAP. The results obtained by the FTIR spectrum are highly matched with the XRD patterns.
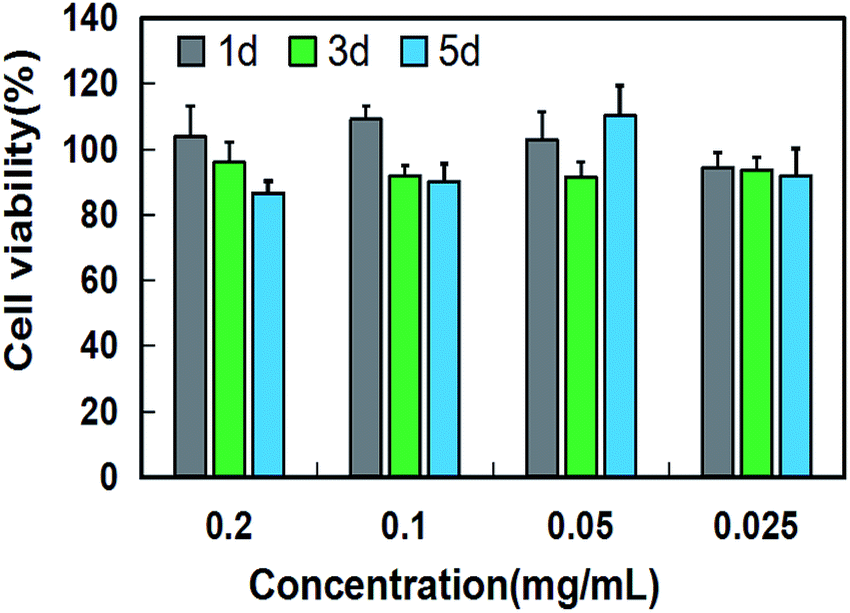
As a bone repair material, low toxicity and good biocompatibility are essential for nano-HAP. Fig. 10 shows the cell viability of osteoblasts cultured for 1 day, 3 days and 5 days at different nano-HAP concentrations. As shown in the figure, the proliferation of osteoblasts co-cultured with nano-hap was not significantly inhibited after 1, 3 and 5 days. The results show that nano-HAP synthesized by M-H method has great biocompatibility and low toxicity, and can be applied to bone repair materials.
 | ||
| Fig. 10 Cell viability of osteoblast after co-cultured with HAP at different concentrations for 1 day, 3 days and 5 days. | ||
As shown in Fig. 11c, the diameter of nanometer hydroxyapatite is about 94.5 ± 30.2 nm, and there is agglomeration between grains. M-H method and hydrothermal method were used to synthesis two kind of nano-HAP powder, which further sintered into ceramics, respectively. The relative density of the two sintered ceramics is 94.5% and 92.1%. The nano-HAP powder prepared by the M-H method has a small particle size and good dispersibility, which facilitate the sintering process of ceramic and improved the relative density of the ceramic. The flexural strength of the two sintered ceramics is 95 ± 8.6 MPa and 71.4 ± 7.9 MPa. Fig. 11a and b are the SEM micrographs of two nano-HAP ceramics. The flexural strength of nano-HAPM-H ceramics is obviously stronger than that of nano-HAPH ceramics. As can be seen from the figure, nano-HAPM-H ceramics have finer grains and denser grains. The reasons for the improvement of the mechanical properties of hydroxyapatite ceramics are as follows: the crystal size of nano-HAPM-H is smaller and the distribution is more uniform, and grain refinement can produce more grain boundaries, which increases the resistance of dislocation motion. As a result, the flexural strength of material improved. The agglomeration of the nano-HAP may cause defects in the interior of the ceramic, thence the flexural strength of the ceramic is lowered.22,23 Therefore, nano-HAPM-H ceramics have stronger flexural strength. It has broad application prospects in bone repair materials.
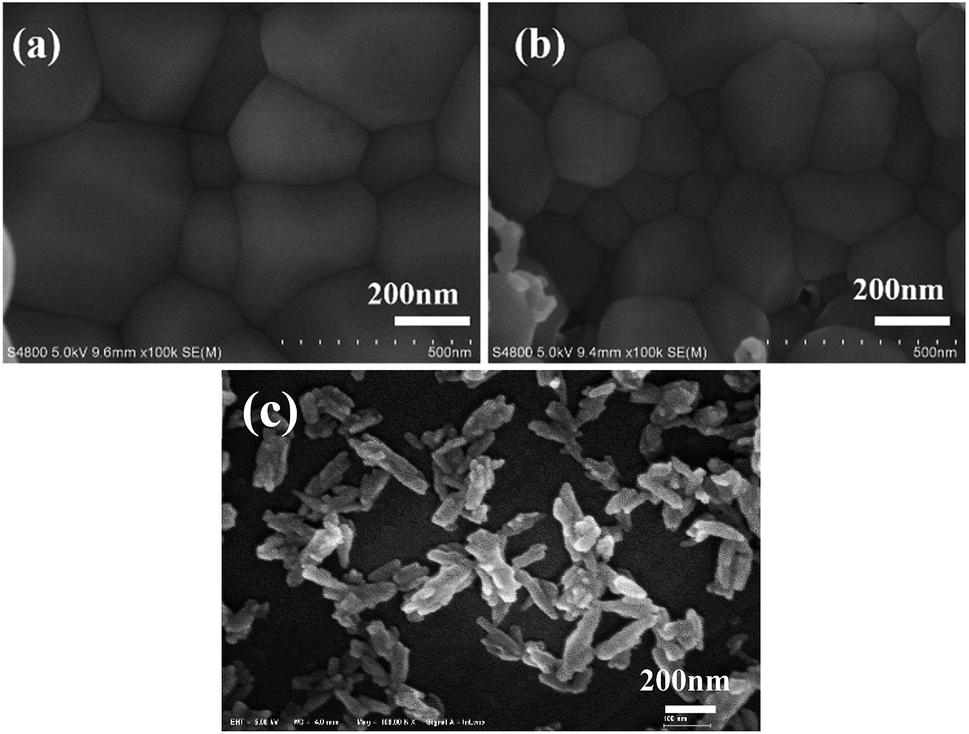 | ||
| Fig. 11 SEM images of (a) nano-HAPH ceramics, (b) nano-HAPM-H ceramics, (c) nano-HAPH powder. | ||
The product obtained by M-H method is in the form of a rod, which have fairly smooth surfaces and the boundaries. The XRD pattern shows that nano-HAPM-H have high crystallinity. It also has uniform size distribution and good dispersibility. Microwaves can be used in the field of chemical synthesis because the reactants involved in chemical reactions carry various polar molecules such as water, alcohols and carboxylic acids.35 Generally, the MW electric field polarizes the molecules, which may couple with the rapid reversal of the electric field. This interaction causes the molecules to produce high-speed motion and collide, rub and squeeze each other, thereby converting kinetic energy-microwave energy into heat energy. Since this energy comes from the inside of the reactant solvent, the heat transfer medium and convection are not required, and the temperature of the sample can be quickly increased, so that the reactant solvent can be heated comprehensively, rapidly, and uniformly, thereby achieving the purpose of increasing the chemical reaction rate.36,37 And the ultrasonic atomization is to convert a solution into mist-like droplet with a certain energy by ultrasonic nebulizer and then spray it into another reaction solution over a large area, so that it is possible to obtain uniformly dispersed and fine nano-powder.38 Therefore, the M-H method has a greater advantage than the traditional hydrothermal method.
Conclusions
To sum up, high-quality nano-HAP was successfully synthesized by M-H method assisted with ultrasonic atomization precipitation method. Pure HAP nanoparticles with good crystallinity and dispersibility could be synthesized in 40 minutes at the temperature of about 160 °C. The yield of nano-HAP powder can reach 0.033 kg L−1 when the concentration of Na2HPO4 is 0.4 mol L−1. There is no significant difference between the samples synthesized at high reactant concentrations and low reaction concentrations while the concentration of Na2HPO4 is below 0.4 mol L−1. The obtained nano-HAP powder showed uniform size, good dispersibility and accurate stoichiometry, with size of 87.62 ± 22.44 nm and crystallinity of 0.92, respectively. At the same time, nano-HAPM-H ceramic exhibits excellent properties. This provides a reference for large-scale and fast synthesis of nano-HAP powder.Conflicts of interest
The authors declare no conflicts of interest.Acknowledgements
This work was supported by National Key R&D Program of China (No. 2017YFC113801); the Science and Technology Partnership Program, Ministry of Science and Technology of China (KY201602002); the major special project of Technological Innovation of Hubei Province (No. 2017ACA168).Notes and references
- E. Roncari, C. Galassi and P. Pinasco, J. Mater. Sci. Lett., 2000, 19, 33–35 CrossRef CAS.
- R. K. Roeder, G. L. Converse, R. J. Kane and W. Yue, J. Met., 2008, 60, 38–45 CAS.
- N. Tran and T. J. Webster, J. Mater. Chem., 2010, 20, 8760–8767 RSC.
- H. Yohey, T. Tomohiro and S. Takeshi, J. Environ. Manage., 2009, 90, 1782–1789 CrossRef PubMed.
- A. Akbarzadeh, M. Samiei and S. Davaran, Nanoscale Res. Lett., 2012, 7, 144 CrossRef PubMed.
- J. D. Wang, J. K. Liu, Y. Lu, D. J. Hong and X. H. Yang, Mater. Res. Bull., 2014, 55, 190–197 CrossRef CAS.
- Y. Mizushima, T. Ikoma, J. Tanaka, K. Hoshi, T. Ishihara, Y. Ogawa and A. Ueno, J. Control. Release, 2006, 110, 260–265 CrossRef CAS PubMed.
- C. Yang, P. Yang, W. Wang, S. Gai, J. Wang, M. Zhang and J. Lin, Solid State Sci., 2009, 11, 1923–1928 CrossRef CAS.
- S. B. Chen, Y. B. Ma, L. Chen and K. Xian, Geochem. J., 2010, 44, 233–239 CrossRef CAS.
- Q. Fu, N. Zhou, W. Huang, D. Wang, L. Zhang and H. Li, J. Biomed. Mater. Res., Part A, 2010, 74, 156–163 Search PubMed.
- M. Ashok, S. N. Kalkura, N. M. Sundaram and D. Arivuoli, J. Mater. Sci.: Mater. Med., 2007, 18, 895–898 CrossRef CAS PubMed.
- J. Arends, J. Schuthof, W. H. V. D. Lindwen, P. Bennema and P. J. V. D. Berg, J. Cryst. Growth, 1979, 46, 213–220 CrossRef CAS.
- A. Lak, M. Mazloumi, M. Mohajerani, A. Kajbafvala, S. Zanganeh, H. Arami and S. K. Sadrnezhaad, J. Am. Ceram. Soc., 2010, 91, 3292–3297 CrossRef.
- P. Wang, C. Li, H. Gong, X. Jiang, H. Wang and K. Li, Powder Technol., 2010, 203, 315–321 CrossRef CAS.
- D. M. Liu, Q. Yang, T. Troczynski and W. J. Tseng, Biomaterials, 2002, 23, 1679–1687 CrossRef CAS PubMed.
- A. Ostovan, M. Ghaedi, M. Arabi, Q. Yang, J. Li and L. Chen, ACS Appl. Mater. Interfaces, 2018, 10, 4140–4150 CrossRef CAS PubMed.
- Q. M. Zhao, H. L. Yang, Z. T. Liu, X. F. Gu, c. Li and D. H. Feng, J. Mater. Sci.: Mater. Med., 2015, 26, 88 CrossRef PubMed.
- Y. J. Zhu and F. Chen, Chem. Rev., 2014, 114, 6462–6555 CrossRef CAS PubMed.
- H. Zhou and J. Lee, Acta Biomater., 2011, 7, 2769–2781 CrossRef CAS PubMed.
- S. J. Kalita and S. Verma, Mater. Sci. Eng., C, 2010, 30, 295–303 CrossRef CAS PubMed.
- T. Ion, P. Maria and M. Alina, J. Mater. Sci.: Mater. Med., 2008, 19, 517–523 CrossRef PubMed.
- H. Zhou, M. Zhang, S. Kong, S. Hou, M. Yang, C. Hong, S. B. Bhaduri, Y. Lei and L. Deng, Mater. Lett., 2016, 180, 239–242 CrossRef CAS.
- B. Mostafa, C. Luigi, C. P. Davide and K. C. Oliver, Angew. Chem., Int. Ed., 2011, 50, 11312–11359 CrossRef PubMed.
- C. Qi, Y. J. Zhu, B. Q. Lu, X. Y. Zhao, J. Zhao, F. Chen and J. Wu, Chemistry, 2013, 19, 5332–5341 CrossRef CAS PubMed.
- X. Y. Zhao, Y. J. Zhu, C. Qi, F. Chen, B. Q. Lu, J. Zhao and J. Wu, Chem.–Asian J., 2013, 8, 1313–1320 CrossRef CAS PubMed.
- Q. Yang and H. P. Xia, J. Mater. Eng., 2008, 10, 324–327 Search PubMed.
- Y. Han, X. Wang, H. Dai and S. Li, J. Lumin., 2013, 135, 281–287 CrossRef CAS.
- E. Landi, A. Tampieri, G. Celotti and S. Sprio, J. Eur. Ceram. Soc., 2000, 20, 2377–2387 CrossRef CAS.
- R. R. Rao, H. N. Roopa and T. S. Kannan, J. Mater. Sci. Mater. Med., 1997, 8, 511–518 CrossRef CAS PubMed.
- A. Ruksudjarit, K. Pengpat, G. Rujijanagul and T. Tunkasiri, Curr. Appl. Phys., 2008, 8, 270–272 CrossRef.
- M. A. Ahmed, S. F. Mansour, S. I. El-dek, S. M. Abd-Elwahab and M. K. Ahmed, Ceram. Int., 2014, 40, 12807–12820 CrossRef CAS.
- J. K. Han, H. Y. Song, F. Saito and B. T. Lee, Mater. Chem. Phys., 2006, 99, 235–239 CrossRef CAS.
- S. C. J. Loo, S. Yiwei Eva, H. Shuhui, F. Y. C. Boey and J. Ma, J. Mater. Sci.: Mater. Med., 2008, 19, 1389–1397 CrossRef CAS PubMed.
- N. Sahai and J. A. Tossell, MRS Proceedings, 1999, 599, 4322–4341 Search PubMed.
- M. N. Hassan, M. M. Mahmoud, A. A. El-Fattah and S. Kandil, Ceram. Int., 2016, 42, 3725–3744 CrossRef CAS.
- T. Basak, Mater. Sci. Eng., A, 2007, 457, 261–274 CrossRef.
- J. Zhu, M. Zhou, J. Xu and X. Liao, Mater. Lett., 2001, 47, 25–29 CrossRef CAS.
- D. Yan, Y. Lou, Y. Han, M. N. Wickramaratne, H. Dai and X. Wang, Mater. Lett., 2018, 227, 9–12 CrossRef CAS.
Footnote |
| † Electronic supplementary information (ESI) available. See DOI: 10.1039/c9ra00091g |
| This journal is © The Royal Society of Chemistry 2019 |