 Open Access Article
Cyanate ester resin based composites with high toughness and thermal conductivity
Le Zhaia,
Zhenxin Liub,
Chen Lic,
Xiongwei Qu *a,
Qingxin Zhanga,
Guohua Li*a,
Xiaojie Zhanga and
Beckry Abdel-Magid*d
aInstitute of Polymer Science and Engineering, School of Chemical Engineering, Hebei University of Technology, Tianjin 300130, P. R. China. E-mail: xwqu@hebut.edu.cn; nkligh@126.com
bHenan Provincial Key Laboratory of Surface and Interface Science, School of Materials and Chemical Engineering, Zhengzhou University of Light Industry, Zhengzhou 450002, P. R. China
cSanyou (Tianjin) Polymer Technology Co. Ltd., Tianjin 300211, P. R. China
dDepartment of Composite Materials Engineering, Winona State University, Winona, MN 55987, USA. E-mail: bamagid@winona.edu
First published on 15th February 2019
Abstract
A new cyanate ester resin-based composite with higher toughness and thermal conductivity was developed. First, a poly(n-butyl acrylate)/poly(methyl methacrylate-co-acrylamide) (PBMAM) core–shell structured latex was prepared by seeded emulsion polymerization. Second, hexagonal boron nitride (h-BN) particles were modified by a surface coupling agent, 3-(2-amino ethyl amino)propyl trioxysilane, to improve the dispersion in cyanate ester resin (BADCy). Third, PBMAM and the modified boron nitride were mixed with BADCy resin to increase mechanical properties and thermal conductivity. The monomer conversion in the emulsion polymerization process of the PBMAM was monitored by determining the solid content. Its particle size was characterized by dynamic laser scattering, and the morphology of the particles was characterized using scanning and transmission electron microscopes. The modified boron nitride (ABN) was verified by FTIR and TGA measurements. The mechanical properties and thermal conductivity of the BADCy/PBMAM/ABN composites were determined at various BN contents. Results showed that the unnotched impact strength of the composite increased by 151% and the thermal conductivity increased by 85% at a PBMAM content of 5 wt% and ABN content of 6 wt%. With the enhanced properties and ease of fabrication, the developed composites have good potential for application in high-end industries such as microelectronic packaging.
1 Introduction
Cyanate ester (CE) resin presents relatively lower dielectric constant and dielectric loss tangent values in comparison to those of epoxy,1–3 polyimide,4,5 phenolic6 and bismaleimide7,8 resins. Furthermore, CE resin possesses excellent high-temperature mechanical properties, very low moisture adsorption, good heat resistance and flame retardation, preferable dimensional stability and an epoxy-like processability.9,10 It has been used in wave–transparent composites,9,11–17 composite laminates, adhesives, semiconductor packaging, and other applications.13,18–21 However, the cured resin has high cross-linking density and poor impact resistance, which makes the cyanate ester matrix undesirable in many applications.22 Researchers have been working to toughen cyanate ester and broaden its use.23 The main methods of toughening cyanate ester resin were through the addition of other thermosetting resins,24–27 thermoplastic resins,28 rubber elastomers,29–32 and nanoparticles.33With the rapid development in electronic technology, demand for high performance and small size electronic devices has been on the rise. Such high demand causes these devices to generate and accumulate a great amount of heat that should be effectively dissipated to prolong the service life of the devices.34 Hexagonal boron nitride (h-BN) is a kind of graphite inorganic compound, that is composed of the same number of boron (B) and nitrogen (N) atoms bonded by sp2 hybrid. The structure of carbon atoms in graphite can be seen as alternating between B and N atoms in a plane.35 h-BN has high thermal conductivity (about 300 W (m K)−1),36 high temperature resistance, low coefficient of thermal expansion, and good chemical stability which can effectively improve the thermal conductivity of polymer matrixes, such as cyanate ester,37,38 bismaleimide,7 polyimide,39 polyphenylene sulfide (PPS)40 and maintain the material's electric conductivity.36 However, boron nitride is an inorganic rigid particle, with very few effective groups available on its surface. The compatibility of boron nitride with organic matrix is poor, and the thermal conductivity obtained is not ideal. Therefore, the surface of boron nitride should be modified. The modification methods of boron nitride can be divided into chemical grafting and physical surface coating.41 The principle of chemical grafting is based on the fact that B–N bonds have partial ionization of B and N atoms in the h-BN structure. Some positive (lacking electron centers) and negative (rich electron centers) of B and N atoms cause the nucleophilic groups of B sites to be attacked and the N sites to react as electrophilic. However, research on improving both the thermal conductivity and toughness of cyanate ester matrix is scarce and not widely reported.40 A novel high performance composite material consisting of cyanate ester, core–shell structured polyacrylic, and modified boron nitride developed to improve both of these properties, is presented in this paper.
2 Experimental
2.1 Materials
Bisphenol A cyanate ester resin (BADCy) was obtained from Yangzhou Tianqi New Materials Co, Ltd. Methyl methacrylate (MMA), n-butyl acrylate (BA), acrylamide (AM), and dibutyltin dilaurate (DBTL) were supplied by Tianjin Fuchen Chemical Reagents Co. Allyl methacrylate (ALMA), and 1,4-butanediol diacrylate (BDDA) were provided by Tianjiao Chemical Co. Potassium sulfite (KPS) was purchased from Tianjin Hongyan Chemical Reagents Co. Anionic surfactant (S) was from Tianjin Reagent Co. Boron nitride (h-BN) (purity > 99.0%, 3–5 μm) was obtained from Qingzhou Materials Co. The 3-(2-amino ethyl amino)propyl silane (AEAPS), using as a coupling agent, was purchased from Aladdin Chemistry Co. All chemicals were used as received without further purification. Deionized water (DIW) was employed in all polymerization processes.2.2 Emulsion polymerization process of PBMAM
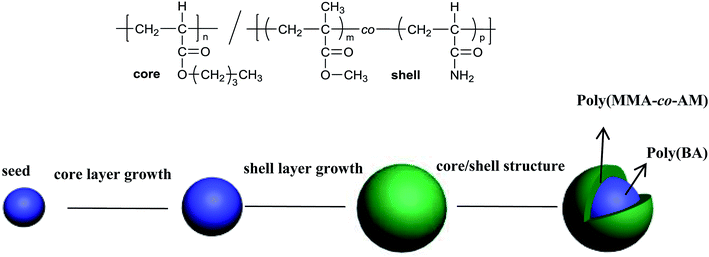
Poly(n-butyl acrylate)/poly(methyl methacrylate-co-acrylamide) (PBMAM) latex was prepared in a 500 ml four-necked flask equipped with a mechanical stirrer and reflux condenser. A thermometer was used to ensure that the temperature of the water bath was maintained at 78 °C. The reaction was carried out in a blanket of nitrogen. First, the surfactant (0.25 g) and deionized water (140 g) were poured into a four-necked flask and stirred at a 180 rpm for 30 min. Then a mixture of seed monomer (BA, 10 g) and a crosslinking agent (BDDA, 0.054 g) were added into the above dispersed system. After stirring for 10 min, a KPS aqueous solution (KPS, 0.43 g/DIW, 20 g) was added to start the polymerization reaction. More KPS aqueous solution (0.11 g/10 g) was added after 55 minutes and stirred for 5 minutes to complete the reaction of the seed stage. The second stage was the growth, which involved two layers of pre-emulsified monomers. The first layer was the rubber core, containing BA (110 g) ALMA (1.0 g) and surfactant (1.599 g). The second layer was the rigid shell, consisting of MMA (80 g), surfactant (1.6 g) and functional monomer AM (1.0 g). The pre-emulsified mixture was added to the reaction flask at a rate of ca. 1.1 g min−1 during the growth stage. The initiator, KPS aqueous solution (0.034 g/10 g), was added into the reaction flask at 60 min intervals after the beginning of the second stage. The final mixture was allowed to remain for another 60 minutes to ensure that the monomer reaction was complete. Then, the latex was cooled to room temperature and filtered through a 53 μm sieve to obtain the coagulated content. Finally, the latex was refrigerated for 24 hours and the PBMAM powders were obtained using a freeze-dryer.42 A schematic diagram of the preparation of PBMAM along with the core/shell structure formula are shown in Fig. 1.2.3 Characterization of the PBMAM latex particles
At 30 min intervals, 5 ml samples of the latex were transferred into pre-weighed vials containing 1 ml hydroquinone solution (2 wt%) and then cooled down in an ice batch to terminate the polymerization. Gravimetric analysis was used to determine the monomer conversion. The particle size and polydispersity index (PDI) were measured with dynamic light scattering (DLS) using a Malvern Zetasizer NANO-ZS90 (Worcestershire, UK). The cell temperature was held at 25 ± 0.1 °C, and the z-average diameter was calculated.The growth of the latex particle size in the seed emulsion polymerization was investigated. The particles diameters determined by DLS were compared with theoretical particle diameters which were calculated according to the following equation.43
| dt = (MtIt/Ms)1/3 × ds | (1) |
Instantaneous and overall conversions were calculated using the following equations.43
| Instantaneous conversion% = [mass of polymer formed/mass of monomer added] × 100 | (2) |
| Overall conversion% = [mass of polymer formed/total mass of monomer] × 100 | (3) |
The morphology of the PBMAM latex was characterized by a JEOL JEM-2100 transmission electron microscope (TEM). The latex was first dispersed in deionized water with ultrasonic waves for 3 min, and then single drops of diluted solution were deposited onto a carbon-coated copper grid and dried with infrared light to prepare samples for TEM analysis.
The external morphology of the latex particles was characterized by an FEI Nova NanoSEM 450 field emission scanning electron microscope (SEM). The sample was diluted with deionized water to achieve the desired concentration, followed by ultrasound treatment for 5 min, and then single drops of diluted solution were deposited on a silicon wafer, which was then placed in a vacuum and dried at room temperature for 24 h. The surface morphology of the latex particles was observed and characterized.
2.4 Surface modification of h-BN
h-BN has few functional groups on the surface, due to its special structure, which need to be hydroxylated to increase the surface functionalization of hydroxyl groups of h-BN. The operation steps are as follows: (a) 5 g h-BN was added to 200 ml aqua regia solution (HNO3![[thin space (1/6-em)]](https://www.rsc.org/images/entities/char_2009.gif) :
:![[thin space (1/6-em)]](https://www.rsc.org/images/entities/char_2009.gif) H2SO4 = 3
H2SO4 = 3![[thin space (1/6-em)]](https://www.rsc.org/images/entities/char_2009.gif) :
:![[thin space (1/6-em)]](https://www.rsc.org/images/entities/char_2009.gif) 1 (vol%)) and stirred for 12 h at 90 °C, then the resulting suspension was centrifuged. The reaction product was washed using deionized water for several times until the filtrate was neutral, and then dried at 60 °C for 12 h. (b) 2 g hydroxylated h-BN and 0.5 g 3-(2-amino ethyl amino)propyl silane (AEAPS) coupling agent were dispersed into 100 ml toluene, while the consequent suspension was ultrasonically mixture for 2 h at room temperature and then stirred for 4 h at 120 °C. After that, the suspension mixture was cooled to room temperature, filtered, washed, and dried in a vacuum oven at 60 °C for 12 h. This modified h-BN was named as ABN. A schematic diagram of the modification of h-BN is shown in Fig. 2.
1 (vol%)) and stirred for 12 h at 90 °C, then the resulting suspension was centrifuged. The reaction product was washed using deionized water for several times until the filtrate was neutral, and then dried at 60 °C for 12 h. (b) 2 g hydroxylated h-BN and 0.5 g 3-(2-amino ethyl amino)propyl silane (AEAPS) coupling agent were dispersed into 100 ml toluene, while the consequent suspension was ultrasonically mixture for 2 h at room temperature and then stirred for 4 h at 120 °C. After that, the suspension mixture was cooled to room temperature, filtered, washed, and dried in a vacuum oven at 60 °C for 12 h. This modified h-BN was named as ABN. A schematic diagram of the modification of h-BN is shown in Fig. 2.
Fourier transform infrared (FTIR) spectra of h-BN and ABN were obtained with a Bruker Vector-22 FTIR spectrometer in the range of 4000 to 400 cm−1. The BN powder before and after modification was analyzed by Bruker AXS D8 Advance X-ray diffractometer at a scan range of 10°–90°, and a scan rate of 6° min−1. The thermal stability of h-BN and ABN samples was obtained with a thermo-gravimetric analysis (TGA) using an SDT Q600 (TA Instruments). All the tests were carried out with an SDT Q600 from 40 to 800 °C at a heating rate of 10 °C under a nitrogen atmosphere.
2.5 Preparation of BADCy/PBMAM/ABN composites
Initially, the PBMAM, h-BN and ABN powders were dried in a vacuum oven at 80 °C for 12 h. The weighed amounts of BN were sequentially added to 95 g cyanate ester and 5 g PBMAM. The mixture was fairly dispersed for 15 minutes to ensure that the fillers were evenly distributed in the cyanate ester. Then a catalyst (dibutyltin dilaurate, 0.2 g) was added to the mixture which was vigorously stirred at 150 °C for 1 h. When the viscosity of the syrup increased to 2000 mPa, the mixture was degassed, poured into a preheated foil groove, cured at 180 °C for 2 h, 200 °C for 2 h, and post-cured at 220 °C for 2 h to ensure complete cure of the composites. Samples, denoted as BADCy/PBMAM, were prepared with BN contents of 2%, 4%, 6% and 8% by weight.2.6 Mechanical properties and failure analysis
Impact and flexural properties were obtained using China National Standards Testing Methods. The composite samples were conditioned at 23 ± 1 °C and 50 ± 5% relative humidity for 48 hours before testing. The unnotched impact strength was determined according to the National Standard Testing Methods GB/T2571-1995 using a SANS ZBC-4 impact testing machine. The flexure properties were obtained according to Standard GB/T2570-1995 using a SANS CMT-6104 universal testing machine. Six replicate specimens were used in each of the impact and flexure tests. The fracture surface of failed specimens of the BADCy/PBMAM/ABN composites were analyzed using SEM.2.7 Thermal conductivity of the composites
Thermal conductivity of the BADCy/PBMAM/ABN composites were evaluated by TC 3000 Series Thermal Conductivity Apparatus (Xi'an Xiaxi Co. Ltd., China) based on transient hot-wire technique at room temperature according to ASTM C1113-99 (2004). Every specimen was measured for five times at room temperature and an average value was calculated.3 Results and discussion
3.1 Preparation of PBMAM toughening particles and modification of h-BN powders
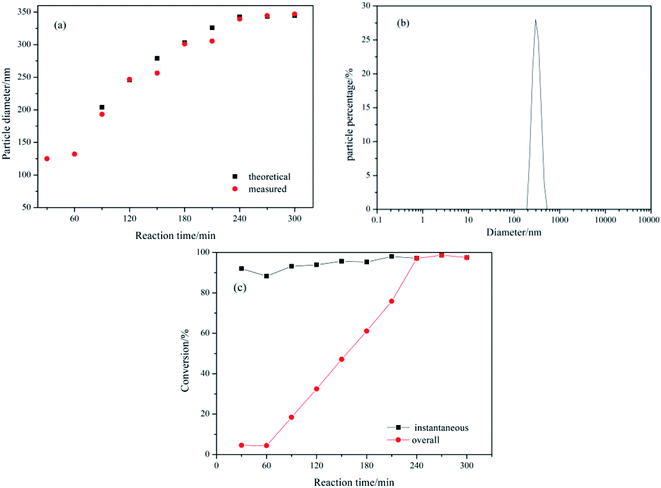 | ||
| Fig. 3 Variation with reaction time of (a) measured and theoretical z-average particle diameter, dz; (b) particle diameter distribution of the final latex; (c) instantaneous and overall conversion. | ||
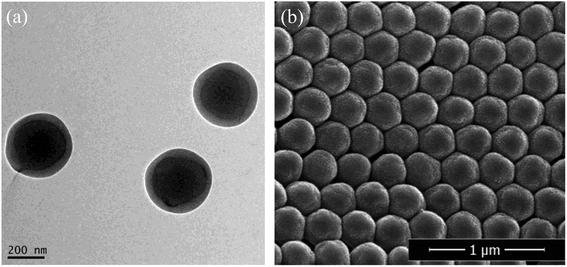
The PBMAM latex was further analyzed by TEM and SEM. As shown in Fig. 4(a), the particle consists of a dark core of poly(BA) and a brighter shell of poly(MMA), which clearly indicates that a core–shell structure of PBMAM latex has been successfully constructed. The SEM image in Fig. 4(b) shows that the PBMAM latex has a uniform distribution and consistent size.
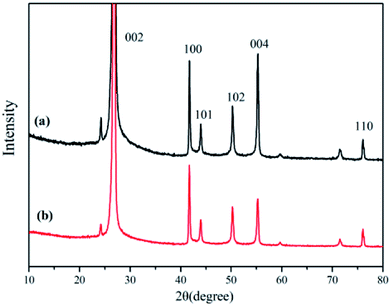
XRD is known to be a useful technique to characterize the crystallite size and three-dimensional order of materials. Fig. 6 shows the XRD patterns of raw h-BN and ABN. All samples showed similar XRD patterns, and the diffraction peaks corresponded to (002), (100), (101), (102), (004) and (110) planes of the hexagonal crystal of boron nitride from 10° to 80°, respectively (JCPDS ICSD 34-0421).45 The diffraction peak intensity for (102) plane was relatively higher, which meant that the raw h-BN and its modified pattern had a perfectly ordered structure and degree of graphitization.46 Besides, new peaks were not observed for the modified BN modification, and, notably, the positions of these main peaks did not change.
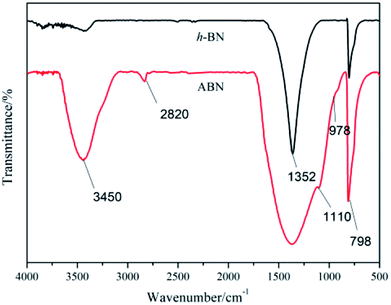
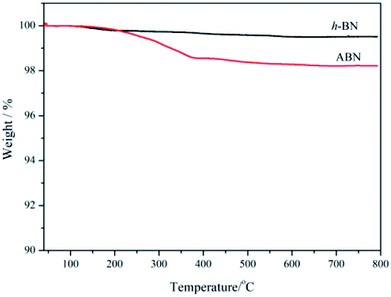
Thermal gravimetric analysis (TGA) was further used to illustrate the successful modification of h-BN particles' surfaces. Fig. 7 shows the TGA curves of h-BN and ABN. Both raw h-BN and ABN showed some differences in weight loss with the temperature. Compared with raw h-BN particles, the ABN had a relatively large weight loss at temperatures around 200–350 °C, which was attributed to the decomposition of silane molecules. The TGA results were consistent with those of FTIR, which indicate that the silane had been chemically grafted on the surface of h-BN particles as the ABN sample was extracted with boiling toluene for two days before analyzing. The grafting degree of organic molecules was low, possibly on account of chemical stability of boron nitride. Only the edge planes could be efficiently oxidized to produce functional groups. These planes of the lamellar structure have a small quantity of functional groups such as amino groups or hydroxyl groups.47 Therefore, the silane coupling agent (AEAPS) is successfully chemically grafted on the surface of h-BN.
3.2 Improvement of impact toughness and flexural strength
Before determining the change in thermal conductivity by the addition of ABN into the BADCy/PBMAM blends, it was necessary to ensure that the addition of ABN did not significantly decrease the mechanical properties of the blended BADCy achieved with 5 wt% PBMAM content. Fig. 8 shows the variation of the impact strength and flexural strength of BADCy/PBMAM/BN composites with different BN contents. The impact and flexural strength increase up to a certain amount of BN content, then start to gradually decrease with additional content of both raw h-BN and modified ABN. The mechanical improvement can be attributed to the effective absorption of fracture energy and prevention of crack propagation by core–shell structured PBMAM particles48 and BN platelets. Meanwhile, modified ABN exhibited more mechanical reinforcement than that of raw h-BN. The results shown above in the modification on the surfaces of BN indicated that polar groups were successfully introduced on the BN surfaces and the interfacial adhesion of the BN particles to the BADCy matrix was improved effectively. This can be attributed to the introduction of amine and epoxy polar groups on the surface of the PBMAM modifier and BN particles after the surface functionalization.9,17 These groups can react with the active groups of the BADCy matrix and contribute to the improvement of the interfacial compatibility of the PBMAM and ABN with BADCy matrix. According to the theory of hole shear and bending,49 the concentration of the tridirection stress field at the front of the crack and the stress remaining from the curing of the particles led to development of holes in the particles and the crack propagation at the interface between particles and resins. The concentration of the stress on the equator of the particles would induce shearing and bending of the nearby particles. Moreover, the bending process would dull the crack, and weaken the concentration of the stress thus preventing fracture and toughening the matrix. When the content of ABN is too high (above 6 wt%), the aggregation of ABN reduces the reinforcing effect. As a result, the mechanical properties began to decrease, which may be due to the poor adhesion between the BADCy, PBMAM and ABN. The optimum content for the highest mechanical properties for BADCy/PBMAM/BN composites depend on both the stiffness and toughness of the constituent materials and the interface bonding between these materials. Therefore, the addition of PBMAM and ABN compounds into BADCy matrix led to simultaneous enhancement in flexural strength and toughness of BADCy matrix.47,50 The highest impact and flexural strengths were achieved at 5 wt% PBMAM content and 6 wt% ABN content. At these contents the unnotched impact strength was 18.75 kJ m−2 and the flexural strength was 175 MPa as shown in Fig. 8.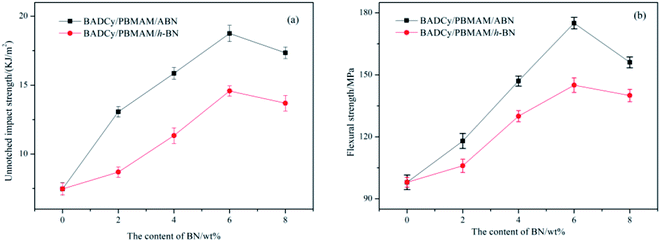 | ||
| Fig. 8 Mechanical properties of BADCy/PBMAM/BN composites as a function of filler contents. (a) Unnotched impact strength; (b) flexural strength. | ||
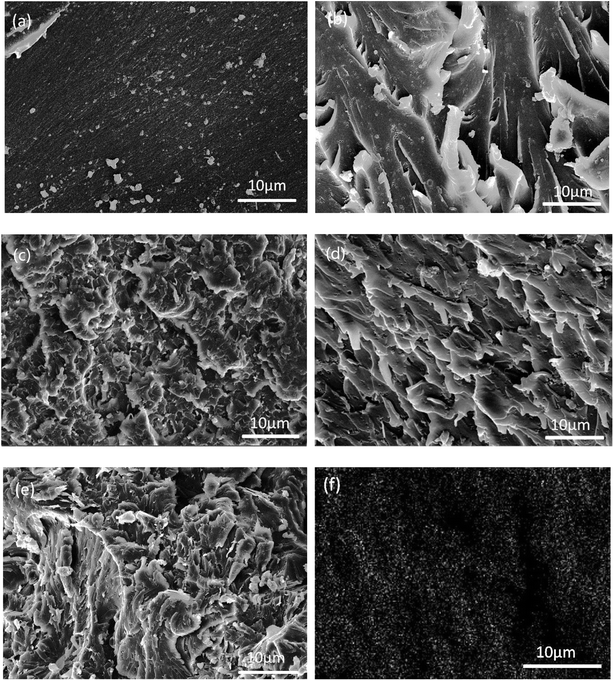
In order to evaluate the interfacial interaction of h-BN and ABN with PBMAM and BADCy matrix, the fractured surfaces of BADCy/PBMAM/ABN composites were investigated by SEM. Fig. 9(a) shows that the fractured surface of neat BADCy is quite smooth. In contrast, the fractured surfaces of BADCy/PBMAM/ABN composite with 2 wt% and 4 wt% ABN contents are relatively rough as shown in Fig. 9(b) and (c), indicating a strong interfacial bond between ABN and the BADCy resin. Furthermore, the fractured surface of BADCy/PBMAM/ABN composite with 6 wt% ABN content is rougher, and has dimples due to matrix yielding, reflecting typical ductile feature. Crack deflections are observed around the filler materials, suggesting that cracks were obstructed allowing the matrix to absorb more energy upon impact. Reactive groups on BN and PBMAM guarantee good dispersion in BADCy resin and an ability to impede crack growth and propagation, leading to higher toughening as shown in Fig. 9(d). However with the increase of ABN, agglomeration occurs gradually within the composite due to the van der Waals interactions between the adjacent ABN particles, leading to some defects that may compromise the mechanical properties of the composites (Fig. 9(e)).51 Moreover, at 6% content, ABN particles were uniformly dispersed and not agglomerated in the matrix as shown by the distribution of the boron element B in Fig. 9(f); this image is consistent with the results of the mechanical properties.
3.3 Improvement of thermal conductivity and electrical insulation properties
To obtain superior thermal conductivity (TC) of ceramic particles-filled composites, either the thermal conductive pathways should be maximized through high filler loading or the interfacial contact resistance be reduced by the enhancement of filler–matrix affinity. The thermal conductivities of neat BADCy and the BADCy/PBMAM/ABN composites with various ABN contents were investigated. In addition, the thermal conductivities of the BADCy/PBMAM/h-BN composites were also investigated to clarify the importance of modifying the original h-BN. The thermal conductivity of the neat BADCy resin was determined as 0.190 W m−1 K−1. The addition of BN leads to an increase in thermal conductivity, as shown in Fig. 10. It is shown that the thermal conductivity of the BADCy/PBMAM/BN composites increases with the addition of both h-BN and ABN. With the increase of BN content, BN particles could connect with each other and form networks of thermally conductive pathways.52 More importantly, the graphs show that the addition of ABN is more effective in increasing the thermal conductivity of the composites than that of the h-BN. The thermal conductivity of the BADCy/PBMAM/BN composite is 0.4358 W m−1 K−1 with addition of 8 wt% ABN, which is 2.29 times that of pure BADCy. Raw h-BN particles have inert surface that is difficult to react with the matrix. The weaker interaction between h-BN and matrix lead to agglomeration and voids which could act as heat reservoirs and restrict the heat transfer. On the other hand the grafted ABN with silane coupling agent act as a bridge in the system. The modified boron nitride (ABN) and cyanate ester react with each other to improve the crosslinking structures in the matrix and increase the filler–matrix interfacial interactions, further enhancing the thermal conductivity of BADCy/PBAMA/ABN composites.52 Therefore, the thermal conductivity of ABN-filled composite is 0.352 W m−1 K−1 with the addition of 6 wt% ABN, while that of the BADCy/PBMAM/h-BN composite is 0.294 W m−1 K−1. These values are 1.85 and 1.54 times higher, respectively, than that of the neat BADCy matrix. In other words, at 6 wt% ABN, the thermal conductivity of the composite increased by 85%. However, it seems that voids and other defects are also easily introduced into the BADCy/PBMAM/BN composites with the excessive addition of BN content.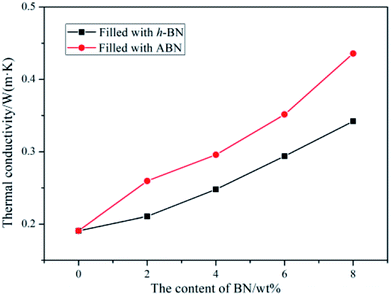 | ||
| Fig. 10 Thermal conductivity of the cyanate ester composites as a function of boron nitride content. | ||
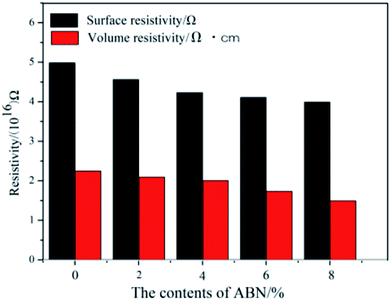
The electrical insulation properties of the composites were analyzed to check if the added constituents affect these properties. Fig. 11 shows the surface and volume resistivity of the neat BADCy resin and the fabricated composites as a function of ABN content. The surface resistivity slightly decreased with the addition of ABN material, whereas the volume resistivity was still maintained at almost the same level as the neat BADCy. After applying a voltage of 250 V, the surface and volume resistivity of the BADCy/PBMAM/h-BN composite at 6 wt% ABN content were 4.11 × 10¹⁶ Ω and 1.37 × 10¹⁶ Ω cm, whereas for the neat BADCy resin they were 4.98 × 10¹⁶ Ω and 1.77 × 10¹⁶ Ω cm, respectively. In addition, all of the test samples showed no dielectric breakdown even at the maximum voltage of the testing machine of 1000 V. The composites prepared in this study retained good electrical insulation properties, because of the inherent electrical insulating characteristic of the ABN fillers and BADCy matrix.53 These BADCy/PBMAM/ABN composites possess desirable properties for packaging materials that require electronic insulators with high thermal conductivity.54
4 Conclusion
Core–shell structured modifiers poly(n-butyl acrylate)/poly(methyl methacrylate-co-acrylamide) (PBMAM) with single size distribution were successfully prepared by seeded emulsion polymerization. Hexagonal boron nitride h-BN was successfully modified by silane coupling agent (AEAPS) to obtain functionalized ABN material. The PBMAM and the functionalized ABN were homogeneously dispersed in the BADCy matrix resulting in thermally conductive BADCy/PBMAM/ABN composites with a strong interfacial compatibility with the matrix. When the contents of PBMAM and ABN were 5 wt% and 6 wt%, respectively, the impact and flexural strengths of the composite were 2.51 times and 1.79 times higher than that of the pure cyanate ester resin, respectively. The thermal conductivity increased to 1.85 times higher than that of the pure resin. A slight decrease in insulation properties was observed with the addition of ABN, and the surface and volume resistivity of the composites were maintained at 4.11 × 10¹⁶ Ω and 1.37 × 10¹⁶ Ω cm, respectively at 6 wt% ABN. BADCy/PBMAM/ABN composites with excellent mechanical properties and thermal conductivity have been successfully prepared with potential applications in the electronics industry, thermal management application and aerospace industries.Conflicts of interest
There are no conflicts to declare.Acknowledgements
This research was funded by the Natural Science Foundation of Hebei Province (contract no. E2016202036), National Natural Science Foundation of China (contract no. 51573037), the Program of Science and Technology Plan of Tianjin (contract no. 17YFCZZC00280), the Program for Changjiang Scholars and Innovative Research Team (IRT13060), and the Key Lab for Micro- and Nano-Scale Boron Nitride Materials in Hebei Province.References
- Z. Wang, W. Zhou, L. Dong, X. Sui, H. Cai, J. Zuo and Q. Chen, J. Alloys Compd., 2016, 682, 738–745 CrossRef CAS.
- J. Gu, X. Yang, C. Li and K. Kou, Ind. Eng. Chem. Res., 2016, 55, 10941–10946 CrossRef CAS.
- Y. Zhu, X. Ye, M. Rong and M. Zhang, Compos. Sci. Technol., 2016, 135, 146–152 CrossRef CAS.
- F. Fang, G. Huang, H. Xiao, Y. Li, N. Hu and S. Fu, Compos. Sci. Technol., 2018, 156, 144–150 CrossRef CAS.
- M. Qian, V. Murray, W. Wei, B. Marshall and T. Minton, ACS Appl. Mater. Interfaces, 2016, 8, 33982–33992 CrossRef CAS PubMed.
- S. Wang, X. Xing, Y. Wang, W. Wang and X. Jing, Polym. Degrad. Stab., 2017, 144, 378–391 CrossRef CAS.
- J. Gu, C. Liang, J. Dang, W. Dong and Q. Zhang, RSC Adv., 2016, 6, 35809–35814 RSC.
- L. Wan, X. Zhang, G. Wu and A. Feng, Int. Eng. Technol., 2017, 2, 167–171 Search PubMed.
- Y. Tang, W. Dong, L. Tang, Y. Zhang, J. Kong and J. Gu, Compos. Commun., 2018, 8, 36–41 CrossRef.
- B. Wang, L. Liu, G. Liang, L. Yuan and A. Gu, J. Mater. Chem. A, 2015, 3, 23162–23169 RSC.
- J. Gu, S. Xu, Y. Tang, Z. Lv, C. Liang and X. Meng, RSC Adv., 2015, 5, 37768–37773 RSC.
- L. Tang, J. Dang, M. He, J. Li, J. Kong, Y. Tang and J. Gu, Compos. Sci. Technol., 2019, 169, 120–126 CrossRef CAS.
- T. J. Wooster, S. Abrol, J. M. Hey and D. R. MacFarlane, Composites, Part A, 2004, 35, 75–82 CrossRef.
- K. S. S. Kumar, C. P. R. Nair and K. N. Ninan, Eur. Polym. J., 2009, 45, 494–502 CrossRef CAS.
- X. Wang, J. Jin and M. Song, Eur. Polym. J., 2012, 48, 1034–1041 CrossRef CAS.
- Z. Zhang, L. Yuan, Q. Guan, G. Liang and A. Gu, Composites, Part A, 2017, 98, 174–183 CrossRef CAS.
- W. Ling, A. Gu, G. Liang and L. Yuan, Polym. Compos., 2010, 31, 307–313 CAS.
- B. F. Zhang, Z. G. Wang and X. Zhang, Polymer, 2009, 50, 817–824 CrossRef CAS.
- A. V. Rau, S. A. Srinivasan, J. E. McGrath and A. C. Loos, Polym. Compos., 1998, 19, 166–179 CrossRef CAS.
- C. W. Yang, G. Z. Liang and A. J. Gu, Ind. Eng. Chem. Res., 2013, 52, 15075–15087 CrossRef CAS.
- L. Yuan, G. Z. Liang and A. J. Gu, Polym. Degrad. Stab., 2011, 96, 84–90 CrossRef CAS.
- F. Yu, P. F. Zheng and A. J. Gu, Polym. Adv. Technol., 2004, 15, 628–631 CrossRef.
- X. X. Chen, G. Z. Liang, A. J. Gu and Y. Li, Ind. Eng. Chem. Res., 2015, 54, 1806–1815 CrossRef CAS.
- J. W. Hwang, K. Cho, T. H. Yoon and C. E. Park, J. Appl. Polym. Sci., 2015, 77, 921–927 CrossRef.
- G. Y. Chang and J. L. Hong, Polymer, 2000, 41, 4513–4521 CrossRef.
- T. Iijima, T. Kunimi, T. Oyama and M. Tomoi, Polym. Int., 2003, 52, 1–11 CrossRef.
- I. Harismendy, M. D. Rio, A. Eceiza, J. Gavalda and C. M. Gomez, J. Appl. Polym. Sci., 2015, 76, 1037–1047 CrossRef.
- X. Hu, J. Fan and C. Y. Yue, J. Appl. Polym. Sci., 2010, 80, 2437–2445 CrossRef.
- J. Borrajo, C. C. Riccardi, R. J. J. Williams, Z. Q. Cao and J. P. Pascault, Polymer, 1995, 36, 3541–3547 CrossRef CAS.
- R. W. Hillermeier, B. S. Hayes and J. C. Seferis, Polym. Compos., 2010, 20, 155–165 CrossRef.
- Z. Q. Cao, F. Mechin and J. P. Pascault, Polym. Int., 1994, 34, 41–48 CrossRef CAS.
- J. Wang, G. Liang, W. Zhao, S. Lv and H. Yan, Polym. Eng. Sci., 2006, 46, 581–587 CrossRef CAS.
- S. Ganguli, D. Dean, K. Jordan, G. Price and R. Vaia, Polymer, 2003, 44, 1315–1319 CrossRef CAS.
- J. Wang, H. Li, G. Li, Z. Liu, Q. Zhang, N. Wang and X. Qu, J. Appl. Polym. Sci., 2017, 134, 44978 Search PubMed.
- W. Han, L. Wu, Y. Zhu, K. Watanabe and T. Taniguchi, Appl. Phys. Lett., 2008, 93, 223103 CrossRef.
- C. Zhi, Y. Bando, C. Tang, H. Kuwahara and D. Golberg, Adv. Mater., 2009, 21, 2889–2893 CrossRef CAS.
- J. Gu, S. Xu, Q. Zhuang, Y. Tang and J. Kong, IEEE Trans. Dielectr. Electr. Insul., 2017, 24, 784–790 CAS.
- Y. Li, G. Xu, Y. Guo, T. Ma, X. Zhong and Q. Zhang, Composites, Part A, 2017, 107, 570–578 CrossRef.
- J. Gu, Z. Lv, Y. Wu, Y. Guo, L. Tian, H. Qiu, W. Li and Q. Zhang, Composites, Part A, 2017, 94, 209–216 CrossRef CAS.
- X. Yang, L. Tang, Y. Guo, C. Liang, Q. Zhang, K. Kou and J. Gu, Composites, Part A, 2017, 101, 237–242 CrossRef CAS.
- Y. Lin, T. V. Williams and J. W. Connell, J. Phys. Chem. Lett., 2010, 1, 277–283 CrossRef CAS.
- H. Li, J. Wang, G. Li, Y. Lv, N. Wang, Q. Zhang and X. Qu, Polym. Adv. Technol., 2017, 28, 699–707 CrossRef CAS.
- C. Xu, J. Ma, G. Li, N. Wang, Q. Zhang, M. E. Grami and X. Qu, J. Polym. Res., 2017, 24, 147 CrossRef.
- J. Hou, G. Li, N. Yang, L. Qin, M. E. Grami, Q. Zhang, N. Wang and X. Qu, RSC Adv., 2014, 4, 44282–44290 RSC.
- M. Du, Y. Wu and X. Hao, CrystEngComm, 2013, 15, 1782–1786 RSC.
- Y. M. Xue, A. Elsanousi, Y. Fan, J. Lin, X. W. Xu and Y. Lu, Solid State Sci., 2013, 24, 1–5 CrossRef CAS.
- Y. L. Liang and R. A. Pearson, Polymer, 2010, 51, 4880–4890 CrossRef CAS.
- N. Fu, G. Li, Y. Yao, N. Wang, E. M. Grami, Q. Zhang and X. Qu, Mater. Des., 2015, 87, 495–500 CrossRef CAS.
- P. X. Wu and L. C. Zhang, Polymer Blending, Chinese Light Industry Publishing, Beijing, 1998, p. 267 Search PubMed.
- J. Yu, X. Huang, C. Wu, X. Wu, G. Wang and P. Jiang, Polymer, 2012, 53, 471–480 CrossRef CAS.
- D. Quan and A. Ivankovic, Polymer, 2015, 66, 16–28 CrossRef CAS.
- C. B. Zhao, S. C. Xu and Y. F. Qin, Adv. Mater. Res., 2014, 893, 259–262 Search PubMed.
- Y. He, Q. Wang, W. Liu and Y. Liu, Phys. Status Solidi A, 2014, 211, 677–684 CrossRef CAS.
- Y. Cao, J. Feng and P. Wu, Carbon, 2010, 48, 3834–3839 CrossRef CAS.
| This journal is © The Royal Society of Chemistry 2019 |

