 Open Access Article
A general route to modify diatomite with niobates for versatile applications of heavy metal removal†
Tianning Wang,
Yunfei Yang,
Jinshu Wang *,
Junshu Wu
 *,
Lingmin Sun,
Yucheng Du,
Yongli Li and
Hongyi Li
The Key Lab of Advanced Functional Materials, Ministry of Education China, School of Materials Science and Engineering, Beijing University of Technology, Beijing 100022, China. E-mail: wangjsh@bjut.edu.cn; junshuwu@bjut.edu.cn; Fax: +86 10 6739 1101; Tel: +86 10 6739 1101
First published on 29th January 2019
Abstract
A general solution-phase strategy is developed to synthesize nanostructure niobates such as MnNb2O6, SnNb2O6 and ZnNb2O6 on natural mineral diatomite for water environmental remediation. (NH4)2C2O4 aqueous solution is the key to achieve a scalable and controllable synthesis of niobate/diatomite hybrid systems, which generates NH3·H2O for surface etching activation of diatomite, and H2C2O4 for complexation dissolution of Nb2O5, enabling the heterogeneous crystallization process to proceed with controllable growth kinetics. First principle calculations indicate that both niobium atom and niobium–oxygen species have the lowest adsorption energy on SiO2 surface, and then induce the nucleating process of Nb–O–Mn (or Zn, Sn) networks. Cr(VI), Fe(III), and Pb(II) ions are taken as target pollutants to evaluate the water-cleaning ability of the niobate-modified diatomite. Possible mechanisms for the photoreduction of Cr(VI), physical adsorption of Fe(OH)3 colloids, and chemisorption of Pb(II) ions are proposed on the basis of experimentally investigations. The possibility of combining the advantages of natural mineral diatomite and nanostructured niobates provides a highly robust and potential material system with versatile functionalities of heavy metal ion removal, demonstrating great promise for a wide range of water purification.
1. Introduction
Water contamination is one of the most urgent issues worldwide. Rapid industrialization and development, especially the excessive effluent of metal ions, exacerbates the problem of water pollution. Heavy metal ions like Cr(VI), Fe(III) and Pb(II) play vital roles in textile, paper, manufacturing and steel fabrication.1–3 Beyond their crucial functions in modern industry, these metal ions can be of great concern at elevated concentrations because of their toxicity as well as bioaccumulation tendencies.4 It is thus of great significance to design and synthesize effective and stable materials for removing these three metal ions by the preferred approaches from both scientific and practical perspectives. Natural minerals like zeolite, sepiolite, and attapulgite with high dispersity and more binding sites, are particularly suitable for use as both pristine adsorbents and carriers of active nanostructures.5–8 Diatomite is one of the most promising mineral materials for removing aqueous contaminants on account of its wide distribution, highly developed porosity, low cost and well adsorption performance.6 Derived from fossilized skeletons of diatoms, its main component is amorphous silica along with small quantities of metallic oxides.9 Due to its great chemical and thermal stability, diatomite has emerged as an attractive support for stabilizing and dispersing nanomaterials (e.g. Fe/Ni metals,6 TiO2,7 graphdiyne,10 etc.) to offer better removal efficiency and more active sites. It is also proved that these as-synthesized composited material systems show well synergistic effect in transferring contaminants to reactive sites and keeping them available for further interactions with metal ions, thus displaying superior water-cleaning activity, compared with separated nanostructures or diatomite.11Niobium (Nb)-containing oxides have recently emerged as a family of promising functional alternative nanostructures for water treatment due to their interesting chemistry such as intrinsic high energy level of Nb 4d orbital and distorted [NbO6] octahedra.12,13 As a typical member of the niobium (Nb)-containing oxides family, columbite-type structure possesses unique α-PbO2-type structure with half occupied oxygen packing along a-axis in the octahedral.14 The stability of [MO6] (M = Mn, Zn) in lower oxidation states could generate amounts of oxygen vacancies. Therefore, the structure with abundant edge sites exhibits great water cleaning ability.12,15 SnNb2O6 is another active niobate and has a typical froodite structure with two corner-sharing NbO6 octahedra and a distorted edge-sharing SnIIO8 square antiprism, owing to a stereo active lone electron pair of Sn(II). Hence, SnNb2O6 exhibits excellent photoactivity under visible light.16 Additionally, as a typical 2D layered material, SnNb2O6 can provide abundant interfacial contacts for heterogeneous adsorption. These two kinds of typical distorted structure (froodite-type and columbite-type) which possess abundant structural defects and active edge sites inspire us to investigate the elimination property for Cr(VI), Fe(III), and Pb(II) ions. Considering that the available niobate system still presents some drawbacks such as high synthesis cost and serious particle aggregation, it is alternative by immobilizing these niobate nanostructures on diatomite via solution-phase synthesis routes, which properly promotes affordable wastewater process development in practical applications.
Herein, we found that natural mineral diatomite was particularly suitable for loading nanostructures to building composited water-cleaning materials. We focus on synthetic tuning of niobate/diatomite hybrid systems using a general (NH4)2C2O4-assisted solution-phase route. As an inorganic nonmetallic mineral, Earth-abundant diatomite meets the requirements of a scalable and cost-effective synthesis. More importantly, high-active niobate nanostructures can be crystallized on diatomite by facile tuning of metal salts or solvent (water or ethanol). The integration of active nanostructures with the natural mineral enhances the light-absorption and surface activity, thus accelerating the water purification processes. As a proof-of-concept applications taking advantage of the unique features of these hybrid materials, the as-obtained MnNb2O6-, SnNb2O6-, ZnNb2O6-diatomites were used in three typical processes for removing pollutants, i.e., photoreduction of Cr(VI) to Cr(III), the physical adsorption of Fe(OH)3 colloids to eliminate Fe(III), and direct chemisorption removal of Pb(II) ions, demonstrating their versatile water-cleaning functionalities. The synthesis protocol of integrating diatomite with controlled niobate nanostructures provides a highly robust and potential material system for environmental purification, demonstrating great promise for a wide range of heavy metal ion removal.
2. Experimental
2.1 Materials
The raw diatomite was obtained from Changbai Mountain, Jilin Province of China. Manganese(II) chloride (MnCl2·4H2O), niobium oxide (Nb2O5) and oxalic acid (H2C2O4·2H2O) were purchased from Sinopharm Chemical Reagent Co., Ltd. Hydrofluoric acid (HF), lead nitrate (Pb(NO3)2), ferric trichloride hexahydrate (FeCl3·6H2O) and aluminum nitrate nonahydrate (Al(NO3)3·9H2O) were purchased from Tianjin Fuchen Chemical Reagent Factory. Tin(II) chloride (SnCl2·2H2O), anhydrous ethanol (C2H5OH), Hydrofluoric acid (HCl), sodium hydroxide (NaOH), sodium nitrate (NaNO3), sodium sulfate anhydrous (Na2SO4) and sodium dihydrogen phosphate (NaH2PO4·2H2O) were supplied by Beijing Chemical Reagent Research Company. Zinc nitrate hexahydrate (Zn(NO3)2·6H2O) and ammonium oxalate ((NH4)2C2O4) were purchased from Xilong Chemical Co., Ltd. Cadmium nitrate tetrahydrate (Cd(NO3)2·6H2O) was supported by Damao Chemical Reagent Factory. All chemicals used in this work were without further purification and the deionized water was used throughout this study.2.2 Preparation of samples
Raw diatomite (RD) was prepared by a facile alkali treatment before subsequent synthesized procedure. Typically, 6.0 g RD was dispersed in 300 ml 0.17 mol L−1 NaOH solution at 90 °C and keep stirring for 2 h. After separation from the dispersion, the RD was washed several times by water and anhydrous ethanol until pH value near neutral. After drying at 60 °C for 6 h, the alkali treated diatomite (ATD) was collected for subsequent procedure. In a typical procedure for MnNb2O6/ATD (MNOD) and ZnNb2O6/ATD (ZNOD), amorphous Nb2O5·nH2O was firstly prepared from 0.30 g commercial Nb2O5 powder (the synthesis process has been described in our previous work17). Typically, 0.30 g commercial Nb2O5 was prepared in 3.0 ml HF (40%) and then loaded into a 20 ml Telflon-lined stainless steel autoclave at 160 °C for 6 h. After cooling down to room temperature, 10 ml deionized water and 3.0 ml NH3·H2O (25–28%) were dropped in this solution. After filtering and washing to neutral with water, the amorphous Nb2O5·nH2O was dispersed in 10 ml (NH4)2C2O4 solution (0.08 mol L−1) at 80 °C under stirring for 3 min. 0.40 g MnCl2·4H2O (or Zn(NO3)2·6H2O) was slowly transferred into the above-mentioned solution. Keep stirring for 3 min, then 0.20 g ATD was put into the homogeneous solution. The mixture was then stirred continuously for 5 min to immobilize the as-prepared colloids onto ATD. Afterwards, the final mixture was loaded into a 20 ml Telflon-lined stainless steel autoclave and sealed by autoclave. The autoclave was heated at 180 °C for 24 h in an electric oven. After the autoclave was cooled down to room temperature, the final mixture was separated by filtration and rinsed with deionized water and anhydrous ethanol for three times, and dried at 60 °C for 6 h. The synthesis procedure of SnNb2O6/ATD (SNOD) is almost the same as MNOD, except that 0.50 g SnCl2·4H2O was dispersed in 10 ml anhydrous ethanol in replace of 10.0 ml deionized water.2.3 Characterization
The crystallographic information and chemical composition of as-prepared niobate/diatomite samples were characterized by SHIMADZU XRD-7000 XRD diffractometer, equipped with Cu-Kα radiation (λ = 0.154056 nm) at a scanning speed of 4° min−1. A Hitachi S-4800N scanning electron microscopy (SEM) and JEM-2010 transmission electron microscopy (TEM) were applied to detect the structural and morphological information of samples. The optical properties were recorded on a UV-vis spectrophotometer (Shimadzu-3600 plus) in the wavelength range of 200–800 nm at room temperature. Fourier transform infrared spectroscopic (FT-IR) measurements were operated on a PerkinElmer spectrometer (spectrum 100) in the range of 400–4000 cm−1at the resolution 4 cm−1. The samples were prepared by mixing 1 mg of the as-prepared powder with 100 mg of KBr and pressing the mixture into a thin film, and all samples were baseline corrected. Nitrogen adsorption/desorption tests were measured by a surface area and porosity analyzer (ASAP 2020 (V4.00H)) at 77 K. And before the test, samples were degassed at 573 K for 3 h. X-ray photoelectron spectroscopic (XPS) spectra of the samples were performed on ESCALAB 250Xi electron spectrometer with Al Kα X-ray source. The Fe(III) and Pb(II) concentrations were determined by inductively coupled plasma atomic emission spectroscopic (ICP-AES, IRIS Intrepid ER/S). Zeta potentials measured at various pH values were tested by zeta potential analyzer (Malvern Nano-2S90).2.4 Cr(VI), Fe(III), and Pb(II) ion elimination tests
The photocatalytic activities of niobate/diatomite were evaluated by using photoreduction removal of Cr(VI) under light irradiation. Briefly, 20 mg niobate/diatomite powder was dispersed in 60–120 mg L−1 Cr2O72− aqueous solution in a 100 ml beaker, then the suspension was sonicated for 15 s and kept in dark for 1 h to establish an adsorption/desorption equilibrium between photocatalyst and Cr(VI) ions. Afterwards, 20 mg oxalic acid was added into the solution as hole scavenger.12 Then the mixed solution was stirred under visible light irradiation (MNOD and SNOD, 300 W xenon lamp with an ultraviolet cutoff filter, λ > 420 nm) or ultraviolet light irradiation (ZnNb2O6, 300 W xenon lamp with a visible-light cutoff filter, λ < 400 nm). At a given reaction time, 3.0 ml aliquot dispersions were taken for analysis, followed by filtration to remove precipitates. The obtained supernatant was detected by UV-vis spectrophotometer to determined Cr(VI) reduction at the absorbance peak of 350 nm. The photocatalytic efficiency is describe by [η = C/Co × 100% = A/Ao × 100%], where C0 and C represents initial and current concentration of Cr2O72− solution, A0 and A corresponds to initial and current adsorption intensity.The Fe(OH)3 colloids were prepared by the hydrolysis of FeCl3·6H2O in boiling water. And the synthesis details of Fe(OH)3 colloids is exactly the same as the previously reported method.18 Specially, a certain amount of FeCl3·6H2O was resolved in 5.0 mL deionized water. Then the as-prepared solution was transferred in 300 ml boiling water and continued heating for 10 min. After cooling down to room temperature, the Fe(OH)3 colloids was obtained. 50 ml of Fe(OH)3 colloids or Pb(NO3)2 aqueous solution with a certain concentration was added into a 100 ml beaker. 20 mg of the as-prepared sample was added into the above colloids or aqueous solution, and then the beaker was sonicated for 15 s to make a better dispersion. At a certain interval, 3 ml aliquot dispersions were filtered by a filter to obtain the filtrate for further analysis. To prevent the hydrolysis of Fe(III), all the Fe(OH)3 colloid after adsorption were added 0.1 ml HCl (38 wt%). The Fe(III) and Pb(II) concentrations in the filtrates were analyzed by the ICP-AES technique. The adsorption capacity of Fe(OH)3 colloid was determined by the unit change between Fe(OH)3 and Fe(III). The pH value was adjusted by 1 mol L−1 HCl or 1 mol L−1 NaOH aqueous solution in this work.
2.5 First principle calculation of Mn, Sn, Zn, Nb atoms adsorption on silica
The adsorption energy of Mn, Sn, Zn, Nb on silica was calculated with the projected augmented wave (PAW) formalism of DFT, as implemented in the Vienna Ab initio simulation package (VASP).19 (101) face of SiO2 is selected for the calculation considering that it is the observed strongest peak in the XRD pattern of RD. Perdew–Burke–Ernzerhof of (PBE) exchange-correlation (XC) function of the generalized gradient approximation (GGA) was employed for all our calculations,19 which are shown to be very effective for cluster20 and surface calculations.21 The cut-off energy of 600 eV for plane wave basis expansion was used. The model system used in this work consists of 4 × 4 super cell with a vacuum layer of 15 Å in the Z direction to exterminate the interaction between adjacent layers. The Brillouin zone was sampled using Γ-centered 7 × 7 × 1 k-point grid and the atomic relaxations were continued until the Hellmann–Feynman forces acting on the atoms were less than 0.01 eV Å−1 and the total energy changes were less than 10−6 eV.223. Results and discussion
XRD analysis of the as-prepared MNOD, SNOD and ZNOD samples are shown in Fig. 1 and S1.† The main diffraction peaks of MNOD at 24.1°, 29.8°, 51.1°, and 52.7° correspond to (130), (131), (330), and (261) planes of manganocolumbite MnNb2O6 (JCPDS# 33-0899) (Fig. 1(a) and S1(a)†), respectively. No impurity peaks of manganese oxide or Nb2O5 are detected, indicating that pure MnNb2O6 can be successfully crystallized on ATD. The XRD patterns also demonstrate that other niobates, ZnNb2O6 (JCPDS# 76-1827) (Fig. 1 and S1(b)†) and SnNb2O6 (JCPDS# 84-1810) (Fig. 1 and S1(c)†), are grown on ATD, indicating the generalization of our designed reaction system for niobate/diatomite composites. The light absorption properties of niobate/diatomite are shown in Fig. 1(b). The photoresponse area of MNOD and SNOD locates in the visible region with the absorption edges of 630 nm and 540 nm, respectively, while ZNOD shows an ultraviolet absorption below 370 nm. Compared with ATD sample with poor light-harvesting ability, the loading of niobates enhances the absorption intensity and extends photoresponse range. The inset of Fig. 1(b) displays band gaps of MNOD, SNOD and ZNOD. According to Tauc plot of (αhv)2 versus energy (hv), the band gap energy of MNOD, SNOD and ZNOD is estimated about 2.41 eV, 2.89 eV and 3.80 eV, respectively. The nitrogen adsorption–desorption isotherms of MNOD, SNOD and ZNOD are displayed in Fig. 1(c), which are assigned as type III, mainly due to mesoporous structure and an aggregate character of sheet-like particles.23 The adsorption capacity of niobate/diatomite exhibits a moderate growth at low relative pressure, and then a steady increase is observed in high relative pressure range of 0.6–1.0, which is attributed to smaller crystallite and much rough surface in comparison to that of ATD. The BET surface area increases from 12.7 (ATD) to 49.9 m2 g−1 for MNOD, 52.9 m2 g−1 for ZNOD, and 64.0 m2 g−1 for SNOD. FT-IR spectra show the details of the synthesized niobate/diatomite samples at 400–1800 cm−1 (Fig. 1(d) and S2†). Three strong peaks of MNOD, ZNOD and SNOD are reflected in the absorption spectra, with wave number of 447 cm−1 assigned to the Si–O–Si function group. The peaks located at 792 cm−1 and 1070 cm−1 belong to the bending vibration and symmetrical stretching vibration of Si–O functional group.24 For MNOD, the peak at 527 cm−1 is caused by the vibration between Mn and O.25 The two absorption peaks appeared at 570 cm−1 and 646 cm−1 are attributed to the vibration of Sn–O bonds of SNOD.26,27 The absorption observed at 566 cm−1 in ZNOD is corresponded to the stretching of Zn–O bonds.28 These FT-IR spectra further confirm the generation of MnNb2O6, SnNb2O6, and ZnNb2O6 on diatomite surface.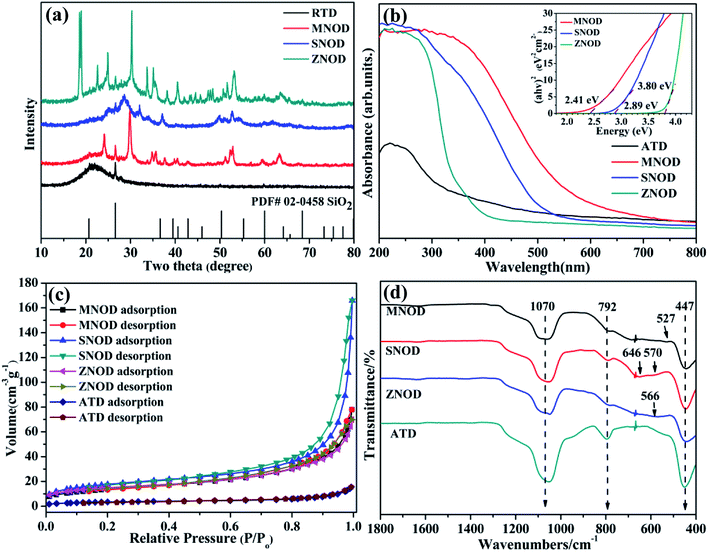 | ||
| Fig. 1 (a) XRD patterns, (b) UV-vis absorption spectra, (c) nitrogen sorption isotherms, and (d) FT-IR spectra of the as-prepared MNOD, SNOD and ZNOD. | ||
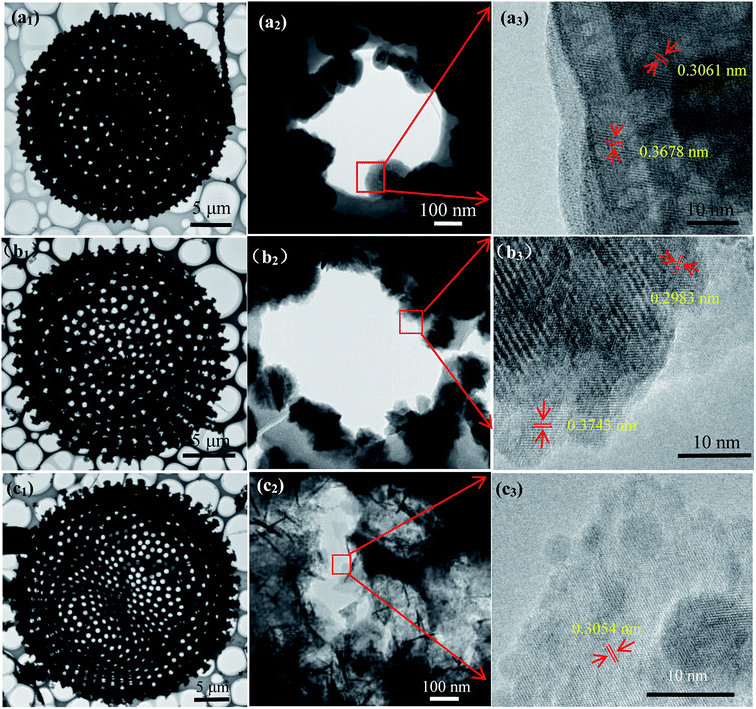
The detail of morphology exhibits uniform flower-like MnNb2O6 particles on diatomite surface (Fig. 2(a1, a2) and S3(a1, a2),† suggesting that the heterogeneous nucleation and crystallization processes of MnNb2O6. The high magnification image reveals that MnNb2O6 particle consists of nanosheets with the intrinsic six fold symmetry of columbite structure. The sheet-shaped structure is well crystallized with resolved lattice fringes having interplaner spacing of 0.306 nm and 0.368 nm (Fig. 2(a3), which well match (311) and (310) planes of MnNb2O6 (JCPDS# 33-0899), respectively. As shown in Fig. 2(b1, b2) and S3(b1, b2),† the ZnNb2O6 sample has a similar morphology feature with hexagon-like aggregated nanoparticles. Fringes of d = 0.298 nm and d = 0.374 nm (Fig. 2(b3)) are well indexed to the (311) and (111) planes of ZnNb2O6, respectively. Those SnNb2O6 particles grown on diatomite exhibit wrinkled lamellar morphology with smooth surface and well-defined edge (Fig. 2(c1, c2) and S3(c1, c2)†). The lattice spacing of SnNb2O6 sheet is 0.305 nm (Fig. 3(c3), corresponding to the lattice spacing of (311) plane. Notably, few irregular aggregates can be found in these niobate modified ATD samples, suggesting alkali (NaOH) treatment of diatomite has a great impact on the crystallization of the well-defined niobates, which generates abundant nucleation sites in the liquid-phase synthesis procedure compared with the samples prepared by RD (Fig. S4†). As a strong alkaline, NaOH etches diatomite surface by breaking Si–O–Si bonds to generating highly active surface that enables the heterogeneous crystallization process of niobate nanostructures.
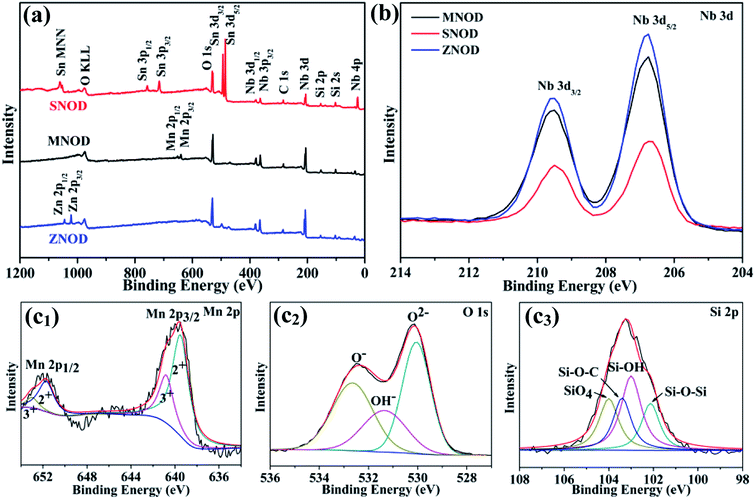 | ||
| Fig. 3 (a) XPS survey scan and (b) high resolution XPS scan of Nb 3d in MNOD, SNOD and ZNOD. (c1–c3) Mn 2p (c1), O 1s (c2), and Si 2p (c3) in MNOD. | ||
Further insights into the structure of the niobate/diatomite system are obtained from their XPS analysis. Fig. 3(a) displays the full survey scan of MNOD, ZNOD and SNOD. The signals of Nb, O, Si, Mn, Zn and Sn can be clearly detected in these as-prepared samples. The Nb 3d high resolution scan of niobate/diatomite (Fig. 3(b)) shows two typical Nb 3d5/2 and Nb 3d3/2 peaks located at 206.7 eV and 209.5 eV, demonstrating that the oxidation state of Nb element is Nb(V).13 In the high-resolution spectra of Mn 2p (Fig. 3(c1)), four subpeaks can be observed after fitting: two peaks centered at 639.5 eV and 651.7 eV are assigned to the binding energy of Mn(II), while the other two peaks at 640.8 eV and 653.1 eV correspond to the signal of Mn(III). It means that there is oxygen deficiencies existed in the MNOD.12 The O 1s high-resolution spectra can be deconvoluted into three peaks located at 530.3 eV, 531.8 eV and 532.9 eV (Fig. 3(c2)), assigned to the lattice oxygen, surface hydroxyl oxygen and Si–O–Si binding, respectively.29 The main peaks of Si 2p in MNOD attribute to silicious species of Si–O–Si (102.1 eV), Si–OH (103 eV), Si–O–C (103.4 eV), and SiO4 (104 eV) (Fig. 3(c3)).30,31 Similar analyses were performed on the ZNOD and SNOD samples. As depicted in Fig. S5(a1),† the peak located at 1021.8 eV is characteristic of Zn 2p3/2 in ZNOD,32 and the high resolution scan shows two typical binding energies (486.3 eV and 494.7 eV) of Sn 3d in SNOD (Fig. S5(b1)†).33
Diatomite has a similar nature to amorphous silica with acid sites and various hydroxyl species on its surface, including isolated hydroxyl groups and H-bonded hydroxyl groups, which can be ascribed to the coordination to the silicon atom in its structure. In aqueous solution, the surface Si–OH groups are easily hydrolyzed into Si–O–, resulting in electronegative surface which is beneficial for the adsorption of metal-ion-concluding species for nucleation. Generally, the impurity in the natural diatomite is considered as the interference on the uptake of metal ions. In view of optimization for the adsorption process, alkali treatment for impurity becomes a necessity. Although the surface area of diatomite is slightly changed (RD: 10.2 m2 g−1, ATD: 12.9 m2 g−1), the surface impurity in RD is removed and soluble SiO42− species are generated after NaOH washing.34 More importantly, the number of surface functional groups including Si–O– and surface OH− is increased. The detailed FT-IR spectrum in Fig. 4(a) demonstrates that the vibration peaks located in 792 cm−1 (Si–O– bending vibration) and 1070 cm−1 (Si–O symmetrical stretching vibration) show remarkable enhancement, and the O 1s of high resolution XPS scan (Fig. 4(b) and S6†) also reveals noticeable intensity improvement of surface hydroxyl. The surface activation accelerates the heterogeneous nucleation and crystallization of niobates, which is a more energetically favored process than the generation of new solid particles via the heterogeneous growth. Without surface activation of RD, homogeneous precipitates and particle aggregation of niobate are frequently observed (Fig. S4†), indicating low efficiency for heterogeneous crystallization of niobates on RD. Moreover, both FT-IR (Fig. 4(c)) and XPS (Fig. 4(d)) results exhibit that the peak intensity of Si–O– functional groups and surface hydroxyls weakens with the reaction time, indicating their key roles for the induced crystallization of niobate guests.35 More specifically, the bonding energy of lattice oxygen has slight increase owing to newly formed chemical bonds in ATD–niobate hybrid systems. Knowledge on the activation can potentially lead to control over early crystallization of the resulting niobate nanostructures. Concisely, the main questions are the following: (1) owing to structural and composition complexity of ternary oxides, which metal ions is preferentially adsorbed and bonded on ATD for the heterogeneous nucleation? (2) What is the growth mechanism, especially the role of (NH4)2C2O4 in the general solution-phase synthesis?
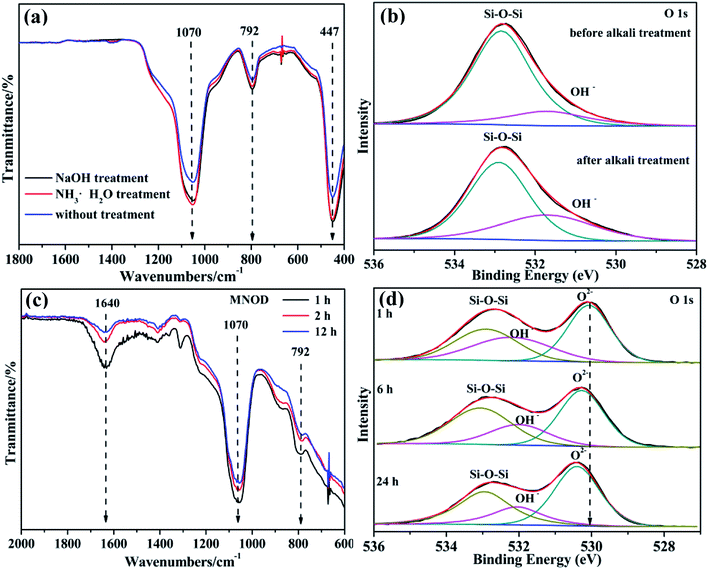 | ||
| Fig. 4 (a) FT-IR spectra and (b) O 1s high resolution XPS scan of RD and ATD. (c) FT-IR spectra and (d) O 1s high resolution XPS scans of MNOD in different reaction time. | ||
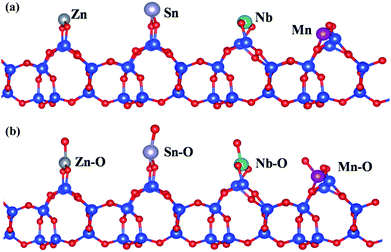
The adsorption energy (Ead) of Nb atoms on SiO2 (101) face were calculated with PBE exchange-correlation (XC) function of GGA, and Mn, Zn, Sn atoms were took as the comparison. Specially, the different atoms were placed on the same parallel surface according to calculations (Fig. 5(a)). The calculation results (Table 1) indicate that the adsorption of Nb atom (−6.82 eV) owns a lowest Ead compared with other three atoms, meaning that on the SiO2 surface Nb atoms would band together with O atoms more preferentially than the other three atoms. In the case of niobate, niobium is not in monatomic form but is bonded to oxygen. Therefore, the Ead would be influenced by the boned oxygen atoms. So the influence on Nb adsorption of bonded oxygen atoms was also taken into consideration (Fig. 5(b) and Table 1). It is deduced that the addition of oxygen atoms could promote the adsorption of four atoms in different extent, but does not reverse the order and adsorption preference. It follows that niobium can be adsorbed on the diatomite (SiO2) surface much more easily and takes the lead in nucleating process, and then Nb–O–Mn (or Zn, Sn) network is generated in the separate heterogeneous crystallization process which is responsible to the built of niobate nanostructures on ATD. The dissolution of Nb2O5 is favorable for preparing niobates on ATD considering that the starting materials can be dissolved homogeneously and that the reagents have sufficient time to react with metal (Mn, Zn, Sn) salts. Nb2O5 is insoluble in pure water owing to its chemical inertness and high stability. H2C2O4 is produced in situ as a hydrolysis product by the introduction of (NH4)2C2O4 (eqn (1)), and acts as a chemical etchant of Nb2O5 to form peroxo–carboxylate–niobium complexes ([NbO(C2O4)x·yH2O](2x−3)−, x = 2 or 3) with α-hydroxyl organic acids as chelating agents. Nb–O groups are generated in the complexation reactions (eqn (2)),36 resulting in high Nb–O concentration regions around the ATD with abundant surface Si–OH (or Si–O–) groups which serve as the active sites for the opening up of new nucleation and the subsequent surface heterogeneous crystallization for MNOD, ZNOD and SNOD.
(NH4)2C2O4 + 2H2O ![[left over right harpoons]](https://www.rsc.org/images/entities/char_21cb.gif) 2NH3·H2O + H2C2O4 2NH3·H2O + H2C2O4
| (1) |
[NbO(C2O4)x·yH2O](2x−3)− ![[left over right harpoons]](https://www.rsc.org/images/entities/char_21cb.gif) NbO3+ + xC2O42− + yH2O NbO3+ + xC2O42− + yH2O
| (2) |
| Nb | Mn | Sn | Zn | |
|---|---|---|---|---|
| Ead (A)/eV | −6.82 | −5.18 | −2.96 | −0.27 |
| Ead (A–O)/eV | −20.53 | −18.57 | −14.99 | −11.60 |
Furthermore, (NH4)2C2O4 also play a dominant role in continuously providing surface hydroxyl for Nb–O adsorption and subsequent niobate nucleation. NH3·H2O is consumed from the very beginning of the chemical reactions due to surface dissolution of ATD to form active micro-sized zones, and there should be a dynamic equilibrium between the etching consumption of NH3·H2O by ATD and complexation of C2O42− with Nb–O groups, where ATD stays in the form of high-energy surface owing to surface etching reaction of NH3·H2O, allowing that the dissolution of Nb2O5 and H2C2O4 complexation proceed to activate the supply of Nb–O units of niobate growth. Tuning the synergistic effects of these two concurrent but separate processes changes the etching rate of ATD and the growth kinetics of niobate, and thus enables the heterogeneous crystallization process to proceed at an appreciable rate to form various nanostructures. Experimentally, at a fixed concentration of (NH4)2C2O4 (0.08 mol L−1) while replacing MnCl2 by MgCl2, MgNb2O6 nanosheets were also grown on ATD although concomitant MgC2O4 impurity was found (Fig. S7†), further confirming that the developed approach is remarkably simple yet versatile for effectively generating niobate coatings crystallized on ATD with a high level of control and flexibility.
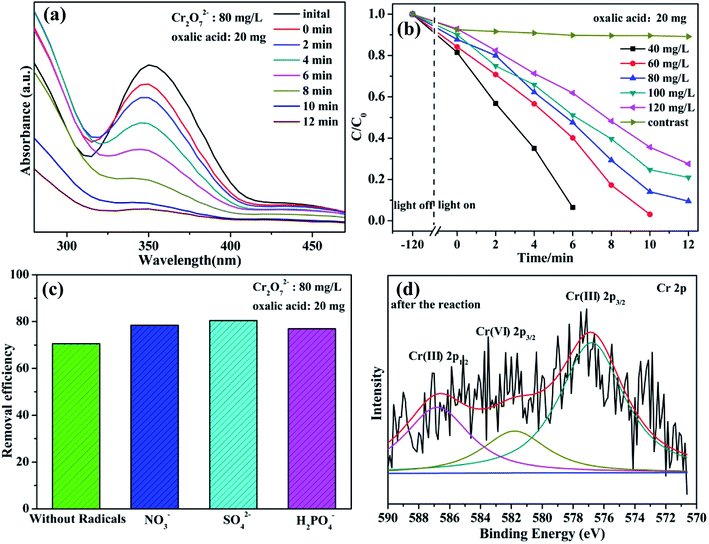
Cr(VI) is a typical kind of high soluble heavy metal contaminant in industry effluents. Photocatalytic reduction of Cr(VI) into Cr(III) is one of effective approaches frequently chosen for Cr(VI) pollution deep elimination owing to nontoxicity, less sludge as well as environmental friendliness.37 These as-synthesized niobate/diatomite materials are used for photocatalytic conversion of Cr(VI) into Cr(III) with the assistance of oxalic acid under light illumination. High photocatalytic performance is first confirmed by visual observation of peak intensity weakening within the reaction of 12 min (Fig. 6(a)). Notably, 80 mg L−1 Cr2O72− solution is dramatically reduced to Cr(III) via MNOD sample (20 mg) under visible light (25 °C). Additionally, under the conditions of weak natural sun light irradiation (35 °C), 80 mg L−1 Cr2O72− solution can also be converted with 20 min (Fig. S8(a)†), implying great potentials in practical real-world conditions. Variation of the concentration of Cr2O72− (40–120 mg L−1) as a function of time shows that the photoreduction rate decreases along with the increased concentration (Fig. 6(b)), while there are not obvious change using ATD. It is the photocatalysis rather than photolysis plays a dominant role in Cr(VI) reduction. To simulate practical conditions, acid radicals (NO3−, SO42− and H2PO4−) in Cr(VI) solution were also taken into account (Fig. 6(c)). Intriguingly, the existence of acid radicals makes a better removal efficiency of Cr(VI) in 10 min. These acid radicals adsorbed on niobate surface act as electron donors and trap holes, thereby accelerating electron circulation. In principle, acid radicals play the same role to oxalic acid, thus improving photocatalytic efficiency.38 High resolution XPS scan of Cr 2p for niobate/diatomite was analyzed (Fig. 6(d) and S8(e, f)†) to determine the oxidation state of Cr element after photoreduction. The Cr 2p peaks can be divided into three peaks at the binding energy of 576.8, 581.8 and 586.8 eV, which correspond to Cr(III) 2p3/2, Cr(VI) 2p3/2 and Cr(III) 2p1/2, respectively, confirming Cr(VI) photoreduction of ending in less noxious Cr(III) species.12 ZNOD and SNOD samples also show well Cr(VI) photoreduction ability with the existence of oxalic acid (Fig. S8(b–d)†) indicating that the obtained hybrid materials can provide convenient water-cleaning for the light-driven Cr(VI) elimination. It is also observed that there are not obvious change of microstructure and morphology of MNOD, ZNOD and SNOD after photocatalytic applications (Fig. S9 and S10†).
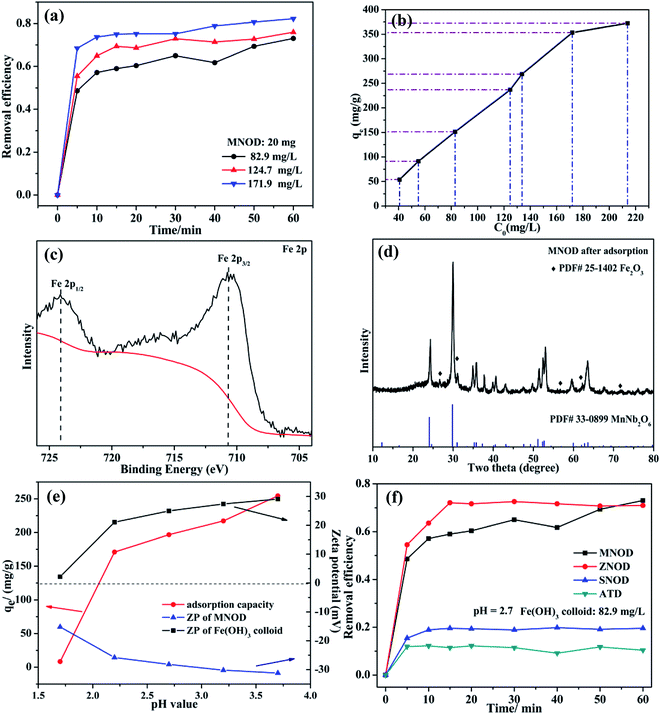
The oxidation state of Fe(III) is very stable in majority conditions and acts as an important role in oxygen uptake and metabolic processes.39 However, the removal of Fe(III) is essential, considering the overloading and deficiency of Fe(III) will trigger biological disorders in human body, like hepatic cirrhosis and anemia.40 Nonetheless, due to the strong hydrolytic tendency and a 6-fold coordination of Fe(III), aqueous ferric hydroxide species are the primary existence form in natural water.41 Thus the adsorption removal of ferric hydroxide (Fe(OH)3) colloid in aqueous solution may be one of the most preferred routes for eliminating Fe(III) pollution. Fig. 7(a) shows the influence of adsorption time on the removal efficiency of Fe(OH)3 colloids by using MNOD at room temperature. The efficiency increases rapidly in the first 10 min and keeps steady subsequently. The adsorption capacity of MNOD shows a regular linear plot with the extension of Fe(OH)3 colloid concentration (Fig. 7(b)), which reaches saturated state when the concentration exceeds 171.9 mg L−1. High resolution XPS scan of Fe 2p is analyzed to gain insights into Fe(OH)3 colloid adsorption (Fig. 7(c)). There are two typical peaks Fe 2p3/2 and Fe 2p1/2 located at 711.4 eV and 724.5 eV, indicating the oxidation state of Fe element is Fe(III).42 Noteworthy that the transformation of Fe(OH)3 into Fe2O3 is considered as a topotatic reaction in practical condition.43 The XRD pattern suggests that Fe2O3 exists on MNOD surface after adsorption, which is consistent with the XPS results (Fig. 7(d)). The red color of MNOD after adsorption also demonstrates the formation of Fe2O3 particles (Fig. S11†). Zeta potential was employed to analyze the surface potential of Fe(OH)3 colloids and MNOD adsorbent in different pH values (Fig. 7(e)). The Fe(OH)3 colloids are positive while the surface of MNOD is full of negative charges. The driving force of this adsorption process is thus electrostatic attraction. The variation of adsorption capacity at a range pH 3.7 to 1.7 results from the potential difference between MNOD and Fe(OH)3 colloid. While in highly acidic environment (pH = 1.7), the adsorption capacity has a sudden fall, which is attributed to the structure destruction of Fe(OH)3 colloids in strong acid solution. Compared with MNOD, the removal capacity of ZNOD is comparatively alike especially in the solution pH = 2.7, and it is smaller for SNOD sample (Fig. 6(f) and S12†). Zeta potential analysis indicates that the surface potentials of ZNOD and SNOD are −29.2 and 26.3 mV in aqueous solution (pH = 2.7), respectively (Fig. S13†). The electrostatic attraction identically dominates the adsorption process of Fe(OH)3 colloids with ZNOD and SNOD.
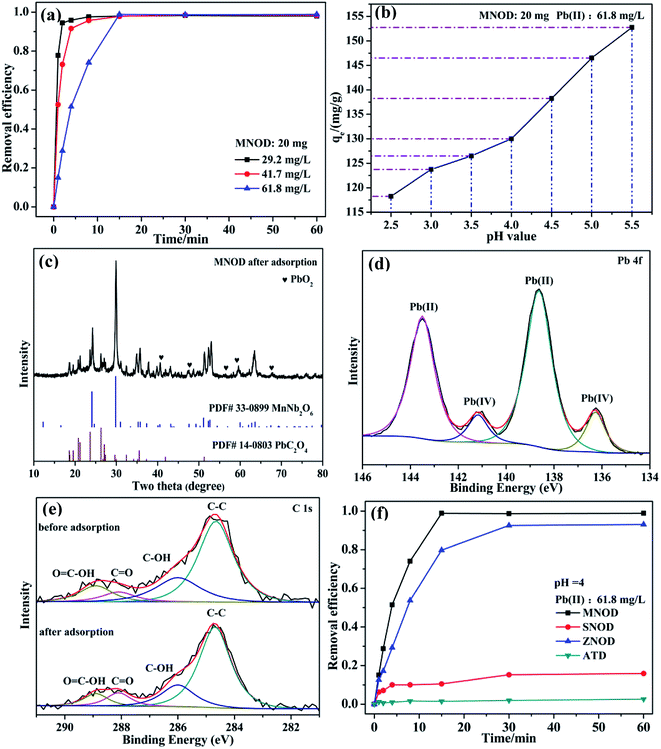
As a highly bio-incompatible toxic ion, Pb(II) is characterized by its non-biodegradability and carcinogenicity.44 The physical adsorption route shall be of its high efficiency, cost-effectiveness as well as easy operation for eliminating Pb(II) contamination.45 However, considering the safe concentration for Pb(II) in water discharge is as low as 1.0 mg L−1 in China,46 chemisorption may be one of the most suitable ways for deep elimination of Pb(II) ions to avoid the production of lots of mixed slurry and the use of high-energy separation processes such as ultrafiltration or nanofiltration. The adsorption tests in Fig. 8 show that the removal efficiency of Pb(II) increases rapidly and reaches saturation stability within 15 min by using MNOD sample at room temperature (Fig. 8(a)). Considering practical severe application conditions and avoiding precipitation of lead hydroxides, the influence of pH (2.5–5.5) is also taken into account. As depicted in Fig. 8(b), the adsorption capacity shows a gradual decrease with more acid environment which influences the surface potential. XRD patterns and high resolution XPS scan of MNOD sample after Pb(II) adsorption indicate that, intriguingly, chemisorption dominates the process and there are PbC2O4 and PbO2 (Fig. 8(c)) formed on the material surface. The high resolution XPS scan of Pb 4f (Fig. 8(d)) reveals that there are two peaks of Pb(II) (138.4 eV and 143.5 eV) and Pb(IV) (136.4 eV and 141.2 eV).47,48 In our preparation process, (NH4)2C2O4 was used as a regular chemical agent for inducing niobate crystal heteronucleation by surface complex and hybrid. Two typical peaks of C 1s located at 288.1 eV and 288.9 eV correspond to C![[double bond, length as m-dash]](https://www.rsc.org/images/entities/char_e001.gif) O and O
O and O![[double bond, length as m-dash]](https://www.rsc.org/images/entities/char_e001.gif) C–OH (Fig. 8(e)), demonstrating the surface complexation of C2O42−. Noteworthy that even though going through adsorption process, as depicted in XPS data, these oxygen-containing C2O42− groups exist on MNOD surface, thus facilitating crystal nucleation of PbC2O4 during Pb(II) adsorption. It is reasonable to assume that the variation of removal efficiency in different pH value is associated with surface state modified by oxalate species. As illustrated in eqn (3) and (4), a competition between H+ and Pb(II) combining with C2O42− occurs simultaneously. In a more acid environment (pH = 2.5–5.5), H+ ions occupy the most part of binding sites and hinder Pb(II) adsorption process. Moreover, according to XPS result in Fig. 3(c1), Mn(III) exists in MnNb2O6. The standard electrode potential of Mn(III) (1.51 V) is higher than PbO2 (1.46 V), as illustrated in eqn (5) and (6), and part of Pb(II) ions contacted with MnNb2O6 surface can be oxidized into Pb(IV)–PbO2.
C–OH (Fig. 8(e)), demonstrating the surface complexation of C2O42−. Noteworthy that even though going through adsorption process, as depicted in XPS data, these oxygen-containing C2O42− groups exist on MNOD surface, thus facilitating crystal nucleation of PbC2O4 during Pb(II) adsorption. It is reasonable to assume that the variation of removal efficiency in different pH value is associated with surface state modified by oxalate species. As illustrated in eqn (3) and (4), a competition between H+ and Pb(II) combining with C2O42− occurs simultaneously. In a more acid environment (pH = 2.5–5.5), H+ ions occupy the most part of binding sites and hinder Pb(II) adsorption process. Moreover, according to XPS result in Fig. 3(c1), Mn(III) exists in MnNb2O6. The standard electrode potential of Mn(III) (1.51 V) is higher than PbO2 (1.46 V), as illustrated in eqn (5) and (6), and part of Pb(II) ions contacted with MnNb2O6 surface can be oxidized into Pb(IV)–PbO2.
| C2O42− + H+ → HC2O4− | (3) |
| C2O42− + Pb2+ → PbC2O4 | (4) |
| Mn3+ → Mn2+ + e− φ = 1.51 V | (5) |
PbO2 + 4H++ 2e− ![[left over right harpoons]](https://www.rsc.org/images/entities/char_21cb.gif) Pb2+ + 2H2O φ = 1.46 V Pb2+ + 2H2O φ = 1.46 V
| (6) |
ZNOD possesses similar adsorption behavior towards Pb(II) ions by forming PbC2O4 (Fig. 8(f) and S14†). However, the adsorption capacity of SNOD is relatively low on account of a weak modification by oxalate species (Fig. S15†). For practical usage, the structure-sensitive chemisorption of MNOD and ZNOD is more suitable for deep removal of Pb(II) ions compared with physical absorption, and one option we are working on is to produce MNOD and ZNOD with more abundant surface carboxyl groups.
We have further studied the stability and reusability of MNOD by collecting and reusing for four cycles. As shown in Fig. S16.† The collected MNOD powder was directly reused for Cr(VI) photoreduction, and was renewed via dispersing the powder in 0.1 M HNO3 for 3 h after Fe(OH)3 colloid adsorption or Pb(II) ion adsorption. Experimental results showed that the renewed MNOD materials keep almost the same Fe(OH)3 adsorption performance, while the reusability of MNOD for Cr(VI) photoreduction and Pb(II) elimination demonstrated great decrease due to existing surface chemical reactions in their photoreduction and chemisorption processes.
4. Conclusions
In summary, we developed a general, scalable and controllable strategy to in situ grow nanostructured niobates on alkali treated diatomite with the assistance of (NH4)2C2O4 regardless of their composition and structure. The central synthesis is based on simultaneous surface etching activation of diatomite by NH3·H2O during complexation dissolution of Nb2O5 with H2C2O4, allowing the heterogeneous crystallization process to proceed with controllable growth kinetics. Calculation results via PBE exchange-correlation (XC) function of GGA demonstrate that the adsorption of Nb atom owns a lowest Ead compared with other three atoms of Mn, Zn, and Sn, meaning that Nb atoms will band together with O atoms more preferentially on the SiO2 surface and take the lead in heterogeneous nucleating process of Nb–O–Mn (or Zn, Sn) networks. The possibility of combining the advantages of natural mineral diatomite and nanostructured materials provides the access to versatile functionalities of water purification. The obtained composites possess well removal ability for Cr(VI), Fe(III) and Pb(II) ions owing to their great dispersity and high surface area. Typically, MNOD exhibits well photoreduction ability for Cr(VI) both under xenon lamp and sunlight irradiation, and adsorption capacity for Fe(OH)3 colloids and Pb(II) ions. The electrostatic attraction dominates the adsorption process of Fe(OH)3 colloids, and surface chemistry-related chemisorption is involved in the deep purification of Pb(II) polluted water. Given the low-cost and eco-friendly nature of the obtained diatomite-based materials, this work really offers a realistic methodology for diatomite utilization in water-cleaning field.Conflicts of interest
The authors declare that they have no conflict of interest.Acknowledgements
This study was funded by National Key R&D Program of China (2017YFB0310804), National Natural Science Foundation of China (No. 51621003) and Beijing municipal high level innovative team building program (No. IDHT 20170502).References
- D. Blowes, Science, 2002, 295, 2024–2025 CrossRef CAS PubMed.
- C. Göde, M. L. Yola, A. Yılmaz, N. Atar and S. Wang, J. Colloid Interface Sci., 2017, 508, 525–531 CrossRef PubMed.
- J. Ma, J. Luo, Y. Liu, Y. Wei, T. Cai, X. Yu, H. Liu, C. Liu and J. C. Crittenden, J. Mater. Chem. A, 2018, 6, 20110–20120 RSC.
- S. Rezania, S. M. Taib, M. F. Md Din, F. A. Dahalan and H. Kamyab, J. Hazard. Mater., 2016, 318, 587–599 CrossRef CAS PubMed.
- N. S. Kovalevskiy, M. N. Lyulyukin, D. S. Selishchev and D. V. Kozlov, J. Hazard. Mater., 2018, 358, 302–309 CrossRef CAS PubMed.
- X. Hu, L. Deng, H. Ouyang and H. Wang, RSC Adv., 2018, 8, 28032–28040 RSC.
- B. Wang, F. C. de Godoi, Z. Sun, Q. Zeng, S. Zheng and R. L. Frost, J. Colloid Interface Sci., 2015, 438, 204–211 CrossRef CAS PubMed.
- X. Liu, X. Xu, J. Sun, A. Alsaedi, T. Hayat, J. Li and X. Wang, Chem. Eng. J., 2018, 343, 217–224 CrossRef CAS.
- J. F. Mukerabigwi, S. Lei, L. Fan, H. Wang, S. Luo, X. Ma, J. Qin, X. Huang and Y. Cao, RSC Adv., 2016, 6, 31607–31618 RSC.
- J. Li, J. Xu, Z. Xie, X. Gao, J. Zhou, Y. Xiong, C. Chen, J. Zhang and Z. Liu, Adv. Mater., 2018, 30, 1800548 CrossRef PubMed.
- N. Ezzatahmadi, T. Bao, H. Liu, G. J. Millar, G. A. Ayoko, J. Zhu, R. Zhu, X. Liang, H. Hee and Y. Xi, RSC Adv., 2018, 8, 7687–7696 RSC.
- J. Wu, J. Wang, H. Li, Y. Li, Y. Du, Y. Yang and X. Jia, Appl. Surf. Sci., 2017, 403, 314–325 CrossRef CAS.
- Y. Jin, D. Jiang, D. Li and M. Chen, Catal. Sci. Technol., 2017, 7, 2308–2317 RSC.
- F. Huang, Q. Zhou, L. Li, X. Huang, D. Xu, F. Li and T. Cui, J. Phys. Chem. C, 2014, 118, 19280–19286 CrossRef CAS.
- A. Orera, F. Garcia-Alvarado and J. T. S. Irvine, Chem. Mater., 2007, 19, 2310–2315 CrossRef CAS.
- L. P. Cruz, J.-M. Savariault, J. Rocha, J.-C. Jumas and J. D. Pedrosa de Jesus, J. Solid State Chem., 2001, 156, 349–354 CrossRef CAS.
- J. Wu, J. Wang, H. Li, Y. Du, X. Jia and B. Liu, CrystEngComm, 2014, 16, 9675–9684 RSC.
- L. Wan, H. Song, J. Ma, Y. Ren, X. Cheng, J. Su, Q. Yue and Y. Deng, ACS Appl. Mater. Interfaces, 2018, 10, 13028–13039 CrossRef CAS PubMed.
- G. Kresse and J. Furthmüller, J. Phys.: Condens. Matter, 1996, 54, 11169–11186 CAS.
- J. Chou, C. Hsing, C. Wei, C. Chen and C. Chang, J. Phys.: Condens. Matter, 2013, 25, 125305 CrossRef CAS PubMed.
- J. Chou, C. Hsing, J. Chen, J. Lee and C. Wei, Surf. Sci., 2013, 616, 137–142 CrossRef CAS.
- E. J. G. Santos, A. Ayuela and D. Sánchez-Portal, J. Phys. Chem. C, 2012, 116, 1174–1178 CrossRef CAS.
- D. K. Mishra, S. K. Samad, A. K. Varma and V. A. Mendle, J. Nat. Gas Sci. Eng., 2018, 52, 25–43 CrossRef CAS.
- F. Tang, D. Su, Y. Tang and G. Fang, Sol. Energy Mater. Sol. Cells, 2015, 141, 218–224 CrossRef CAS.
- S. Ida, A. K. Thapa, Y. Hidaka, Y. Okamoto, M. Matsuka, H. Hagiwara and T. Ishihara, J. Power Sources, 2012, 203, 159–164 CrossRef CAS.
- Y. Tong and Y. Wang, Mater. Charact., 2009, 60, 1382–1386 CrossRef CAS.
- A. Bhattacharjee and M. Ahmaruzzaman, Mater. Lett., 2015, 157, 260–264 CrossRef CAS.
- C. Nethravathi and M. Rajamathi, Carbon, 2008, 46, 1994–1998 CrossRef CAS.
- B. Wang, F. C. de Godoi, Z. Sun, Z. Sun, Q. Zeng, S. Zheng and R. L. Forst, J. Colloid Interface Sci., 2015, 438, 204–211 CrossRef CAS PubMed.
- Y. Xu, L. Zhang, M. Yin, D. Xie, J. Chen, J. Yin, Y. Fu, P. Zhao, H. Zhong, Y. Zhao and X. Wang, Appl. Surf. Sci., 2018, 440, 170–176 CrossRef CAS.
- M. Fukushima, E. Yasuda, Y. Nakamura, M. Shimizu, Y. Teranishi and L. M. Manocha, J. Sol-Gel Sci. Technol., 2005, 34, 15–21 CrossRef CAS.
- G. Lakshminarayana, S. O. Baki, A. Lira, M. I. Sayyed, I. V. Kityk, M. K. Halimah and M. A. Mahdi, J. Mater. Sci., 2017, 52, 7394–7414 CrossRef CAS.
- Q. Li, T. Kako and J. Ye, Int. J. Hydrogen Energy, 2011, 36, 4716–4723 CrossRef CAS.
- T. Qian, J. Li and Y. Deng, Sci. Rep., 2016, 6, 32392 CrossRef CAS PubMed.
- D. S. Conceição, C. A. L. Graça, D. P. Ferreira, A. M. Ferraria, I. M. Fonseca, A. M. Botelho do Rego, A. C. S. C. Teixeira and L. F. Vieira Ferreir, Microporous Mesoporous Mater., 2017, 253, 203–214 CrossRef.
- D. Zhang, Z. Qin, X. Yang, H. Zhu and M. Cao, J. Sol-Gel Sci. Technol., 2011, 57, 31–35 CrossRef CAS.
- R. M. Tripathi, R. Pragadeeshwara Rao and T. Tsuzuki, RSC Adv., 2018, 8, 36345–36352 RSC.
- T. Peng, C. Hu, X. Hu, X. Zhou and J. Qu, Catal. Lett., 2012, 142, 646–654 CrossRef CAS.
- L. L. Dunn, Y. S. Rahmanto and D. R. Richardson, Trends Cell Biol., 2007, 17, 93–100 CrossRef CAS PubMed.
- S. J. Dixon and B. R. Stockwell, Nat. Chem. Biol., 2014, 10, 9–17 CrossRef CAS PubMed.
- F. Huang, Q. Zhou, L. Li, X. Huang, D. Xu, F. Li and T. Cui, J. Phys. Chem. C, 2014, 118, 19280–19286 CrossRef CAS.
- J. Li, J. Xu, W. Dai, H. Li and K. Fan, Appl. Catal., B, 2009, 85, 162–170 CrossRef CAS.
- A. Stefansson, Environ. Sci. Technol., 2007, 41, 6117–6123 CrossRef CAS PubMed.
- H. Zhang, A. Wu, H. Fu, L. Zhang, H. Liu, S. Zheng, H. Wan and Z. Xu, RSC Adv., 2017, 7, 41228–41240 RSC.
- L. Kong, Z. Li, X. Huang, X. Huang, S. Huang, H. Sun, M. Liu and L. Li, J. Mater. Chem. A, 2017, 5, 19333–19342 RSC.
- L. Zhang, X. Lin, J. Wang, F. Jiang, L. Wei, G. Chen and X. Hao, Sci. Rep., 2016, 6, 30455 CrossRef CAS PubMed.
- S. He, Y. Li, L. Weng, J. Wang, J. He, Y. Liu, K. Zhang, Q. Wu, Y. Zhang and Z. Zhang, Sci. Total Environ., 2018, 637–638, 69–78 CrossRef CAS PubMed.
- C. Park, Y. Son and M. Won, Microchem. J., 2005, 80, 201–206 CrossRef CAS.
Footnote |
| † Electronic supplementary information (ESI) available. See DOI: 10.1039/c8ra10186h |
| This journal is © The Royal Society of Chemistry 2019 |

