 Open Access Article
Hollow ZnO microspheres functionalized with electrochemical graphene oxide for the photodegradation of salicylic acid†
Marcos Rodríguez Hernándeza,
Arxel de León Santillán *bc,
Edgar de Casas Ortiza,
Salvador Fernández Tavizóna,
Ivana Moggio
 a,
Eduardo Ariasa,
Carlos Alberto Gallardo-Vegaa,
Jesús Alfonso Mercado Silvaa and
Enrique Díaz Barriga-Castro
 a
a
aCentro de Investigación en Química Aplicada, Boulevard Enrique Reyna 140, 25294 Saltillo, Coahuila, Mexico
bCONACYT-Centro de Investigación en Química Aplicada, Boulevard Enrique Reyna 140, 25294 Saltillo, Coahuila, Mexico. E-mail: arxel.deleon@ciqa.edu.mx
cResearch Group of Optical Properties of Materials (GPOM), Centro de Investigaciones en Óptica, A.P. 1-948, 37150 León, Gto., Mexico
First published on 28th February 2019
Abstract
Hollow ZnO microspheres were successfully synthesized by a hydrothermal method and then functionalized with graphene oxide (GO) flakes, previously obtained through electrochemical oxidation. Their photocatalytic activity toward the photodegradation of salicylic acid under UV light irradiation was evaluated by UV-Vis spectroscopy. Unfunctionalized microspheres and ZnO functionalized with chemically oxidized graphene were also studied as comparative terms. The hybrid materials of ZnO with both electrochemical and chemical GO gave a similar photodegradation yield of ∼28% against 18% of the non-functionalized microspheres. The similar degradation yields and rate constants obtained with the two GO synthetic methods indicate that electrochemical oxidation of GO represents an eco-friendly option over traditional methods for photocatalytic degradation systems.
Introduction
One of the principal pollutants that comes from pharmaceutical, food and cosmetic industries is salicylic acid (SA). Despite the fact that several decomposition methods have been proposed, the photodegradation of this contaminant is an easy and ecological method for industrial wastewater treatment.1Photodegradation of compounds requires, in general, the excitation of a semiconductor, such as tin or zinc oxide. ZnO has a low production cost, high photosensitivity, and nontoxicity. Its photocatalytic activity has been studied for different morphologies: nanorods, nanodiscs, and hollow microspheres.2,3 These latter have low density and high surface/volume ratio that allow higher efficiency in charge recollection and charge transport with respect to bulk ZnO.4,5 Nevertheless, as the band gap of this metal oxide is quite large (3.37 eV), further improvement in the photocatalytic activity has been reported by making composites with carbon-based materials.6 In particular, graphene oxide (GO) presents different functional groups such as carboxylic acid, hydroxyl, and epoxide groups on its two-dimensional surface that allows functionalization with metal oxides.7–10 Additionally to improve the band gap increasing the exciton generation, GO effectively transports the charges to the surface of ZnO nanostructures.10 GO is usually obtained through chemical methods such as Brodie, Staudenmaier, Hummers, and Marcano,11–14 which require the use of toxic and hazards materials and involve difficult procedures for their purification. Conversely, the electrochemical method is more straightforward, eco-friendly and economical.15–17
In this paper, we report on the synthesis of hollow microspheres of zinc oxide and his surface modification with graphene oxide flakes obtained electrochemically, as well as their photocatalytic activity towards the degradation of salicylic acid. ZnO microspheres without GO and with GO obtained by a chemical method (through a modification of Marcano procedure) were also studied as comparative terms. It is to be pointed out that, during the preparation of this manuscript, a work on GO–ZnO microspheres was published. Nevertheless, the syntheses of both, the graphene oxide and the functionalized ZnO hybrid are different and in that work, the photocatalytic activity was investigated in the degradation of methylene blue.18
The results here reported demonstrate that electrochemical oxidation of graphene can be an eco-friendly option over traditional methods to obtain ZnO microsphere hybrids with enhanced photocatalytic activity.
Experimental details
Materials
Ethylene glycol, hydrogen peroxide at 30%, sulfuric, phosphoric, and hydrochloric acid were purchased by Fermont, zinc acetate dihydrate, salicylic acid, and graphite bar were acquired from Aldrich Chemical Company, graphite powder 3160 was supplied by Asbury Carbons graphite. Anhydrous dextrose and potassium permanganate were obtained from Analytyka.Electrochemical synthesis of graphene oxide
The electrochemical oxidation was carried out in an air power supply at 15 V and 1.5 amp (22.5 W) in a VersaSTAT3 Potentiostat-Galvanostat from Ametek Scientific Instruments. The working electrode was a graphite bar and platinum wire as the second electrode. Measurements were performed at room temperature, using ammonium carbonate solution 0.25 M as the supporting electrolyte was at reaction times of 7 hours. The product was washed three times with both, deionized water and industrial grade ethanol. In the following, the product of this reaction will be referred to as GO–(NH4)2CO3.Chemical synthesis of graphene oxide
Chemical oxidation of graphite was carried out according to Marcano et al.11 Briefly, 640 mL of sulfuric acid, 90 mL of phosphoric acid and 6 g of Asbury 3160 graphite were put in a one neck flask provided with mechanical stirring. The reactive mixture was cooled to 0 °C. Then, 36 g of KMnO4 were added, and the temperature increased to 60 °C. The reaction was left for 4 hours. Finally, a solution of 20 mL of hydrogen peroxide (30%) in 200 mL of deionized water was added. The mixture was centrifuged and washed with 200 mL of HCl, 200 mL of ethanol and subsequently with deionized water until pH 7. In the following, the product of this reaction will be referred as GO.Synthesis of hollow ZnO microspheres
Hollow ZnO microspheres were synthesized by a modified methodology of Seyed et al.19 Carbon microspheres (CM) were first synthesized as following: 15 g of anhydrous dextrose dissolved in a mixture of 15 mL of ethylene glycol and 35 mL of deionized water were put into a Teflon-lined stainless steel autoclave and left to react during 4 hours at 180 °C. The product was then washed three times with deionized water and dried at 80 °C for 18 hours. After this time, 1 g of carbon microspheres, 2.2 g of zinc dehydrate acetate and 60 mL of deionized water were added to the autoclave. The solution was heated for 90 min at 120 °C. The product was then rinsed with deionized water, ethanol and finally pyrolyzed at a heating ramp of 1 °C min−1 from 0 to 500 °C; maintained at this temperature for 4 hours. In the following, the product of this reaction will be referred to as ZnO.Preparation of graphene oxide supported on ZnO hollow microspheres
In a vessel, 30 mg of the previously synthesized graphene oxide was dissolved in a mixture of 70 mL of isopropanol and 50 mL of deionized water and sonicated for 2 hours. In another vessel, 90 mg of ZnO hollow microspheres were suspended in 40 mL of deionized water, and then this solution was transferred to the vessel containing the GO. The mixture was kept under magnetic stirring for one hour. Finally, the material was filtered off with PTFE membranes. The product of electrochemical (chemical) GO with ZnO will be referred to as GO–(NH4)2CO3/ZnO (GO/ZnO).Characterization
Raman spectra were recorded on a micro Raman Xplora by Horiba Scientific, by exciting at 532 nm with a nanoLED of 25 mW (attenuation filter of 10%). ATR Fourier transformed infrared (FTIR) analysis was carried out in Nicolet iS5 Thermo scientific iD7ATR, in the range from 4000–600 cm−1, 16 resolutions, 64 scans, using germanium as reference standard material. SEM characterization was realized with a JEOL JSM-7041F. The samples were gold–palladium sputter coated. The GO morphology was determined by transmission electron microscopy (TEM) with FEI Titan microscope at 300 kV, by casting few drops of a dispersion of GO in water (0.1 mg mL−1) on a Lacey Carbon grid. Thermogravimetric analysis (TGA) was carried out using TA Instruments TGA Q500, at a heating rate 10 °C min−1 from 25 to 600 °C in nitrogen, and from 600 °C to 800 °C in oxygen. The X-ray diffraction (XRD) study of the powder materials was performed on an Eco D8 Advance of Bruker. The data were recorded in the range of 3–90° 2θ, at a rate 0.01° min−1, 40 kV voltage and 25 mA of emission current. XPS analysis was realized on a PHI VersaProbe II instrument of Physical Electronics, during the acquisitions the analysis chamber was a 2 × 10⁻⁸ mTorr. A monochromatic X-ray source with an aluminium anode and radiation energy of 1486.6 eV was used. Survey spectra were obtained with an energy step of 117.4 eV, between 1400–0 (eV) of energy binding. High resolution scans of C 1s, O 1s and Zn 2p3/2 were obtained with 11.75 eV step. Gaussian deconvolution process was made with restrains only on FWHM; maximums and area being free.Photocatalytic activity
Photocatalytic reactions were carried out in a home-made photoreactor under UV light of 20 W positioned horizontally above the liquid surface. Briefly, 10 ppm of salicylic acid and 60 ppm of the previously synthesized material (ZnO; GO/ZnO; GO–(NH4)2CO3/ZnO), were collocated in a precipitate baker of 250 mL containing a magnetic stirrer and a peristaltic pump into the reactor. The photodegradation was monitored every 30 min during 4 hours by UV-Vis spectroscopy with a Cintra 2020 GBC spectrophotometer, following the change in the absorbance at the maximum wavelength peak of the salicylic acid (295 nm), using deionized water as the reference.Results and discussion
Electrochemical synthesis of graphene oxide
The electrochemical oxidation of graphite is evidenced after 15 min of reaction by the appearance of bubbles in the graphite surface electrode and by a colour change from transparent to the dark brown of the suspension. The graphite expands gradually, while the surface becomes rough and easily dilated. During the oxidation process, the presence of bubbles into the graphite layer's allows surpassing the van der Waals forces in the adjacent layers and the exfoliation of graphene layer occurs.The oxidation of graphite, achieved by both electrochemical and chemical methods, is confirmed by vibrational spectroscopy, ATR-FTIR (Fig. 1a) and Raman (Fig. 1b). The infrared spectrum of the chemically oxidized graphene (Fig. 1a, solid line) is quite similar to that found in literature,20,21 and presents the typical broad OH stretching band in the region of 3600–3000 cm−1 indicative of hydroxyls and carboxylic groups. The signal at 1730 cm−1 is assigned to the C![[double bond, length as m-dash]](https://www.rsc.org/images/entities/char_e001.gif) O stretching vibration of the carboxylic group, while the band at 1632 cm−1 is due to C
O stretching vibration of the carboxylic group, while the band at 1632 cm−1 is due to C![[double bond, length as m-dash]](https://www.rsc.org/images/entities/char_e001.gif) C mode of the carbonic skeleton of un-oxidized graphite. The peak at 1064 at cm−1 is consistent with the C–O stretching. The band at 907 cm−1 are assigned to the different wagging vibrations of the OH, epoxy, ether, etc. vibrations. A bit different is the spectrum of the electrochemically obtained graphene oxide (Fig. 1a, dashed line). The OH stretching mode becomes broader ranging from 3600 up to 1600 cm−1, likely due to the OH and NH overlapped signals. The C
C mode of the carbonic skeleton of un-oxidized graphite. The peak at 1064 at cm−1 is consistent with the C–O stretching. The band at 907 cm−1 are assigned to the different wagging vibrations of the OH, epoxy, ether, etc. vibrations. A bit different is the spectrum of the electrochemically obtained graphene oxide (Fig. 1a, dashed line). The OH stretching mode becomes broader ranging from 3600 up to 1600 cm−1, likely due to the OH and NH overlapped signals. The C![[double bond, length as m-dash]](https://www.rsc.org/images/entities/char_e001.gif) O stretching vibration downshifts to 1577 cm−1 (and the corresponding C–O stretching to 1054 cm−1). A sharp peak appears at 1391 cm−1 that can be due to OH bending. The C
O stretching vibration downshifts to 1577 cm−1 (and the corresponding C–O stretching to 1054 cm−1). A sharp peak appears at 1391 cm−1 that can be due to OH bending. The C![[double bond, length as m-dash]](https://www.rsc.org/images/entities/char_e001.gif) C graphitic vibration cannot be observed. (ii) Raman spectra of both materials show the typical graphene oxide bands: the G band of the E2g vibration mode of the in-plane bond C
C graphitic vibration cannot be observed. (ii) Raman spectra of both materials show the typical graphene oxide bands: the G band of the E2g vibration mode of the in-plane bond C![[double bond, length as m-dash]](https://www.rsc.org/images/entities/char_e001.gif) C stretching motion of pairs of C sp2 atoms (1591 cm−1) and the D breathing mode band of A1g C sp3 atoms (∼1350 cm−1), which relative intensity ID/IG is 0.98 for the chemical oxidation and 1.23 for electrochemical oxidation, suggesting a larger number of defects in the latter material, consistent with the lack of detection of the C
C stretching motion of pairs of C sp2 atoms (1591 cm−1) and the D breathing mode band of A1g C sp3 atoms (∼1350 cm−1), which relative intensity ID/IG is 0.98 for the chemical oxidation and 1.23 for electrochemical oxidation, suggesting a larger number of defects in the latter material, consistent with the lack of detection of the C![[double bond, length as m-dash]](https://www.rsc.org/images/entities/char_e001.gif) C vibration in the IR spectrum.22
C vibration in the IR spectrum.22
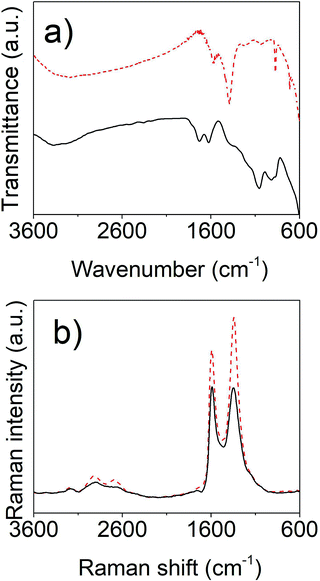 | ||
| Fig. 1 FT-IR (a) and Raman (b) spectra of chemically (solid lines) and electrochemically (dashed lines) oxidized graphite. | ||
The thermogravimetric analysis for the oxides (Fig. 2), shows a similar weight loss of around 10% (7.44% for GO–(NH4)2CO3 and 9.51% for GO) between 25 °C and 70 °C, which is likely associated with desorption of the absorbed water. Between 70 °C and 184 °C, a further weight loss of 11.79% for GO–(NH4)2CO3 and of 29.49% for GO is observed giving a total weight loss of 19.23% and 39.00% for GO–(NH4)2CO3 and GO respectively.
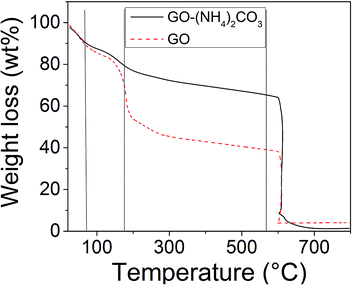 | ||
| Fig. 2 TGA curves of chemically (solid lines) and electrochemically (dashed lines) oxidized graphite. Dotted lines are guides for the eyes. | ||
This latter is often ascribed to pyrolysis of the labile oxygen containing functional groups, yielding CO, CO2, and steam.1,6,23 The fact that a higher weight loss is observed for GO confirms that the chemical method yields to a larger extent of oxidation with respect to the electrochemical one. The final mass loss at 600 °C is attributed to the sublimation or burning of the damaged graphite regions or the decomposition of the carbon squeleton.24–26
Fig. 3 shows the X-ray diffractograms of chemically and electrochemically oxidized graphite. It can be seen, that the diffractogram of the electrochemical product presents a sharp reflection at 2θ = 26.5°, which is at the same position of that of the graphite (as observed in the reference spectrum) and that corresponds to (002) plane of graphite with an interplanar distance of 0.33 nm. A second broadband is observed at 2θ = 11.9° corresponding to an interplanar distance of 0.78 nm and attributed to the oxide functional groups of the graphite basal plane during oxidation reaction, which are the responsibility of the consequent exfoliation as reported in other works,18 however oxidation is not totally achieved. In contrast, the chemically oxidized GO, only one single, sharp and intense diffraction peak appears at 10.6° (d = 0.82 nm) confirming that chemical oxidation gives rise to a complete oxidation and exfoliation of graphite.
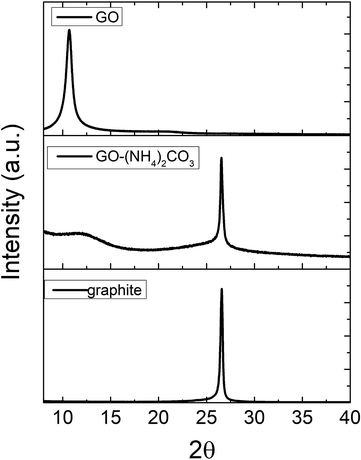 | ||
| Fig. 3 X-ray diffractograms of chemically and electrochemically oxidized graphite. Graphite XRD spectrum is included for sake of comparison. | ||
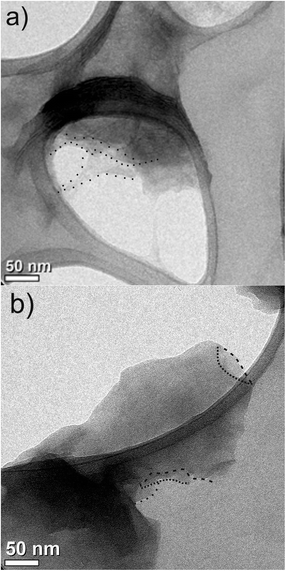
Both samples were also observed by TEM (Fig. 4) where a few exfoliated and typical transparent layers of graphene oxide (indicated as dashed regions) could be observed, but coexisting with other areas with stacked sheets (darkest regions) for both GO–(NH4)2CO3 and the GO obtained by Marcano synthesis. This shows that GO obtained by electrochemistry and the chemical GO are similar.
Synthesis of hollow ZnO microspheres and its functionalization with graphene oxide
Representative SEM images are reported in Fig. 5. Additional images, used for the statistical analyses, are collected in the ESI.† The morphological analysis by SEM of the ZnO–carbon microspheres before calcination (Fig. 5a) shows a smooth surface with an average size for the carbon microspheres of 7.07 ± 2.5 μm. After calcination (Fig. 5b), the size of the microspheres decreases to 2.8 ± 0.9 μm, the shell presents a thickness ranging from 30 to 200 nm, where ZnO nanoparticles up to 70 nm can be observed. The opening of the microspheres is found between 500 and 900 nm.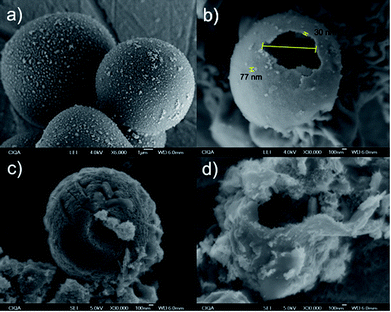 | ||
| Fig. 5 ZnO-carbon microspheres before (a) and after (b) calcination. Hollow microspheres functionalized with GO (c) and GO–(NH4)2CO3, (d). | ||
After functionalization with GO, the hollow microspheres surface is totally covered with graphene oxide, inclusive in the openings. It is worth mentioning that in the GO–(NH4)2CO3–ZnO case, the samples were slightly darker than those of GO–ZnO, this may be due to the presence of graphite.
The X-ray diffraction (Fig. 6) of carbon microspheres shows a broadband typical of an amorphous material with two main maximums at 2θ = 17° and 41° corresponding to (002) and (101) lattice planes of carbon.27 After the calcination of the carbon microspheres, the diffractions at 2θ = 31.8°, 34.5°, 36.1°, 47.5°, 56.4°, 62.9°, 67.9°, and 69.0° correspond to ZnO crystalline planes: (100), (002), (101), (102), (110), (103), (112) and (001) (JCPDS 36-1451, Fig. 6).
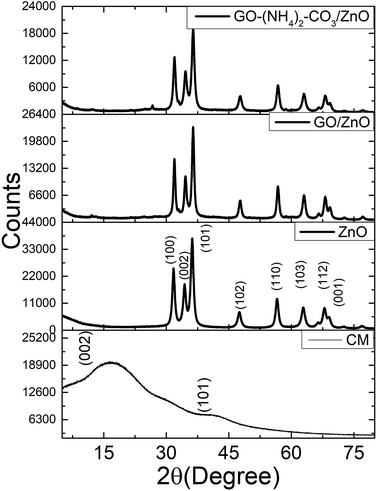 | ||
| Fig. 6 Top: XRD of carbon microspheres (CM), ZnO hollow microspheres and ZnO hollow microspheres functionalized with chemical and electrochemical graphene oxide. | ||
The materials functionalized with GO maintain the same diffraction peaks. Graphene diffractions can be observed only after magnification of the region 2θ = 3–30° (ESI†).
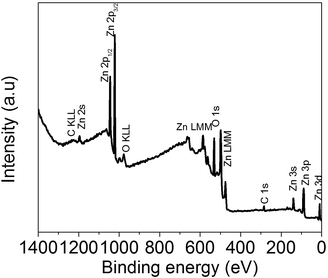
In order to corroborate on the GO functionalization of ZnO hollow microspheres, XPS analysis was performed. Fig. 6 shows the survey spectrum for ZnO, while those of GO/ZnO and GO–(NH4)2CO3/ZnO are shown in the ESI.†
The survey confirms the presence of adventitious carbon contamination (C 1s), O and Zn signals correspond to ZnO hollow microspheres (Fig. 7). The same signals were observed after GO functionalization, evidently with many different relative intensities. Quantification of each peak gives rise to the elemental analysis reported in Table 1.
| Sample | C 1s (atm%) | O 1s (atm%) | Zn 2p (atm%) |
|---|---|---|---|
| ZnO | 14.2 | 50.3 | 35.4 |
| GO/ZnO | 26.1 | 48.3 | 25.6 |
| GO–(NH4)2CO3/ZnO | 39.6 | 37.9 | 22.4 |
The results obtained after the deconvolution process performed on the high resolution XPS spectra of the Zn 2p3/2, C 1s and O 1s signals, corresponding to the three samples, are shown in Fig. 8.
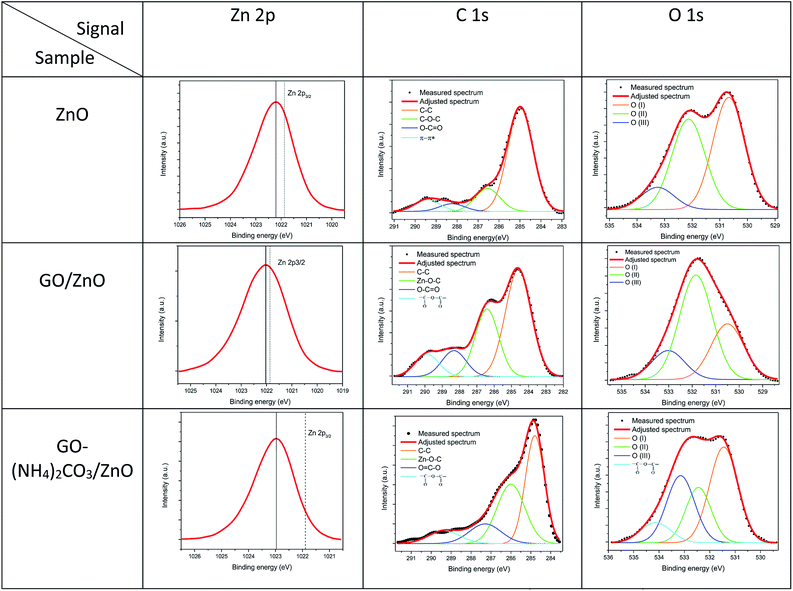 | ||
| Fig. 8 HR XPS analyses of the Zn 2p, C 1s and O 1s signals, corresponding to the ZnO (hollow microspheres), GO/ZnO and GO–(NH4)2CO3/ZnO samples. | ||
The shift of binding energy in the signal Zn 2p from 0.3 to 1.2 eV, in the samples demonstrates that the modification of ZnO hollow was successfully achieved by this route. The analysis of C 1s confirms that the carbon present in the hollow ZnO sample was a residual carbon contamination, contrary to the C 1s, presented in the modified samples, for which the Zn–O–C bond could be identified, confirming the interaction and modification of the hollow spheres by the GO.
With respect to the O 1s signal, the analysis indicates that the component O(I) can be attributed to the Zn–O bonds, secondly the O(II) is associated with O2− ions that are in oxygen-deficient regions within the ZnO. As a result, changes in the intensity of this component may be in connection with the variations in the concentration of the oxygen vacancies, and the higher binding energy O(III), is usually attributed to chemisorbed or dissociated oxygen or OH species on the surface of the ZnO.28
The adsorption of GO on the hollow microspheres was also followed by UV-Vis spectroscopy, Fig. 9. The ZnO hollow microspheres exhibit a peak at 275 nm due to the plasmon resonance of Zn nanoparticles and a shoulder at around 370 nm attributed to the absorption of nanoparticles of ZnO. These two absorptions persist in the functionalized microspheres as reported by other authors.29 Additionally, both GO/ZnO and GO–(NH4)2CO3/ZnO present an absorption band at 240 nm attributed to the π–π* transition of C![[double bond, length as m-dash]](https://www.rsc.org/images/entities/char_e001.gif) C of graphene oxide.30,31
C of graphene oxide.30,31
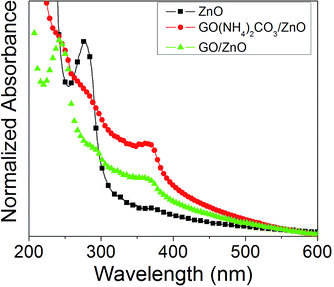 | ||
| Fig. 9 UV-Vis absorption spectra of ZnO hollow microspheres (black square-line), GO–(NH4)2CO3–ZnO (red circle-line) and GO–ZnO (green triangle-line) in water. | ||
This latter peak is, however, more pronounced for the chemical GO, in agreement with the higher oxidation as found previously by vibrational spectroscopy.
Photocatalytic activity
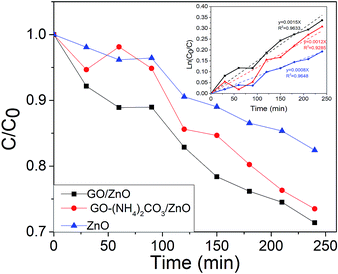
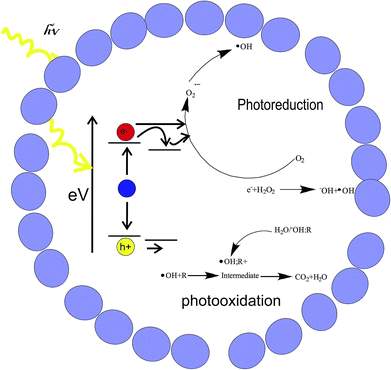
As previously mentioned, the photodegradation of salicylic acid was followed by UV-Vis spectroscopy. Fig. 10 reports the graphic of the concentration of salicylic acid (C) normalized with respect to the initial value (C0) vs. time, in the three different catalytic systems of this work: hollow ZnO microspheres without and with graphene oxide (electrochemically and chemically synthesized). It can be seen, that at 240 min of exposure, the concentration of salicylic acid decreases to 18% of its initial value for pristine ZnO microspheres, whereas the microspheres with graphene oxide give a decrease of up 29 and 27%, for the chemical and electrochemical graphene oxide, respectively. The experimental data were fitted using the pseudo-first order kinetic equation: ln(C0/C) = kt (Fig. 10, inserted).32 The salicylic acid degradation rate constants are 0.0015, 0.0012 and 0.0008 min−1 for GO–ZnO, GO–(NH4)2CO3–ZnO and ZnO respectively. The enhancement of the degradation constant observed for both graphene oxides can be explained on the basis of the photodegradation mechanism, Fig. 11. Under UV light but without catalyst or in presence of catalyst but without UV light, no reaction occurs, as the UV excitation is necessary for generating excitons in the semiconductor. Due to the electron donor character of salicylic acid and the electron acceptor nature of ZnO, excitons are dissociated in the free charges: electrons (e−) and holes (h+). As reported for other organic compounds in water,33 it is considered that in the valence band, holes generate OH radicals.Conduction band electrons reduce dissolved oxygen forming hydrogen peroxide. Graphene oxide participates as an intermediary electron attractor to achieve the charges from ZnO through photoinduced electron transfer. Moreover, it is a semiconducting material, thus favouring the charge transport and reducing the possible e−/h+ recombination. It is to be mention that a similar enhancement in the photocatalytic activity was found for graphene–ZnO hybrids. However, in that work ZnO particles were nanosized and graphene, not graphene oxide was used in order to obtain higher electrical conductivity with respect to pure ZnO.34 In this context, the almost equivalent behaviour of chemical and electrochemical graphene–ZnO samples indicates that the GO–(NH4)2CO3 exhibit a very good photocatalytic behaviour, despite the lower oxidation of graphite. Moreover, as it is obtained in a simpler, less toxic method represents an eco-friendly alternative to classical chemical graphite oxide.
Conclusion
IR, Raman, and XRD spectroscopies reveal that electrochemical oxidation of graphite gives a partial oxidation with respect to classical chemical oxidation method. Nevertheless, its functionalization with hollow ZnO microspheres gives a composite material with similar photodegradation rate constants for salicylic acid as the corresponding with graphite oxide obtained with acids method, and even more effective compared with not functionalized ZnO microspheres. These results demonstrate that hollow ZnO microspheres functionalized with electrochemical graphite oxide represent an eco-friendly photocatalytic system for water treatment.Conflicts of interest
There are no conflicts to declare.Acknowledgements
The support of the CONACYT through Grant LNMG 293371 and LANIAUTO 294030 is greatly appreciated. Arxel de León thanks CONACyT-SENER (Mexico) for the postdoctoral fellowship.Notes and references
- N. K. Stamatis and I. K. Konstantinou, Occurrence and removal of emerging pharmaceutical, personal care compounds and caffeine tracer in municipal sewage treatment plant in Western Greece, J. Environ. Sci. Health, Part B, 2013, 48(9), 800–813 CrossRef CAS PubMed.
- C. Yu, K. Yang, Y. Xie, Q. Fan, C. Y. Jimmy, Q. Shu and C. Wang, Novel hollow Pt-ZnO nanocomposite microspheres with hierarchical structure and enhanced photocatalytic activity and stability, Nanoscale, 2013, 5(5), 2142–2151 RSC.
- C. Yu, F. Cao, X. Li, G. Li, Y. Xie, C. Y. Jimmy, Q. Shu, Q. Fan and J. Chen, Hydrothermal synthesis and characterization of novel PbWO4 microspheres with hierarchical nanostructures and enhanced photocatalytic performance in dye degradation, Chem. Eng. J., 2013, 219, 86–95 CrossRef CAS.
- P. Cui, J. Wang, Z. Wang, J. Chen, X. Xing, L. Wang and R. Yu, Bismuth oxychloride hollow microspheres with high visible light photocatalytic activity, Nano Res., 2016, 9(3), 593–601 CrossRef CAS.
- J. Yu and G. Wang, Hydrothermal synthesis and photocatalytic activity of mesoporous titania hollow microspheres, J. Phys. Chem. Solids, 2008, 69(5–6), 1147–1151 CrossRef CAS.
- K. Qi, H. Qi, Y. Xie and Y. Wang, Enhanced Photocatalytic Performance of ZnO through Coupling with Carbon Materials, General Chemistry, 2017, 3(1), 113–117 CrossRef.
- A. Jana, E. Scheer and S. Polarz, Synthesis of graphene–transition metal oxide hybrid nanoparticles and their application in various fields, Beilstein J. Nanotechnol., 2017, 8(1), 688–714 CrossRef CAS PubMed.
- W. Zhang, F. Liu, Q. Li, Q. Shou, J. Cheng, L. Zhang, B. J. Nelson and X. Zhang, Transition metal oxide and graphene nanocomposites for high-performance electrochemical capacitors, Phys. Chem. Chem. Phys., 2012, 14(47), 16331–16337 RSC.
- H. H. Mohamed, Sonochemical synthesis of ZnO hollow microstructure/reduced graphene oxide for enhanced sunlight photocatalytic degradation of organic pollutants, J. Photochem. Photobiol., A, 2018, 353, 401–408 CrossRef CAS.
- D. Zhang, Y. Zhao and L. Chen, Fabrication and characterization of amino-grafted graphene oxide modified ZnO with high photocatalytic activity, Appl. Surf. Sci., 2018, 458, 638–647 CrossRef CAS.
- D. C. Marcano, D. V. Kosynkin, J. M. Berlin, A. Sinitskii, Z. Sun, A. Slesarev, L. B. Alemany, W. Lu and J. M. Tour, Improved synthesis of graphene oxide, ACS Nano, 2010, 4(8), 4806–4814 CrossRef CAS PubMed.
- W. S. Hummers Jr and R. E. Offeman, Preparation of graphitic oxide, J. Am. Chem. Soc., 1958, 80(6), 1339 CrossRef.
- B. C. Brodie II, On the atomic weight of graphite, Proc. R. Soc. London, 1860, 10, 11–12 CrossRef.
- L. Staudenmaier, Verfahren zur darstellung der graphitsäure, Ber. Dtsch. Chem. Ges., 1898, 31(2), 1481–1487 CrossRef CAS.
- K. Kakaei and K. Hasanpour, Synthesis of graphene oxide nanosheets by electrochemical exfoliation of graphite in cetyltrimethylammonium bromide and its application for oxygen reduction, J. Mater. Chem. A, 2014, 2(37), 15428–15436 RSC.
- X. You, J.-H. Chang, B. K. Ju and J. J. Pak, An electrochemical route to graphene oxide, J. Nanosci. Nanotechnol., 2011, 11(7), 5965–5968 CrossRef CAS PubMed.
- E. Teran-Salgado, D. Bahena-Uribe, P. A. Márquez-Aguilar, J. L. Reyes-Rodriguez, R. Cruz-Silva and O. Solorza-Feria, Platinum nanoparticles supported on electrochemically oxidized and exfoliated graphite for the oxygen reduction reaction, Electrochim. Acta, 2019, 298, 172–185 CrossRef CAS.
- J. Qin, X. Zhang, C. Yang, M. Cao, M. Ma and R. Liu, ZnO microspheres-reduced graphene oxide nanocomposite for photocatalytic degradation of methylene blue dye, Appl. Surf. Sci., 2017, 392, 196–203 CrossRef CAS.
- S. M. Mousavi, A. R. Mahjoub and R. Abazari, Green synthesis of ZnO hollow sphere nanostructures by a facile route at room temperature with efficient photocatalytic dye degradation properties, RSC Adv., 2015, 5(130), 107378–107388 RSC.
- K. S. S. K. Muhamad, F. Mohamed, S. Radiman, A. Hamzah, S. Sarmani, K. K. Siong, M. S. Yasir, I. A. Rahman and N. R. A. M. Rosli, in Synthesis and characterization of exfoliated graphene oxide, AIP Conference Proceedings, AIP Publishing, 2016, p. 040013 Search PubMed.
- S. I. Javed and Z. Hussain, Covalently functionalized graphene oxide–characterization and its electrochemical performance, Int. J. Electrochem. Sci., 2015, 10, 9475–9487 CAS.
- A. A. Dubale, W.-N. Su, A. G. Tamirat, C.-J. Pan, B. A. Aragaw, H.-M. Chen, C.-H. Chen and B.-J. Hwang, The synergetic effect of graphene on Cu2O nanowire arrays as a highly efficient hydrogen evolution photocathode in water splitting, J. Mater. Chem. A, 2014, 2(43), 18383–18397 RSC.
- S. Stankovich, D. A. Dikin, R. D. Piner, K. A. Kohlhaas, A. Kleinhammes, Y. Jia, Y. Wu, S. T. Nguyen and R. S. Ruoff, Synthesis of graphene-based nanosheets via chemical reduction of exfoliated graphite oxide, Carbon, 2007, 45(7), 1558–1565 CrossRef CAS.
- J. P. Rourke, P. A. Pandey, J. J. Moore, M. Bates, I. A. Kinloch, R. J. Young and N. R. Wilson, The real graphene oxide revealed: stripping the oxidative debris from the graphene-like sheets, Angew. Chem., 2011, 123(14), 3231–3235 CrossRef.
- M. Wojtoniszak, B. Zielinska, R. J. Kalenczuk and E. Mijowska, Photocatalytic performance of titania nanospheres deposited on graphene in coumarin oxidation reaction, Mater. Sci.-Pol., 2012, 30(1), 32–38 CrossRef CAS.
- M. Fathy, T. Abdel Moghny, M. A. Mousa, A.-H. A. A. El-Bellihi and A. E. Awadallah, Absorption of calcium ions on oxidized graphene sheets and study its dynamic behavior by kinetic and isothermal models, Appl. Nanosci., 2016, 6(8), 1105–1117 CrossRef CAS.
- G. Krishnamurthy, R. Namitha and S. Agarwal, Synthesis of carbon nanotubes and carbon spheres and study of their hydrogen storage property by electrochemical method, Procedia Mater. Sci., 2014, 5, 1056–1065 CrossRef CAS.
- P.-T. Hsieh, Y.-C. Chen, K.-S. Kao and C.-M. Wang, Luminescence mechanism of ZnO thin film investigated by XPS measurement, Appl. Phys. A: Mater. Sci. Process., 2008, 90(2), 317–321 CrossRef CAS.
- M. H. Huang, S. Mao, H. Feick, H. Yan, Y. Wu, H. Kind, E. Weber, R. Russo and P. Yang, Room-temperature ultraviolet nanowire nanolasers, Science, 2001, 292(5523), 1897–1899 CrossRef CAS PubMed.
- G. Eda, Y. Y. Lin, C. Mattevi, H. Yamaguchi, H. A. Chen, I. S. Chen, C. W. Chen and M. Chhowalla, Blue photoluminescence from chemically derived graphene oxide, Adv. Mater., 2010, 22(4), 505–509 CrossRef CAS PubMed.
- Q. Lai, S. Zhu, X. Luo, M. Zou and S. Huang, Ultraviolet-visible spectroscopy of graphene oxides, AIP Adv., 2012, 2(3), 032146 CrossRef.
- W. Lu, S. Gao and J. Wang, One-pot synthesis of Ag/ZnO self-assembled 3D hollow microspheres with enhanced photocatalytic performance, J. Phys. Chem. C, 2008, 112(43), 16792–16800 CrossRef CAS.
- E. R. Carraway, A. J. Hoffman and M. R. Hoffmann, Photocatalytic oxidation of organic acids on quantum-sized semiconductor colloids, Environ. Sci. Technol., 1994, 28(5), 786–793 CrossRef CAS PubMed.
- T. Xu, L. Zhang, H. Cheng and Y. Zhu, Significantly enhanced photocatalytic performance of ZnO via graphene hybridization and the mechanism study, Appl. Catal., B, 2011, 101(3–4), 382–387 CrossRef CAS.
Footnote |
| † Electronic supplementary information (ESI) available. See DOI: 10.1039/c8ra10113b |
| This journal is © The Royal Society of Chemistry 2019 |

