 Open Access Article
Hybrid multidimensional data acquisition and data processing strategy for comprehensive characterization of known, unknown and isomeric compounds from the compound Dan Zhi Tablet by UPLC-TWIMS-QTOFMS†
Taofang Cheng‡
a,
Ji Ye‡b,
Huiliang Lib,
Hongyuan Dongb,
Ning Xiec,
Nan Mib,
Zhen Zhangb,
Jingtao Zoud,
Huizi Jin *a and
Weidong Zhang*ab
aSchool of Pharmacy, Shanghai Jiao Tong University, Shanghai 200240, China. E-mail: kimhz@sjtu.edu.cn; wdzhangy@hotmail.com; Fax: +86-21-34205989; Tel: +86-21-34205989
bSchool of Pharmacy, Second Military Medical University, Shanghai, 200433, China
cState Key Laboratory of Innovative Natural Medicine and TCM Injections, Jiangxi Qingfeng Pharmaceutical Co., Ltd., Ganzhou 341000, China
dTonghua Huaxia Pharmaceutical Co., Ltd., Tonghua, 134100, China
First published on 15th March 2019
Abstract
The compound Dan Zhi Tablet (DZT), a reputable traditional Chinese medicine prescription, is widely used for the treatment of ischemic stroke in clinic. However, its systematic chemical constituents have rarely been elucidated, which hampers its quality evaluation, the study of bioactive constituents and the mechanism of action interpretation. In this study, we developed a combination of multidimensional data acquisition and data processing strategy with the aim to globally and comprehensively identify the chemical constituents in DZT based on UPLC-TWIMS-QTOFMS. First, multidimensional acquisition modes (MSE, Fast DDA and HDMSE) were performed on UPLC-TWIMS-QTOFMS. Second, targeted characterizations of the known compounds and their analogues present in DZT were carried out on the basis of the corresponding commercial standards or Mass2Motifs. Third, untargeted identification of unknown compounds in DZT was performed by extracting shared Mass2Motifs from the raw fragmentation spectra. Finally, the coeluting isomers were characterized using a precursor and/or product ion mobility. Consequently, 202 compounds were detected from DZT: 29 of them were unambiguously identified by comparison with reference compounds, 29 unknown compounds were discovered in specific medicinal materials, and ten pairs of coeluting isomers, which could not be distinguished using conventional MSE or Fast-DDA, were resolved using HDMSE only. This strategy was successfully used for the rapid and global identification of complex compounds including known, unknown and coeluting isomeric compounds in DZT and provided helpful chemical information for further quality control, pharmacology and active mechanism research on DZT.
Introduction
Compound formulae are the main usage form of traditional Chinese medicine (TCM) and have been used for the treatment of complex diseases in China in clinical practice for thousands of years.1–4 Typically, a TCM formula, which consists of several types of medicinal herbs or animals, can amplify the therapeutic efficacies of each ingredient, leading to enhanced therapeutic efficacy or reduced adverse effects. Considering the chemical diversity and complexity, the development of a rapid and reliable analytical method for the identification of the constituents of TCM formulae is of great significance to enhance quality control in clinical applications.In this regard, ultra-performance liquid chromatography coupled with traveling wave ion mobility quadrupole time-of-flight mass spectrometry (UPLC-TWIMS-QTOFMS)5 is a promising tool well-suited for the high-throughput identification of the constituents from TCM formulae due to its support for multidimensional acquisition modes such as data-independent acquisition (MSE),6–8 fast data-directed analysis (Fast-DDA)8,9 and high-definition MSE (HDMSE).10–14 The MSE mode is applied to increase the coverage of observable chemical compounds; the Fast DDA mode can obtain cleaner precursor-product links and greatly ease data processing for the identification of compounds, especially unknown compounds. Considering that there are some compounds that cannot be absolutely separated and eluted at the same retention time by UPLC, the ion mobility mode (HDMSE) is applied to separate the coeluting compounds, especially coeluting isomers for a second time according to their different charge states, shapes and sizes. However, the identification of the chemical constituents in TCM formulae is still a great challenge due to the presence of unknown compounds. Although many data processing strategies such as a key ion filter,15 mass spectral trees similarity filter,16 diagnostic ion filter,17 and mass defect filter18 can improve the efficiency of identification and decrease the rate of false positives, these strategies were established to analyze the targeted components according to prior knowledge19,20 and they do not reflect the complexity of the chemical constituents in TCM formulae. It is well-known that fragmentation spectra are replete with abundant information pertaining to chemical substructures and have recurring fragment ions and losses. Therefore, Mass2Motifs containing co-occurring MS/MS fragment ions and neutral losses can be extracted and obtained from the raw fragmentation spectra to discover unknown compounds and putatively support de novo structure elucidation.21–23 This method can be used to identify unknown compounds without prior knowledge about the fragments of interest.
The compound Dan Zhi Tablet (DZT) is a reputable traditional Chinese medicine (TCM) formula that consists of Astragalus membranaceus (Fisch.) Bge. var. mongholicus (Bge.) Hsiao (AM), Salvia miltiorrhiza Bge. (SM), Pheretima aspergillum (E. Perrier) (PA), Hirudo nipponica Whitman (HN) and Ligusticum Chuanxiong Hort. (LC) with a ratio of 15![[thin space (1/6-em)]](https://www.rsc.org/images/entities/char_2009.gif) :
:![[thin space (1/6-em)]](https://www.rsc.org/images/entities/char_2009.gif) 12
12![[thin space (1/6-em)]](https://www.rsc.org/images/entities/char_2009.gif) :
:![[thin space (1/6-em)]](https://www.rsc.org/images/entities/char_2009.gif) 10
10![[thin space (1/6-em)]](https://www.rsc.org/images/entities/char_2009.gif) :
:![[thin space (1/6-em)]](https://www.rsc.org/images/entities/char_2009.gif) 3
3![[thin space (1/6-em)]](https://www.rsc.org/images/entities/char_2009.gif) :
:![[thin space (1/6-em)]](https://www.rsc.org/images/entities/char_2009.gif) 6. DZT is capable of tonifying or regulating Qi and activating blood or resolving blood stasis and is widely utilized for the treatment of cerebrovascular diseases such as ischemic stroke. The data from clinical randomized controlled trials have illustrated that the treatment of DZT for stroke recovery is efficient and safe.24 To the best of our knowledge, to date, systematic and global chemical information of DZT remains unknown. In our previous work, four major groups of absorbed prototype constituents (tanshinones, flavonoids, phthalides and furan sulfonic acids) and their metabolites were detected in the plasma and cerebrospinal fluid of rats after the oral administration of DZT by UPLC-QTOF-MS.25 However, some important active ingredients such as the salvianolic acids26–30 in SM having antiplatelet activity and astragalosides31 in AM showing neuroprotection and other unknown constituents as well as coeluting isomers are still unclear, which seriously hampers the control of quality and the interpretation of the underlying pharmacology and mechanism of DZT.
6. DZT is capable of tonifying or regulating Qi and activating blood or resolving blood stasis and is widely utilized for the treatment of cerebrovascular diseases such as ischemic stroke. The data from clinical randomized controlled trials have illustrated that the treatment of DZT for stroke recovery is efficient and safe.24 To the best of our knowledge, to date, systematic and global chemical information of DZT remains unknown. In our previous work, four major groups of absorbed prototype constituents (tanshinones, flavonoids, phthalides and furan sulfonic acids) and their metabolites were detected in the plasma and cerebrospinal fluid of rats after the oral administration of DZT by UPLC-QTOF-MS.25 However, some important active ingredients such as the salvianolic acids26–30 in SM having antiplatelet activity and astragalosides31 in AM showing neuroprotection and other unknown constituents as well as coeluting isomers are still unclear, which seriously hampers the control of quality and the interpretation of the underlying pharmacology and mechanism of DZT.
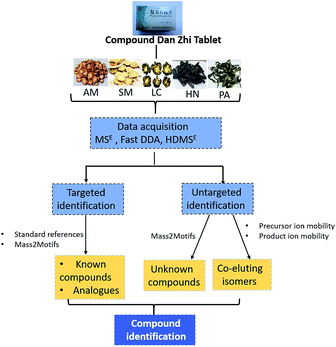
In the present work, a combination of multidimensional data acquisition and data processing strategy was proposed to comprehensively characterize the multi-components including the known compounds, unknown compounds and coeluting isomers of DZT using UPLC-TWIMS-QTOFMS (Fig. 1). First, data acquisition was conducted using multidimensional modes including MSE, Fast DDA and HDMSE. Second, targeted identification of known compounds and their unknown analogues in DZT was performed based on standard references or Mass2Motifs. Third, untargeted discovery and characterization of unknown components in DZT were performed according to Mass2Motifs. Finally, the coeluting isomers in DZT were distinguished using a precursor and/or product ion mobility. With the established method, a total of 202 compounds were detected from DZT, and twenty-nine unknown compounds of them were discovered in specific medicinal materials. Moreover, ten pairs of coeluting isomers, which could not be distinguished using conventional MSE or Fast-DDA, were resolved using HDMSE only. This is the first research on the chemical analysis of DZT, which will be beneficial to its quality control and is essential to deeply understand the mechanism of DZT for the treatment of ischemic stroke.
Experimental
Materials and reagents
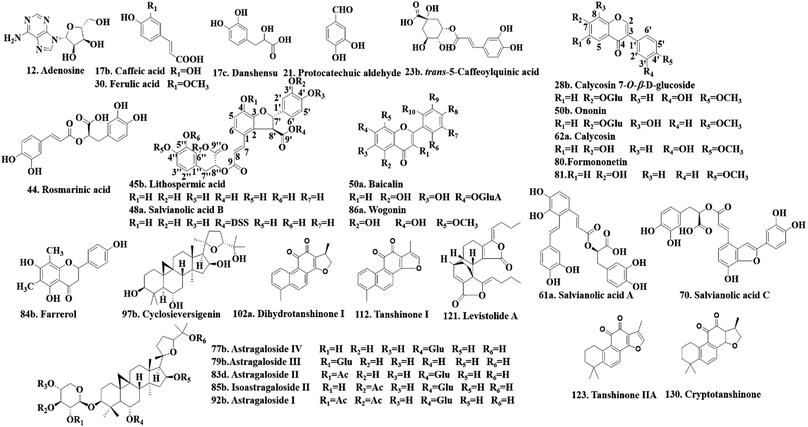
Twenty-four authentic standards of adenosine (12), caffeic acid (17b), danshensu (17c), protocatechuic aldehyde (21), trans-5-caffeoylquinic acid (23b), ferulic acid (30), lithospermic acid (45b), salvianolic acid B (48a), baicalin (50a), ononin (50b), salvianolic acid A (61a), salvianolic acid C (70), astragaloside IV (77b), astragaloside III (79b), astragaloside II (83d), farrerol (84b), isoastragaloside II (85b), wogonin (86a), astragaloside I (92b), cyclosieversigenin (97b), dihydrotanshinone I (102a), tanshinone I (112), levistolide A (121) and tanshinone IIA (123) were all purchased from the National Institute for the Control of Pharmaceutical and Biological Products (Beijing, China). Five reference standards of calycosin7-O-β-D-glucoside (28b), rosmarinic acid (44), calycosin (62a), formononetin (80) and cryptotanshinone (130) were obtained from Shanghai Yuanye Bio-Technology Co., Ltd. (Shanghai, China). The structures of these reference standards (purity > 98%) are shown in Fig. 2. They were stored at 4 °C before use.Acetonitrile, formic acid and water of LC-MS grade were purchased from Fisher Scientific Company (USA). Methanol of analytical grade was obtained from Runjie Tech Co. (Shanghai, China).
DZT and its five ingredients, i.e., LC, SM, PA, AM, and HN were provided by Tonghua Baishan Pharmaceutical Co., Ltd. (Jilin, China).
Standard solution preparation
The abovementioned twenty-nine reference compounds were prepared by dissolving each authentic compound in methanol at a concentration of 1 mg mL−1. A certain amount of the aforementioned reference compound stock solution was mixed and diluted with methanol to obtain the reference compound mixture solution (about 30 μg mL−1 for each compound). This solution was centrifuged at 13![[thin space (1/6-em)]](https://www.rsc.org/images/entities/char_2009.gif) 000 rpm for 10 min and stored at 4 °C before UPLC-QTOFMS analysis.
000 rpm for 10 min and stored at 4 °C before UPLC-QTOFMS analysis.
DZT sample preparation
DZT powder (3 g) was extracted with methanol three times (3 × 30 mL, 1 hour each) using ultrasonic extraction. The extracted solutions were merged and diluted 10-fold with methanol. Then, a certain amount of the diluted solution was centrifuged at 13![[thin space (1/6-em)]](https://www.rsc.org/images/entities/char_2009.gif) 000 rpm for 10 min to obtain the sample solutions.
000 rpm for 10 min to obtain the sample solutions.
Multidimensional data acquisition
The analysis of the DZT samples was conducted on a Waters Acquity UPLC system (Waters, Milford, MA, USA) consisting of a binary pump and an autosampler. UPLC separation was performed on an Agilent ZORBAX Eclipse Plus C18 column (2.1 mm ID × 150 mm, 1.8 μm, Agilent Technologies, Santa Clara, California, USA). The mobile phase contained 0.1% formic acid (vol/vol) in water (A) and acetonitrile (B). A gradient elution program was set as follows: 0.0–2.0 min, 1% B; 2.0–4.0 min, 1–8% B; 4.0–10.0 min, 8–28% B; 10.0–12.0 min, 28–30% B; 12.0–13.0 min, 30–36% B, and 13.0–24.0 min, 36–95% B. The elution rate was set at 0.4 mL min−1. The column and autosampler temperatures were maintained at 35 °C and 10 °C, respectively.Mass detection was performed on SYNAPT G2-Si HDMS (Waters Corp., Manchester, UK) equipped with an ESI interface. MS data acquisition was separately performed in positive and negative ion modes. The MSE parameters were set as follows: capillary voltage, 2.5 kV in positive mode and 2.0 kV in negative mode; cone voltage, 40 eV; source offset voltage, 80 eV; source temperature, 100 °C; desolvation temperature, 400 °C; cone gas flow rate, 50 L h−1; desolvation gas flow rate, 800 L h−1; collision energy, 6 eV for low energy function and 6–90 eV ramp for high energy function; mass range, 50–1500 Da; and scan time, 0.2 s. Data were calibrated using an external reference (LockSprayTM) by the constant infusion of a leucine-enkephalin solution (m/z 556.2771 in positive ion mode) at a flow rate of 5 μL min−1. The Fast DDA parameters were set as follows: dual-dynamic collision energies, 10–40 V for low-mass collision energy and 40–90 V for high-mass collision energy; automatic switching to the MS/MS mode when the intensity of TIC rose above 3000 intensity per s and automatic switching off when 0.6 s elapsed; deisotope peak detection mode, ± 3.0 Da for the tolerance window and 7.0 Da for the peak extract window. The other parameters for Fast DDA were the same as those for MSE. The MassLynx V4.1 software was used for data acquisition, and UNIFI 1.8 was used for the processing and visualization of the multidimensional mass spectrometry data.
Results and discussion
Fig. 3 displays the representative base peak chromatograms (BPCs) of DZT both in positive and negative ion modes. In the present work, 202 compounds were detected in DZT, of which 29 compounds were positively identified by the analysis of the corresponding reference standards and 173 compounds were putatively identified based on previous literatures and the shared Mass2Motifs extracted from the raw MS/MS spectrum of DZT or ion mobility technology. All the detected Mass2Motifs in DZT are shown in Table 1. Moreover, 29 unknown compounds, namely, two salvianolic acids (peaks 39 and 41), four astragalosides (peaks 67a, 69a, 83c and 84c), two furan sulfonic acids (peaks 62b and 73a), seven carbohydrate derivatives (peaks 10, 11, 13, 14a, 15a, 16 and 46), and fourteen lysoglycerophosphocholines (peaks 97d, 98a, 98b, 103c, 103d, 106b, 108b, 110, 111, 113, 115b, 117, 119 and 127) were detected in DZT. Furthermore, 10 pairs of coeluting isomers were tentatively assigned using a precursor and/or product ion mobility. Their structures and detailed mass spectra information, including peak number, retention times (Rt), formulas, accurate molecular ions, mass measurement errors (within a ±5 ppm window), fragment ions, drift time (dt) values, compound names and original sources, are shown in Fig. S1 and Table S1.†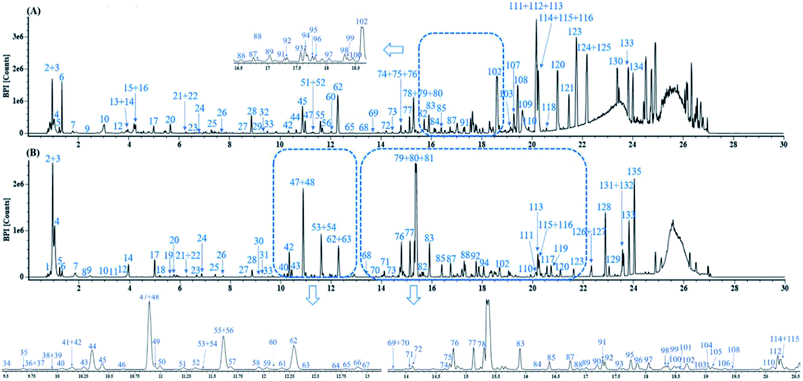 | ||
| Fig. 3 The representative base peak chromatograms (BPCs) of DZT both in positive (A) and negative ion modes (B). | ||
| No. | Mass2Motifs | Characterization | |
|---|---|---|---|
| a a: Mass2Motifs in positive ion mode; Frag: fragment; NL: neutral loss. | |||
| 1 | Frag | 191.0553 (C7H11O6), 173.0450 (C7H9O5) | Fragments related to quinic acid |
| 2 | Frag | 341.1082 (C12H21O11), 281.0878 (C10H17O9), 221.0660 (C8H13O7), 179.0552 (C6H11O6), 161.0445 (C6H9O5), 119.0342 (C4H7O4) | Fragments related to disaccharide |
| 3 | Frag | 545.1732 (C20H33O17), 383.1190 (C14H23O12), 221.0660 (C8H13O7), 179.0552 (C6H11O6), 161.0445 (C6H9O5), 119.0342 (C4H7O4) | Fragments related to polysaccharides |
| 4 | NL | 150.0528 (C5H10O5), 132.0423 (C5H8O4) | Pentose (xylose/arabinose/ribose) related loss |
| 5 | NL | 180.0634 (C6H12O6), 162.0528 (C6H10O5) | Hexose (glucose/galactose) related loss |
| 6 | NL | 164.0685 (C6H12O5), 146.0603 (C6H10O4) | Rhamnose-related loss |
| 7 | NL | 17.0267 (NH3) | Amino acid-related loss |
| 8 | NL | 42.0102 (C2H2O) | Acetyl group |
| 9 | NL | 100.0162 (C4H4O3) | Isopropyl group |
| 10 | NL | 15.0235 (CH3) | Methyl group |
| 11 | NL | 18.0106 (H2O) | Loss of water |
| 12 | NL | 27.9949 (CO) | Loss of C![[double bond, length as m-dash]](https://www.rsc.org/images/entities/char_e001.gif) O O |
| 13 | NL | 43.9898 (CO2) | Carboxylic acid (CO2) group |
| 14 | Frag | 179.0340 (C9H7O4), 161.0231 (C9H5O3), 135.0446 (C8H7O2) | Fragments related to caffeic acid |
| 15 | NL | 180.0423 (C9H8O4) | Caffeic acid/salvianolic acid-related loss |
| 16 | NL | 162.0317 (C9H6O3) | Caffeoyl group/salvianolic acid-related loss |
| 17 | Frag | 197.0459 (C9H9O5), 179.0340 (C9H7O4), 135.0439 (C8H7O2) | Fragments related to danshensu |
| 18 | NL | 198.0528 (C9H10O5) | Danshensu/salvianolic acid-related loss |
| 19 | Frag | 519.0927 (C27H19O11), 339.0505 (C18H11O7), 321.0396 (C18H9O6), 295.0610 (C17H11O5), 197.0449 (C9H9O5), 179.0335 (C9H7O4), 161.0231 (C9H5O3) | Fragments related to salvianolic acids |
| 20 | Frag | 353.0875 (C16H17O9), 191.0553 (C7H11O6), 179.0340 (C9H7O4), 173.0445 (C7H9O5), 135.0439 (C8H7O2) | Fragments related to caffeoylquinic acids |
| 21 | Frag | 515.1190 (C25H23O12), 353.0875 (C16H17O9) | Fragments related to dicaffeoylquinic acids |
| 22a | Frag | 455.3525 (C30H47O3), 437.3420 (C30H45O2), 419.3314 (C30H43O) | Fragments related to astragaloside |
| 23 | NL | 180.0634 (C6H12O6), 162.0538 (C6H10O5), 146.0579 (C6H10O4), 132.0430 (C5H8O4) | Astragaloside-related loss |
| 24a | Frag | 184.0731 (C5H15NO4P), 124.9999 (C2H6O4P), 104.1068 (C5H14NO), 86.0961 (C5H12N) | Fragments related to lysoglycerophosphocholines |
| 25 | Frag | 242.0791 (C7H17NO6P), 224.0693 (C7H15NO5P), 168.0426 (C4H11NO4P), 78.9585 (PO3) | |
| 26 | NL | 60.0220 (CH3+CO2H) | Lysoglycerophosphocholine-related loss |
| 27 | Frag | 96.9595 (HSO4) | Sulphate group |
| 28 | Frag | 79.9562 (SO3) | Sulfate group |
| 29a | NL | 18.0106 (H2O), 27.9949 (CO), 28.0310 (C2H4), 42.0470 (C3H6), 56.0630 (C4H8) | Loss of phthalides |
| 30 | NL | 15.0235 (CH3), 18.0106 (H2O), 29.0391 (C2H5), 58.0780 (C4H10), 71.0860 (C5H11), 86.1096 (C6H14) | Loss of furan sulfonic acids |
| Frag | 79.9568 (SO3) | Fragment related to furan sulfonic acids | |
| 31 | NL | 157.1592 (C10H21O), 141.1643 (C10H21), 86.1096 (C6H14), 72.0939 (C5H12) | Loss of alkyl sulfuric acids |
| Frag | 96.9595 (HSO4), 79.9562 (SO3), 165.0217 (C5H9O4S) | Fragments related to alkyl sulfuric acids | |
Targeted characterization of known compounds and their unknown analogues from DZT
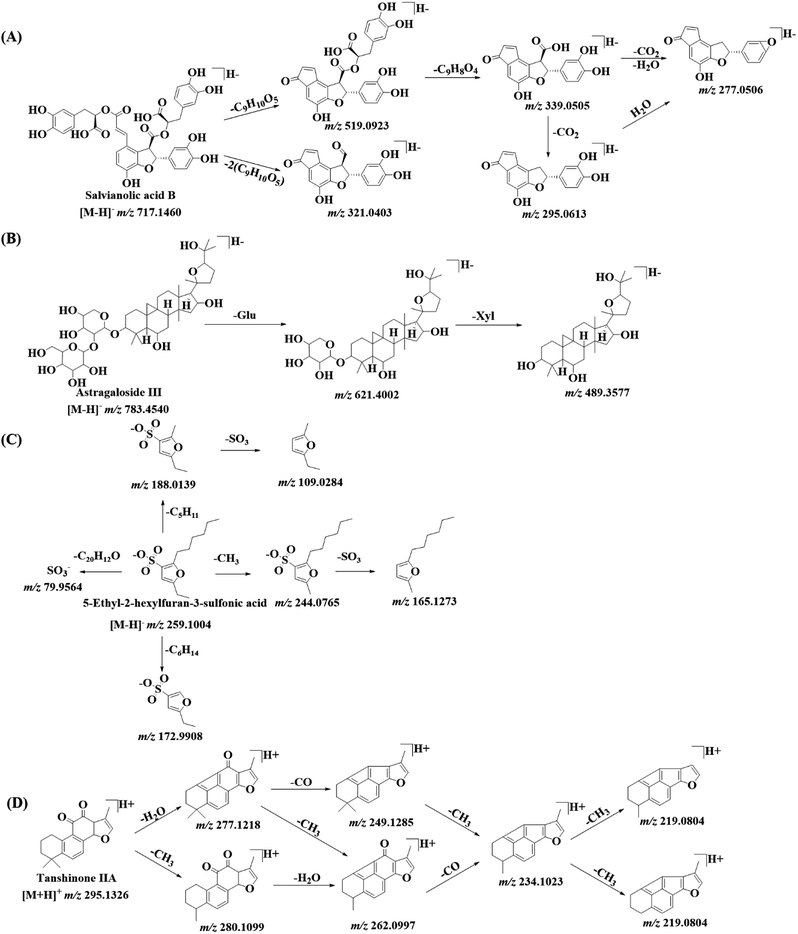 | ||
| Fig. 4 The fragmentation patterns of salvianolic acid B (A), astragaloside III (B), 5-ethyl-2-hexylfuran-3-sulfonic acid (C) and tanshinone IIA (D) in DZT. | ||
A total of 35 salvianolic acids were identified, of which five compounds (danshensu, lithospermic acid, salvianolic acid A, salvianolic acid B and rosmarinic acid) were unambiguously identified by comparing their retention times, accurate molecular masses and MS/MS fragments with those of the standard references; moreover, the remaining 30 compounds were tentatively identified by comparing their exact molecular masses, fragmentation information, retention times and drift times with previously reported values.32–34
In this work, 21 astragalosides along with one sapogenin were positively or tentatively identified from DZT, and four of them (peaks 67a, 69a, 83c and 84c from AM) were potentially new compounds.
For furan sulfonic acids, the neutral losses were CH3 (15.0235 Da), H2O (18.0106 Da), C2H5 (29.0390 Da), C4H10 (58.0780 Da), C5H11 (71.0860 Da) and C6H14 (86.1090 Da). As shown in Fig. 4C, peak 79a displays its molecular ion [M − H]− at m/z 259.1008 and mainly generates product ions at m/z 244.0765, m/z 188.0139, m/z 172.9904, m/z 165.1273, m/z 109.1284 and m/z 79.9564, corresponding to [M–H–CH3]−, [M–H–C5H11]−, [M–H–C6H14]−, [M–H–CH3–SO3]−, [M–H–C5H11–SO3]− and [SO3]−. Peak 79a can be positively identified as 5-ethyl-2-hexylfuran-3-sulfonic acid by comparing its data with the MS/MS data and the NMR spectra of pure compounds (purity > 98%) isolated in our laboratory. Comparing the MS/MS spectrum with a previously reported result,38 peaks 61b (m/z 273.0791), 66b (m/z 275.0947) and 71a (m/z 245.0836) were tentatively assigned as 5-ethyl-2-hexanoylfuran-3-sulfonic acid, 5-ethyl-2-(1-hydroxyhexyl) furan-3-sulfonic acid and 5-ethyl-2-pentylfuran-3-sulfonic acid, respectively. Another three isomers (peaks 49, 62b and 73a) of 5-ethyl-2-(1-hydroxyhexyl) furan-3-sulfonic acid were also detected at m/z 275.0948, eluting at 10.95 min, 12.37 min and 14.37 min, respectively. However, their structures could not be confirmed using only the MS/MS data. To the best of our knowledge, two furan sulfonic acids (peaks 62b and 73a) from Pheretima aspergillum (E. Perrier) were reported for the first time.
For alkyl sulfuric acids, the fragment ion was m/z 96.9596, corresponding to [HSO4]−. Two isomers (peaks 89a and 91) with the molecular formula C10H22O4S showed their molecular ions [M − H]− at m/z 237.1170 and 237.1156 and then yielded high intensity fragment ions at m/z 96.9596 [HSO4]− and 79.9570 [SO3]− by the loss of C10H21 (decyl) and C10H22O (decyl ether), respectively. In addition, peak 91 presented an ion at m/z 165.0217, corresponding to the loss of 72.0939 Da (C5H12). Therefore, peak 89a could be tentatively deduced as decyl hydrogen sulfate, and peak 91 might be 5-decanyl hydrogen sulfate. Three isomers (peaks 97a, 100 and 101) were detected at m/z 251.1313 (C11H24O4S) and eluted at 18.02 min, 18.45 min and 18.58 min, respectively. Peak 100 presented the same fragment ions as that of peak 89a and might be tentatively identified as undecyl sulfuric acid. Peaks 97a and 101 also showed the same fragment ions at m/z 165.0217 as peak 91, corresponding to the loss of 86 Da (C6H14), and they might be putatively assigned as two isomers of undecyl sulfuric acid. Peak 43 (m/z 207.0702 [M − H]−) matched the molecular formula C8H16O4S and showed its fragment ion at m/z 79.9562. Peak 43 was a potentially unknown compound. In addition, peak 22 was tentatively assigned as hirudonucleodisulfide B according to a previous literature report.39
In total, 29 tanshinones in DZT were observed, of which four tanshinones (peaks 102a, 112, 123 and 130) were unequivocally identified by comparing their retention times and MS/MS spectra data with those of authenticated compounds; the remaining 25 compounds were putatively identified by comparing the MS/MS spectral data with previously reported values.32,40–43
As a result, 16 phthalides were putatively identified, including three alkyl phthalides (6,7-epoxyligustilide, 3-butylidene phthalide, senkyunolide A), 11 hydroxyl phthalides (senkyunolide F, 3-n-butyl-3-hydroxy-4,5,6,7-tetra-hydro-6,7-dihydroxy phthalide, senkyunolide N, senkyunolide J, senkyunolide I/senkyunolide H, (−)-3-butyl-7-hydroxyphthalide, 3-butyl-4-hydroxyphthalide, senkyunolide K, senkyunolide G, senkyunolide E, senkyunolide M/senkyunolide Q) and two dimers of phthalide (senkyunolide P and levistolide A).
Consequently, 13 flavonoids and their derivatives (six isoflavones, two isoflavans, three flavones, one pterocarpans and one flavonone) were assigned by comparison with previous results.48–50
Three acetylated disaccharide (AD) isomers, namely, AD-383A (peak 10, m/z 383.1189), AD-383B (peak 11, m/z 383.1189) and AD-383C (peak 13, m/z 383.1187) with the molecular formula C14H24O12 eluted at 3.13 min, 3.41 min and 3.84 min, respectively. They presented values 42 Da (C2H2O) greater than that of sucrose, suggesting their acetylation. However, the fragmentation pathways did not allow for the elucidation of the position of the acetyl moiety. Three isopropyl derivative disaccharide (ID) isomers, namely, ID-441A (peak 14a), ID-441B (peak 15a) and ID-441C (peak 16) with the molecular formula C16H26O14 showed [M − H]− ions at m/z 441.1245, eluting at 3.92 min, 4.11 min and 4.29 min, respectively. The three isomers presented values 100 Da (C4H4O3) greater than that of sucrose, suggesting isopropylation. Although the position of the isopropyl group could not be confirmed, peaks 14a, 15a and 16 might be derived from sucrose after isopropylation. Peak 46 with the molecular formula C23H36O12 eluted at 10.65 min and displayed fragment ions at m/z 341.1084, 221.0685, and 161.0456, showing a very similar fragmentation pathway to that of sucrose and thus suggesting the presence of a sucrose group. The abundant fragment ions at m/z 191.0560 suggested the presence of a quinic acid group in compound 46. However, the enormous number of structural possibilities did not provide putative identification for peak 46. In this study, seven compounds including peaks 10, 11, 13, 14a, 15a, 16 and 46 from LC were reported in DZT for the first time.
Untargeted identification of unknown compounds from DZT
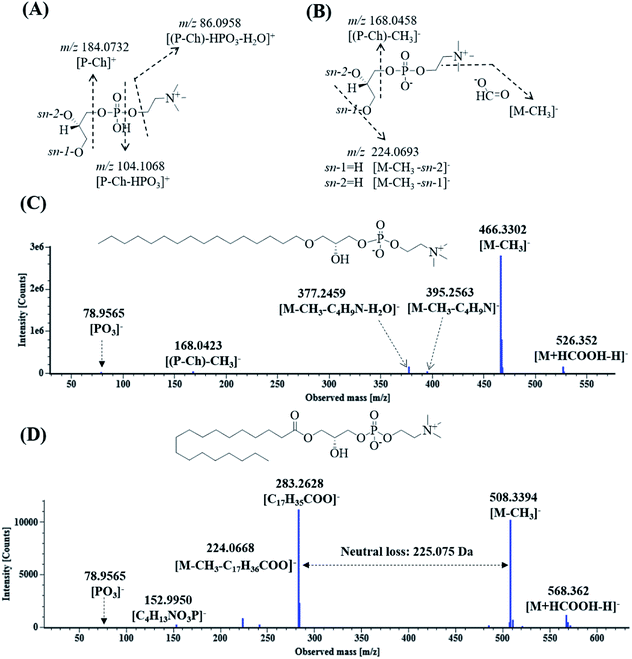
Lysoglycerophosphocholines (Lyso-GPCs) are a representative class of biochemical intermediates comprising a glycerophosphocholine backbone with a free glycerol hydroxyl at either the sn-1 or sn-2 position.54 Nineteen lyso-GPCs were discovered based on co-occurring Mass2Motifs from their fragmentation spectra. In the positive ion mode, all the spectra showed the same Mass2Motifs including the neutral loss of 18.0106 Da (H2O) and fragment ions at m/z 184.0731 ([P-Ch]+), 104.107 ([P-Ch–HPO3]+), and 86.096 ([(P-Ch)–HPO3–H2O]+) (Fig. 5A). The ion at m/z 184.0731 indicated that phosphocholine as the polar head group of phospholipids was present in the structures.54 In the negative ion mode, all the spectra shared the same Mass2Motifs including fragment ions (m/z 224.0690 and 168.0424) and a neutral loss of 60.0220 Da (Fig. 5B). Due to the use of formic acid as the elution buffer, 13 compounds were detected as a single intense solvent adduct ion [M + HCOOH–H]− in the negative ion mode; they easily eliminated CH3 to yield [M − CH3]− ions by first undergoing facile elimination of HCO2, and their neutral losses were 60.0220 Da (HCO2 + CH3) [49–51]. Based on the Mass2Motifs, element composition and previously reported results,54–56 these lyso-GPCs can be divided into two groups: lysophosphatidylcholines (lysoPCs) and lyso platelet activating factors (lyso-PAFs).Eleven compounds having peaks 97d, 98a, 98b, 103c, 103d, 110, 115a, 117, 119, 122 and 127 showed neutral losses of 225.0750 Da and yielded abundant fatty acyl-related fragment ions at m/z 301.2165, 301.2164, 277.2165, 303.2324, 279.2320, 281.3487, 281.3488, 307.2630, 307.2635, 283.2635 and 309.2794, respectively. These compounds were classified as lysoPCs, the substituents of which were long-chain fatty acyls at the sn-1 or sn-2 position. In addition, eight compounds showing peaks 103b, 105a, 106b, 108b, 111, 113, 115b and 126 were grouped into lyso-PAFs, the substituents of which were long-chain ethers at the sn-1 or sn-2 position. Peaks 115a and 122 were used as examples to elucidate the fragmentation pathway of lyso-PAFs and lyso PCs. As shown in Fig. 5C, peak 115a exhibited the molecular ion [M + HCOOH–H]− at m/z 526.3520, and yielded ions at m/z 395.2563, 377.2459, 168.0423 and 78.9565, corresponding to [M − CH3]−, [M–CH3–C4H9N]−, [M–CH3–C4H9N–H2O]−, [(P-Ch)–CH3]− and [PO3]−, respectively. As shown in Fig. 5D, peak 122 displayed its molecular ion [M + HCOOH–H]− at m/z 568.3620 and generated fragment ions at m/z 508.3394, 283.2628, 224.0668, 152.9950 and 78.9565, corresponding to [M − CH3]−, [C17H35COO]−, [M–CH3–C17H36COO]−, [C4H13NO3P]− and [PO3]−. Peaks 115 and 122 were tentatively identified as lysophosphatidylcholine O-16![[thin space (1/6-em)]](https://www.rsc.org/images/entities/char_2009.gif) :
:![[thin space (1/6-em)]](https://www.rsc.org/images/entities/char_2009.gif) 0/0
0/0![[thin space (1/6-em)]](https://www.rsc.org/images/entities/char_2009.gif) :
:![[thin space (1/6-em)]](https://www.rsc.org/images/entities/char_2009.gif) 0 and 1-stearoyl-lysophosphatidylcholine,55 respectively.
0 and 1-stearoyl-lysophosphatidylcholine,55 respectively.
Nineteen compounds were subsequently verified through the LipidMaps (http://www.lipidmaps.org) or LipidBank (http://lipidbank.jp/) database search. It should be noted that 14 compounds (peaks 97d, 98a, 98b, 103c, 103d, 106b, 108b, 110, 111, 113, 115b, 117, 119 and 127) in DZT were first reported from Hirudo nipponica Whitman.
Isomeric analysis of chemical compounds in DZT
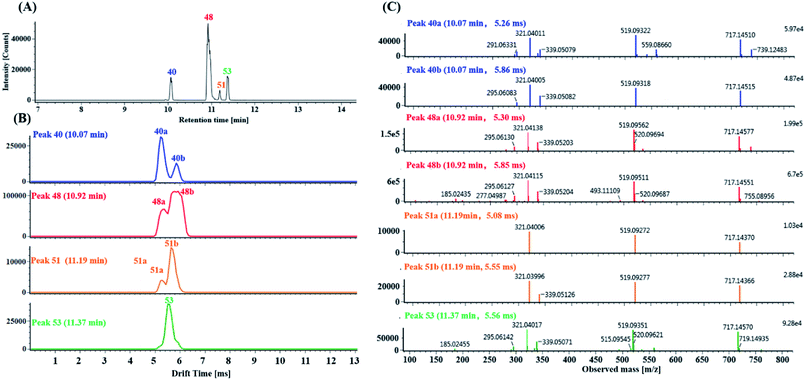
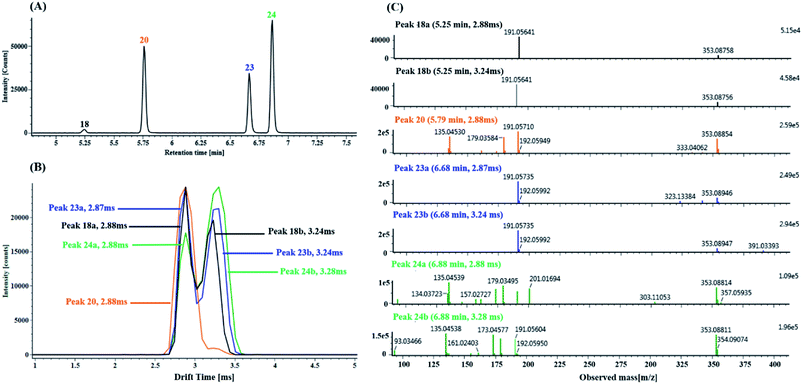
(1) Characterization of mono-CQA isomers with precursor ions at m/z 353.0880 using precursor ion mobility. Seven mono-CQAs exhibited deprotonated molecular ions [M − H]− at m/z 353.0880 ± 5 ppm, which could yield fragment ions at m/z 191.0560, 179.0351, 173.0457 and 135.0450, corresponding to [M–H–(CA + H2O)]−, [M–H–quinic acid]−, [M–H–(CA + H2O)–H2O]− and [M–H–quinic acid–CO2]−. The product ion at m/z 191.0570 was the base peak, indicating that the caffeoyl group was attached to 1-OH, 3-OH or 5-OH. However, the intensities of the product ions at m/z 179.0351 were clearly different (higher for 3-OH and lower for 1- or 5-OH). The product ion at m/z 173.0457 was the base peak, indicating that the caffeoyl group was linked to 4-OH. As shown in Fig. 7A, peaks 18, 20, 23 and 24 in the MSE and fast DDA analysis modes display the same precursor ions m/z 353.0880, eluting at 5.25 min, 5.77 min, 6.67 min and 6.86 min, respectively. Fig. 7B shows the overlaid mobility profile of peaks 18, 20, 23 and 24. It was clearly observed that 3 pairs of coeluting isomers including mobility peaks 18a/18b, 23a/23b and 24a/24b in the HDMSE mode were derived from peaks 18, 23 and 24, respectively. The corresponding fragmentation spectra for mobility peaks 18a, 18b, 20, 23a, 23b, 24a and 24b are shown in Fig. 7C. On the basis of the comparison of their retention times, drift times and fragmentation data with those of authentic standards, peaks 23b and 24b were unambiguously identified as trans-5-caffeoylquinic acid and trans-4-caffeoylquinic, respectively. Peak 20 with a single mobility peak, showing its base peak ion at m/z 191.0571 and abundant signal intensity of the ion at m/z 173.0457, was tentatively characterized as cis/trans-3-caffeoylquinic acid by comparing its retention time and fragmentation data with previously reported data.58,59 Compared with the data from the literature, peaks 23a and 24a showed similar fragmentation patterns and drift times to those of peaks 23b and 24b, and they were tentatively proposed to be cis-5-caffeoylquinic acid and cis-4-caffeoylquinic acid, respectively. From a previous literature, we inferred that 1-caffeoylquinic and 5-caffeoylquinic were undistinguished by the same fragmentation, but the greater hydrophobicity of 5-caffeoylquinic and availability of its reference standard ensured that these two compounds could be differentiated by their different retention times on a reversed-phase column. Moreover, peaks 18a and 18b showed similar drift times to those of cis-5-caffeoylquinic and trans-5-caffeoylquinic, respectively. Thus, peaks 18a and 18b were deduced and tentatively identified as cis-1-caffeoylquinic acid and trans-1-caffeoylquinic acid, respectively.
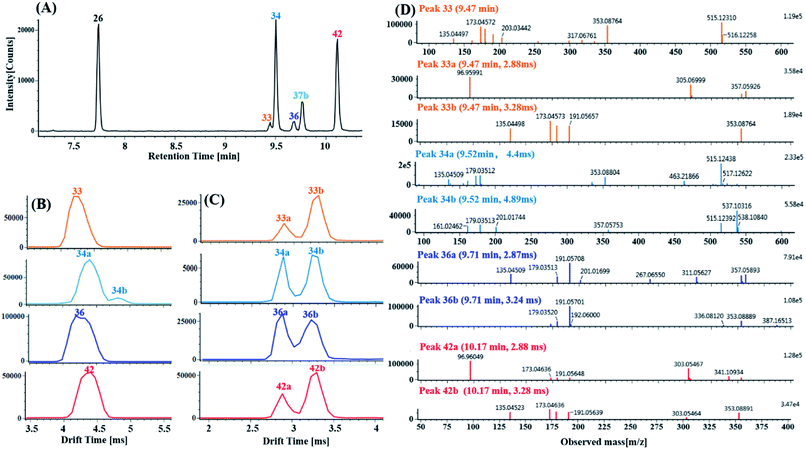
(2) Characterization of di-CQA isomers with product ions at m/z 353.0880 derived from precursor ions at m/z 515.1190 using product ion mobility. Ten di-CQAs exhibited precursor ions [M − H]− at m/z 515.1190 ± 5 ppm and generated fragment ions at 353.0880, 191.0570, 179.0351, 173.0457 and 135.0450, corresponding to [M–H–(CA–H2O)]−, [M–H–2(CA–H2O)]−, [M–H–(CA–H2O)–quinic acid]−, [M–H–2(CA–H2O)–H2O]− and [M–H–(CA–H2O)–quinic acid–CO2]−. As shown in Fig. 8A, peaks 26, 33, 34, 36, 37b and 42 in the MSE and Fast DDA modes show their precursor ions m/z 515.1190 ± 5 ppm, eluting at 7.76 min, 9.47 min, 9.52 min, 9.71 min, 9.78 min and 10.14 min, respectively. Fig. 8B and C display the corresponding mobility spectra of the precursor ions at m/z 515.1190 and product ions at m/z 353.0880 of peaks 26, 33, 34, 36, 37b and 42. Interestingly, four pairs of coeluting isomers including the mobility peaks 33a/33b, 34a/34b, 36a/36b and 42a/42b were derived from peaks 33, 34, 36 and 42, respectively. As shown in Fig. 8D, peak 33b is easily identified as trans-1,4-dicaffeoylquinic acid with the occurrence of product ions at m/z 317.0676, 299.0650, 255.0667, and 203.0331 based on the different experimental drift times and previously reported results.60 Peak 33a with only a fragment ion at m/z 353.0875 could be tentatively assigned as a di-caffeoylquinic acid isomer. Peaks 26 and 37b were proposed to be trans-1,3-dicaffeoylquinic acid and cis-1,3-dicaffeoylquinic acid, respectively, based on their different drift times and similar fragment ions including a detectable ion m/z 335.0772, base peak m/z 191.0570 and strong intensity ion m/z 179.0351 (>50% base peak). Peaks 36a and 36b, having similar mobility behaviors and fragmentation behaviors but no detectable ion m/z 335.0772 as peak 26 and 37b, were tentatively identified as cis-3,5-dicaffeoylquinic acid and trans-3,5-dicaffeoylquinic acid, respectively. Based on the occurrence of different drift times, the base peak m/z 173.0457, strong ion m/z 179.0351 and weak ion m/z 335.0772, peaks 34a and 34b were tentatively identified as cis-3,4-dicaffeoylquinic acid and tans-3,4-dicaffeoylquinic acid, respectively. Comparing their similar mobility behaviors and fragmentation patterns to those of peaks 34a and 34b, peaks 42a and 42b were putatively characterized as cis-4,5-dicaffeoylquinic acid and trans-4,5-dicaffeoylquinic acid, respectively.
Conclusions
In the present study, the combination of multidimensional acquisition methods with a data processing strategy was established for the comprehensive identification of 202 constituents in DZT. This is the first report about the component analysis of DZT. Based on the Mass2Motifs extracted from fragmentation spectra, 29 potentially unknown compounds were identified or highlighted for the first time. By using ion mobility analysis, ten pairs of coeluting isomers, which were not discovered or resolved by the conventional MSE or Fast DDA mode, were distinguished using the HDMSE mode. This study revealed the suitability of the proposed approach to discover and identify the known, unknown and isomeric compounds of DZT. Moreover, this work can be a practical and powerful paradigm for meeting the ongoing demands for the partial exploration of molecular dark matter from TCM formulae or other natural products. However, a major drawback is that the accurate structures of many compounds cannot be confirmed using MS data alone. Therefore, further studies will be required to elucidate these complex compounds using additional characterization techniques such as nuclear magnetic resonance (NMR).Conflicts of interest
The authors declare no conflict of interest.Acknowledgements
The work was supported by Professor of Chang Jiang Scholars Program, NSFC (81520108030, 21472238), Shanghai Engineering Research Center for the Preparation of Bioactive Natural Products (16DZ2280200), the Scientific Foundation of Shanghai China (13401900103, 13401900101) and the National Key Research and Development Program of China (2017YFC1700200).References
- R. Liu, R. S. Runyon, Y. Wang, S. G. Oliver, T. Fan and W. Zhang, Science, 2015, 347, S40–S42 Search PubMed.
- L. Wang, G. Zhou, P. Liu, J. Song, Y. Liang, X. Yan, F. Xu, B. Wang, J. Mao, Z. Shen, S. Chen and Z. Chen, Proc. Natl. Acad. Sci. U. S. A., 2008, 105, 4826–4831 CrossRef CAS PubMed.
- W. Lam, S. Liu, Z. Jiang and Y. Cheng, Science, 2015, 347, S43–S44 Search PubMed.
- H. Sheridan, B. Kopp, L. Krenn, D. Guo and J. Sendker, Science, 2015, 350, S64–S66 CrossRef PubMed.
- H. Zhang, D. Zheng, H. Li, H. Wang, H. Tan and H. Xu, Anal. Chim. Acta, 2016, 912, 85–96 CrossRef CAS PubMed.
- W. Si, W. Yang, D. Guo, J. Wu, J. Zhang, S. Qiu, C. Yao, Y. Cui and W. Wu, J. Pharm. Biomed. Anal., 2016, 117, 510–521 CrossRef CAS PubMed.
- R. S. Plumb, K. A. Johnson, P. Rainville, B. W. Smith, I. D. Wilson, J. M. Castro-Perez and J. K. Nicholson, Rapid Commun. Mass Spectrom., 2006, 20, 1989–1994 CrossRef CAS PubMed.
- F. Fenaille, P. B. Saint-Hilaire, K. Rousseau and C. Junot, J. Chromatogr. A, 2017, 1526, 1–12 CrossRef CAS PubMed.
- M. Sundstrom, A. Pelander and I. Ojanpera, J. Anal. Toxicol., 2017, 41, 623–630 CrossRef CAS PubMed.
- J. Boschmans, F. Lemiere and F. Sobott, J. Chromatogr. A, 2017, 1490, 80–88 CrossRef CAS PubMed.
- S. D. Pringle, K. Giles, J. L. Wildgoose, J. P. Williams, S. E. Slade, K. Thalassinos, R. H. Bateman, M. T. Bowers and J. H. Scrivens, Int. J. Mass Spectrom., 2007, 261, 1–12 CrossRef CAS.
- G. Paglia and G. Astarita, Nat. Protoc., 2017, 12, 797–813 CrossRef CAS PubMed.
- S. J. Valentine, M. D. Plasencia, X. Liu, M. Krishnan, S. Naylor, H. R. Udseth, R. D. Smith and D. E. Clemmer, J. Proteome Res., 2006, 5, 2977–2984 CrossRef CAS PubMed.
- J. Far, C. Delvaux, C. Kune, G. Eppe and E. de Pauw, Anal. Chem., 2014, 86, 11246–11254 CrossRef CAS PubMed.
- X. Qiao, R. Li, W. Song, W. Miao, J. Liu, H. Chen, D. Guo and M. Ye, J. Chromatogr. A, 2016, 1441, 83–95 CrossRef CAS PubMed.
- J. Zhang, Z. Wang, Y. Li, Y. Liu, W. Cai, C. Li, J. Lu and Y. Qiao, Talanta, 2016, 147, 16–27 CrossRef CAS PubMed.
- X. Cheng, J. Wan, P. Li and L. Qi, J. Chromatogr. A, 2011, 1218, 5774–5786 CrossRef CAS PubMed.
- K. P. Bateman, J. Castro-Perez, M. Wrona, J. P. Shockcor, K. Yu, R. Oballa and D. A. Nicoll-Griffith, Rapid Commun. Mass Spectrom., 2007, 21, 1485–1496 CrossRef CAS PubMed.
- J. Chen, Z. Shi, Y. Song, X. Guo, M. Zhao, P. Tu and Y. Jiang, J. Chromatogr. A, 2016, 1464, 102–114 CrossRef CAS PubMed.
- H. Ouyang, J. Li, B. Wu, X. Zhang, Y. Li, S. Yang, M. He and Y. Feng, J. Chromatogr. A, 2017, 1502, 38–50 CrossRef CAS PubMed.
- J. J. J. van der Hooft, J. Wandy, F. Young, S. Padmanabhan, K. Gerasimidis, K. E. V. Burgess, M. P. Barrett and S. Rogers, Anal. Chem., 2017, 89, 7569–7577 CrossRef CAS PubMed.
- J. J. J. van der Hooft, J. Wandy, M. P. Barrett, K. E. V. Burgess and S. Rogers, Proc. Natl. Acad. Sci. U. S. A., 2016, 113, 13738–13743 CrossRef PubMed.
- J. Wandy, Y. Zhu, J. J. J. van der Hooft, R. Daly, M. P. Barrett and S. Rogers, Bioinformatics, 2018, 34, 317–318 CrossRef CAS PubMed.
- Y. Luo, J. Han, J. Xu and Y. Zhao, Henan Traditional Chinese Medicine, 2014, 34, 628–629 Search PubMed.
- N. Mi, T. Cheng, H. Li, P. Yang, X. Mu, X. Wang, X. Zu, X. Qi, X. Guo, J. Ye and W. Zhang, J. Pharm. Biomed. Anal., 2018, 164, 70–85 CrossRef PubMed.
- H. Y. Fan, F. H. Fu, M. Y. Yang, H. Xu, A. H. Zhang and K. Liu, Thromb. Res., 2010, 126, E17–E22 CrossRef CAS PubMed.
- Y. Yao, A. H. Liu, W. Y. Wu, S. H. Guan, B. H. Jiang, M. Yang, K. S. Bi, X. Liu and D. A. Guo, Phytochem. Lett., 2008, 1, 135–138 CrossRef CAS.
- Y. Yao, W. Y. Wu, A. H. Liu, S. S. Deng, K. S. Bi, X. Liu and D. A. Guo, Am. J. Chin. Med., 2008, 36, 313–328 CrossRef CAS PubMed.
- Z. S. Huang, C. L. Zeng, L. J. Zhu, L. Jiang, N. Li and H. Hu, J. Thromb. Haemostasis, 2010, 8, 1383–1393 CrossRef CAS PubMed.
- Y. Chen, N. Zhang, J. Ma, Y. Zhu, M. Wang, X. Wang and P. Zhang, J. Pharm. Biomed. Anal., 2016, 117, 178–183 CrossRef CAS PubMed.
- J. Cao, Z. Chen, Y. Zhu, Y. Li, C. Guo, K. Gao, L. Chen, X. Shi, X. Zhang, Z. Yang and A. Wen, J. Ethnopharmacol., 2014, 155, 1053–1060 CrossRef PubMed.
- J. Cao, J. Wei, Y. Hu, C. He, M. Chen, J. Wan and P. Li, J. Chromatogr. A, 2016, 1427, 79–89 CrossRef CAS PubMed.
- S. T. Yang, X. Wu, W. Rui, J. Guo and Y. F. Feng, Acta Chromatogr., 2015, 27, 711–728 CrossRef CAS.
- X. Chen, Z. Lou, H. Zhang, G. Tan, Z. Liu, W. Li, Z. Zhu and Y. Chai, Rapid Commun. Mass Spectrom., 2011, 25, 1661–1674 CrossRef CAS PubMed.
- C. Li, H. Song, S. Liu, Q. Wang, G. Dai, X. Ding and W. Ju, J. Sep. Sci., 2016, 39, 1099–1109 CrossRef CAS PubMed.
- L. Qi, J. Cao, P. Li, Q. Yu, X. Wen, Y. Wang, C. Li, K. Bao, X. Ge and X. Cheng, J. Chromatogr. A, 2008, 1203, 27–35 CrossRef CAS PubMed.
- C. Chu, H. Cai, M. Ren, E. H. Liu, B. Li, L. Qi and P. Li, J. Sep. Sci., 2010, 33, 570–581 CrossRef CAS PubMed.
- M. Liebeke, N. Strittmatter, S. Fearn, A. J. Morgan, P. Kille, J. Fuchser, D. Wallis, V. Palchykov, J. Robertson, E. Lahive, D. J. Spurgeon, D. McPhail, Z. Takats and J. G. Bundy, Nat. Commun., 2015, 6, 7869 CrossRef CAS PubMed.
- H. Dong, J. Ren, J. Wang, L. Ding, J. Zhao, S. Liu and H. Gao, J. Evidence-Based Complementary Altern. Med., 2016, 1–11 Search PubMed.
- Z. Zhu, H. Zhang, L. Zhao, X. Dong, X. Li, Y. Chai and G. Zhang, Rapid Commun. Mass Spectrom., 2007, 21, 1855–1865 CrossRef CAS PubMed.
- Y. Zhou, G. Xu, F. F. K. Choi, L. Ding, Q. Bin Han, J. Z. Song, C. F. Qiao, Q. Zhao and H. Xu, J. Chromatogr. A, 2009, 1216, 4847–4858 CrossRef CAS PubMed.
- Z. Ma, M. Zhang and Z. Song, Rapid Commun. Mass Spectrom., 2009, 23, 2857–2866 CrossRef CAS PubMed.
- M. Yang, A. H. Liu, S. H. Guan, J. H. Sun, M. Xu and D. Guo, Rapid Commun. Mass Spectrom., 2006, 20, 1266–1280 CrossRef CAS PubMed.
- P. O. Donkor, Y. Chen, L. Ding and F. Qiu, J. Ethnopharmacol., 2016, 194, 530–548 CrossRef CAS PubMed.
- X. Ran, L. Ma, C. Peng, H. Zhang and L. Qin, Pharm. Biol., 2011, 49, 1180–1189 CrossRef CAS PubMed.
- X. Lei, G. Li, L. Cheng, X. Wang and F. Meng, J. Pharm. Biomed. Anal., 2018, 154, 123–137 CrossRef CAS PubMed.
- X. Z. Zhang, H. B. Xiao, Q. Xu, X. L. Li, L. N. Wang and X. M. Liang, J. Chromatogr. Sci., 2003, 41, 428–433 CAS.
- L. Qi, X. Wen, J. Cao, C. Li, P. Li, L. Yi, Y. Wang, X. Cheng and X. Ge, Rapid Commun. Mass Spectrom., 2008, 22, 2493–2509 CrossRef CAS PubMed.
- J. Zhang, X. Xu, W. Xu, J. Huang, D. Zhu and X. Qiu, J. Chromatogr. Sci., 2015, 53, 945–952 CAS.
- X. Zhang, H. Xiao, X. Xue, Y. Sun and X. Liang, J. Sep. Sci., 2007, 30, 2059–2069 CrossRef CAS PubMed.
- T. Yamagaki and A. Sato, Anal. Sci., 2009, 25, 985–988 CrossRef CAS PubMed.
- W. Liu, J. Fan, Y. Li, X. Qiu, X. Liu, R. Su and Z. Zhao, Chin. J. Pharm. Anal., 2014, 34, 1417–1421 CAS.
- Y. Zhang, W. Dong, J. Huo and W. Wang, Chin. Tradit. Herb. Drugs, 2017, 48, 252–262 Search PubMed.
- N. Khaselev and R. C. Murphy, J. Am. Soc. Mass Spectrom., 2000, 11, 283–291 CrossRef CAS PubMed.
- N. Noda, R. Tanaka, M. Nishi, S. Inoue and K. Miyahara, Chem. Pharm. Bull., 1993, 41, 1366–1368 CrossRef CAS PubMed.
- R. C. Murphy, J. Fiedler and J. Hevko, Chem. Rev., 2001, 101, 479–526 CrossRef CAS PubMed.
- A.-H. Liu, H. Guo, M. Ye, Y. Lin, H. Sun, M. Xu and D. Guo, J. Chromatogr. A, 2007, 1161, 170–182 CrossRef CAS PubMed.
- M. N. Clifford, J. Kirkpatrick, N. Kuhnert, H. Roozendaal and P. R. Salgado, Food Chem., 2008, 106, 379–385 CrossRef CAS.
- C. Xie, K. Yu, D. Zhong, T. Yuan, F. Ye, J. A. Jarrell, A. Millar and X. Chen, J. Agric. Food Chem., 2011, 59, 11078–11087 CrossRef CAS PubMed.
- M. N. Clifford, S. Knight and N. Kuhnert, J. Agric. Food Chem., 2005, 53, 3821–3832 CrossRef CAS PubMed.
Footnotes |
| † Electronic supplementary information (ESI) available. See DOI: 10.1039/c8ra10100k |
| ‡ These authors contributed equally to this work. |
| This journal is © The Royal Society of Chemistry 2019 |

