
 Open Access Article
 This Open Access Article is licensed under a Creative Commons Attribution-Non Commercial 3.0 Unported Licence
Molecular ferroelectric pyridin-2-ylmethanaminium perchlorate with phase transition induced by disorder of perchlorate†
Xuecheng Gan,
Zheng Tang,
Wenjun Zhang,
Cong Xu,
Xiaofan Sun,
Zhangran Gao,
Yizhang Wu,
Hong-Ling Cai * and
X. S. Wu*
* and
X. S. Wu*
Collaborative Innovation Center of Advanced Microstructures, Laboratory of Solid State Microstructures, School of Physics, Nanjing University, Nanjing 210093, P. R. China. E-mail: hlcai@nju.edu.cn; xswu@nju.edu.cn
First published on 13th February 2019
Abstract
Molecular ferroelectrics are a kind of functional materials that have large application prospects. Comparing with the traditional inorganic ferroelectrics, they have some advantages, such as easy design, environment-friendliness, nontoxicity, and flexibility. In this study, a new molecular ferroelectric pyridin-2-ylmethanaminium perchlorate was discovered, which undergoes a ferroelectric phase transition at around 264.8 K. The spontaneous polarization reaches 0.22 μC cm−2, and the coercive fields are as small as 1.1 kV cm−1 at 202 K. The single-crystal X-ray diffraction analysis reveals that the space group transforms from a polar space group of P21 at 173 K to a centrosymmetric space group of P21/c at 293 K. By analyzing the crystal structure changes below and above the phase transition temperature, it can be concluded that the phase transition is induced by the disorder of perchlorate. Its ferroelectricity was confirmed by the measurements of differential scanning calorimetry, dielectric and hysteresis loop.
Introduction
Ferroelectrics are a kind of polar material that has a spontaneous polarization, and the spontaneous polarization can be reversed by an external electric field.1 Since its discovery in 1921, ferroelectrics have been widely applied in electric random access memories (FeRAM), infrared detectors, pyroelectric vidicons, remote sensing, nonlinear optical devices, capacitors, and laser frequency converters.2–15 Molecular ferroelectrics, as one class of ferroelectric materials, compared with the traditional inorganic ferroelectric materials, have some advantages, such as easy design, nontoxicity, and flexibility.16–20 The study of ferroelectricity began in 1920 with the research on the special dielectric properties of Rochelle salt by Valasek,21 which was nearly 100 years ago. Thereafter, a lot of ferroelectrics have been discovered, such as BaTiO3 (BTO),21,22 KH2PO4 (KDP),23 and LiNbO3. The discoveries of these excellent inorganic ferroelectrics have greatly promoted the research process of ferroelectrics and the practical applications of ferroelectric materials. However, the development of organic ferroelectric is lagging behind. With the enhancement in people's environmental awareness, the advantages of organic ferroelectrics with respect to environmental protection have been highlighted, which has made it one of the research hotspots in recent years. Molecular ferroelectric croconic acid, which has a spontaneous polarization at about 20 μC cm−2 was discovered by Horiuchi.24 The molecular ferroelectric diisopropylammonium perchlorate with spontaneous polarization (∼23 μC cm−2), which is close to BTO (∼26 μC cm−2), has been reported.25,26 In addition, there are many molecular ferroelectrics that have superior ferroelectric properties, such as diisopropylammonium bromide,27,28 4-(cyanomethyl)anilinium perchlorate,29 and 4-methoxyanilinium tetrafluoroborate 18-crown-6.30 Recently, a number of pyridyl-based molecular ferroelectrics have been discovered, such as PyX (Py = pyridinium and X = ClO4,31 BF4,32 ReO4,33 IO4 (ref. 34)), (4-amino-2-bromopyridinium)(4-amino-2-bromopyridine) tetrafluoroborate,18 and pyridin-4-ylmethanaminium perchlorate.35Herein, we discovered a new molecular ferroelectric pyridin-2-ylmethanaminium perchlorate (Fig. 1) with the chemical formula of H+yl-pyH+(ClO4−)2, [yl = 2-ylmethanamine, py = pyridin] (compound 1) based on pyridin-2-ylmethanamine and perchlorate acid, which undergoes a ferroelectric phase transition at around Tc = 264.8 K. The spontaneous polarization reaches 0.22 μC cm−2, and the coercive field is 1.1 kV cm−1 at 202 K. The single-crystal X-ray diffraction reveals that the space group at 173 K is a polar space group P21, and it is a centrosymmetric space group P21/c at 293 K. In addition, the ferroelectricity of compound 1 was confirmed by other measurements, which includes differential scanning calorimetry, dielectric and P–E hysteresis loop.
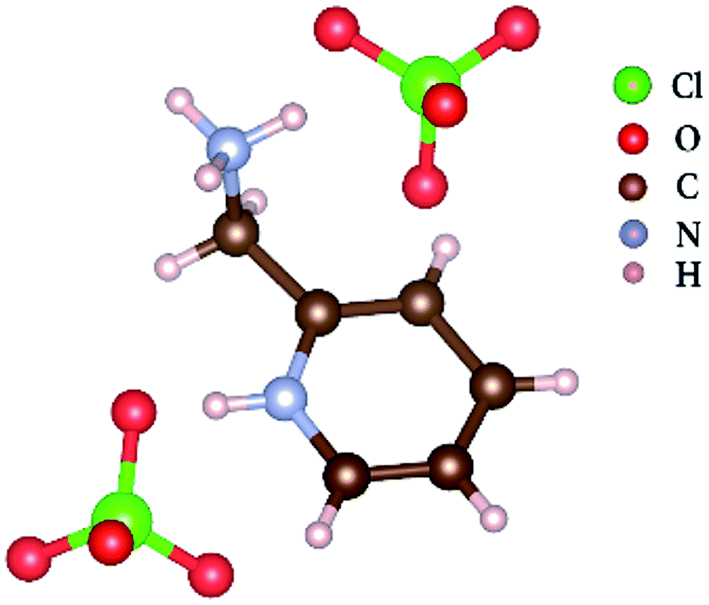 | ||
| Fig. 1 Molecular structure of compound 1. | ||
Experimental Methods
All reagents and solvents were of reagent grade and used without further purification. Concentrated perchloric acid (71 wt%, 5.66 g, 0.04 mol) was added dropwise to pyridin-2-ylmethanamine (99 wt%, 2.18 g, 0.02 mol) in methanol (50 mL). Continuous stirring and resettling was done to obtain a colorless solution. A yellow block of compound was obtained after 2 weeks through the slow evaporation of aqueous solution at room temperature. Differential scanning calorimetry (DSC) and heat capacity measurements of the single crystals were performed on NETZSCH DSC 200 F3 under nitrogen protection in aluminum crucibles with a heating or cooling rate of 10 K min−1. The variable-temperature single-crystal X-ray diffraction analysis was carried out using a Rigaku Saturn 724+ CCD diffractometer equipped with Mo Kα radiation (λ = 0.71073 Å). Data collection, cell refinement, and data reduction were performed using Rigaku Crystalclear 1.3.5. The structures of crystals were solved by direct methods and refined by the full matrix method based on F2, using the SHELXLTL software package. All non-hydrogen atoms were refined anisotropically, and the positions of all hydrogen atoms were generated geometrically. Raman spectra (Horiba Jobin Yvon HR800) were performed using the 632.8 nm laser line of a He–Ne laser and were recorded in the back scattering geometry with a charge-coupled device detector. A 50× microscope objective was used to focus the incident laser beam to a spot of about 3 mm in diameter. The sample was placed in a variable temperature cryostat, which can control the temperature from 293 K to 213 K. For dielectric, P–E hysteresis loops measurement, the single crystals were cut into thin plates. Silver conductive paste deposited on the plate surfaces was used as the electrodes. The complex permittivity measurement was performed using Tonghui TH2828A LCR meter at the frequency from 20 Hz to 1 MHz with an applied electric field of 0.5 V. The pyroelectric current was measured using Keithley 6517B electrometer. The P–E hysteresis loops were recorded on a Precision Premier II (Radiant Technologies, Inc.).Results and discussion
DSC is a commonly used thermal analysis method, which can be used to observe the latent heat of ferroelectric phase transition. The temperature-dependent DSC curve (Fig. 2) shows an endothermic peak around Tc = 264.8 K in the heating process and an exothermic peak around in the cooling process, which reveals a reversible phase transition. Here, the exothermic peak is negative, and the endothermic peak is positive. The DSC curve shows a thermal hysteresis of about 18.6 K, which indicates a relaxation phase transition and a large thermal potential barrier. As a matter of convenience, the phases above/below Tc are labeled as high-temperature phase (HTP)/low-temperature phase (LTP), respectively. The entropy changes of phase transitions can be calculated as ΔS = ΔH/T, where the value of enthalpy change ΔH can be integral from the
  or Tc peak area. The entropy change (ΔS) at around Tc is 8.28 J mol−1 K−1. According to the Boltzmann equation (ΔS = R
![[thin space (1/6-em)]](https://www.rsc.org/images/entities/char_2009.gif) lnN, where R is the universal gas constant and N represents the ratio of possible configurations), it is found that N = 2.71, manifesting that the phase transition at Tc is of an order–disorder type.
lnN, where R is the universal gas constant and N represents the ratio of possible configurations), it is found that N = 2.71, manifesting that the phase transition at Tc is of an order–disorder type.
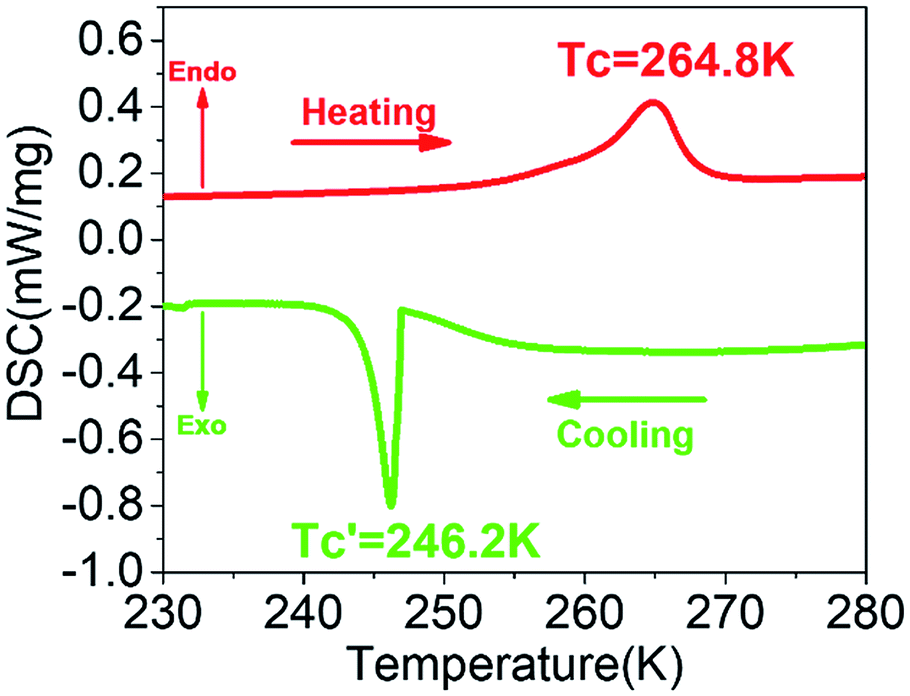 | ||
| Fig. 2 Temperature dependence of DSC curve of the sample at a cooling/heating rate of 10 K min−1. | ||
Ferroelectric crystals always undergo structural transitions such as ferroelectric-paraelectric or ferroelectric–ferroelectric phase transitions. These structural phase transitions are induced by pressure, temperature, electric field, and shock wave. The large anomalies in dielectric behaviors will be engendered, which is an essential characteristic of the ferroelectrics. The dielectric behavior can be expressed by measuring the temperature-dependent permittivity. Fig. 3a shows the dielectric behavior of compound 1 measured along b-axis in the heating process with frequency from 500 Hz to 1 MHz, demonstrating that the dielectric behaviour is frequency dependent. The dielectric constant (ε′) has a peak at the temperature of Tc = 265.8 K in the heating process. For the ferroelectric phase transition, the dielectric response should follow the Curie–Weiss law, ε′ = ε0 + Cpara/(T − Tc) (T > Tc) or ε′ = ε0 + Cferro/(Tc − T) (T < Tc), where Cpara and Cferro are the Curie–Weiss constant and the ε0 is the optical frequency limit of the dielectric constant. Fig. 3b shows the temperature-dependent 1/ε′ values at a frequency of 500 Hz in the heating process. The fitted Curie–Weiss constant Cpara in HTP and the Cferro in LTP are 68 and 250 K, respectively (other frequencies are listed in Table S2†). These results fit well with Curie–Weiss law.
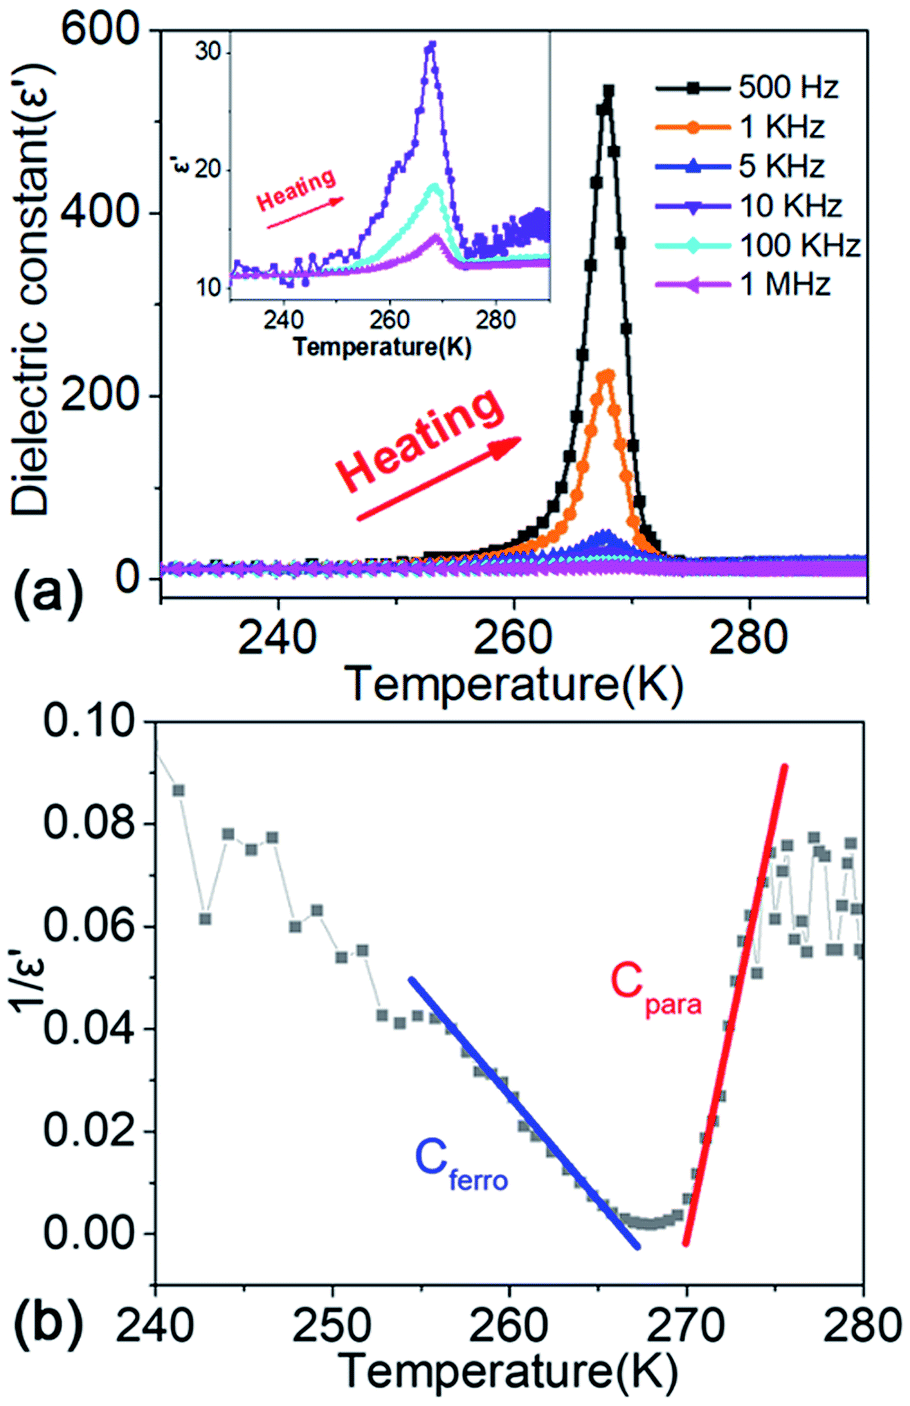 | ||
| Fig. 3 (a) Temperature-dependence of real part (ε′) of complex dielectric constant of the compound in heating process. (b) The reciprocal real part of dielectric constant 1/ε′ at 500 Hz as a function of temperature in heating process. | ||
The variable temperature single-crystal X-ray diffraction (Fig. 4) can well reveal the origin of the ferroelectric properties of compound 1. Compound 1 crystallizes in the monoclinic crystal system with a centrosymmetric space group P21/c (point group: C2h, symmetric operation elements: E, C2, σh, i) at 293 K (CCDC number: 1857985). Both nitrogen atoms on pyridin-2-ylmethanaminium are protonated. Since the space group in the HTP is centrosymmetric, the dipole moment from ClO4– anions to –NH3+ cations in the cell are equivalent and antiparallel, there is no net polarization. It is noteworthy that the oxygen atoms in ClO4− anions have multiple equilibrium positions in the HTP. A quarter of the ClO4− anions in each cell have disordered oxygen atoms. Compound 1 transforms to a monoclinic crystal system with a polar space group P21 (point group: C2; symmetric operation elements: E, C2) at 173 K (CCDC number: 1857987). The two hydrogen atoms on the –NH3 attract two ClO4− anions to form hydrogen bonds, respectively. It is known from the direction of each dipole that the direction of polarization is along the b-axis. There is no disorder of ClO4− anions in each cell, which indicates that the disorder is reduced from HTP to LTP. The vibration at 628 cm−1 comes from the inplane deformation of the perchlorate anion.16,36 By varying temperature, Raman peak position shifts before and after the phase transition at 628 cm−1 (Fig. S2†), it can also be seen that the perchloric acid disorder changes before and after the phase transition. This further indicates that the ferroelectric phase transition at Tc belongs to the order–disorder type ferroelectric. It can be concluded from the crystal structure analysis that the HTP has more slip symmetry than the LTP. In addition, the reduction of symmetric operation elements indicates that the essence of ferroelectric phase transition in compound 1 is symmetry breaking.
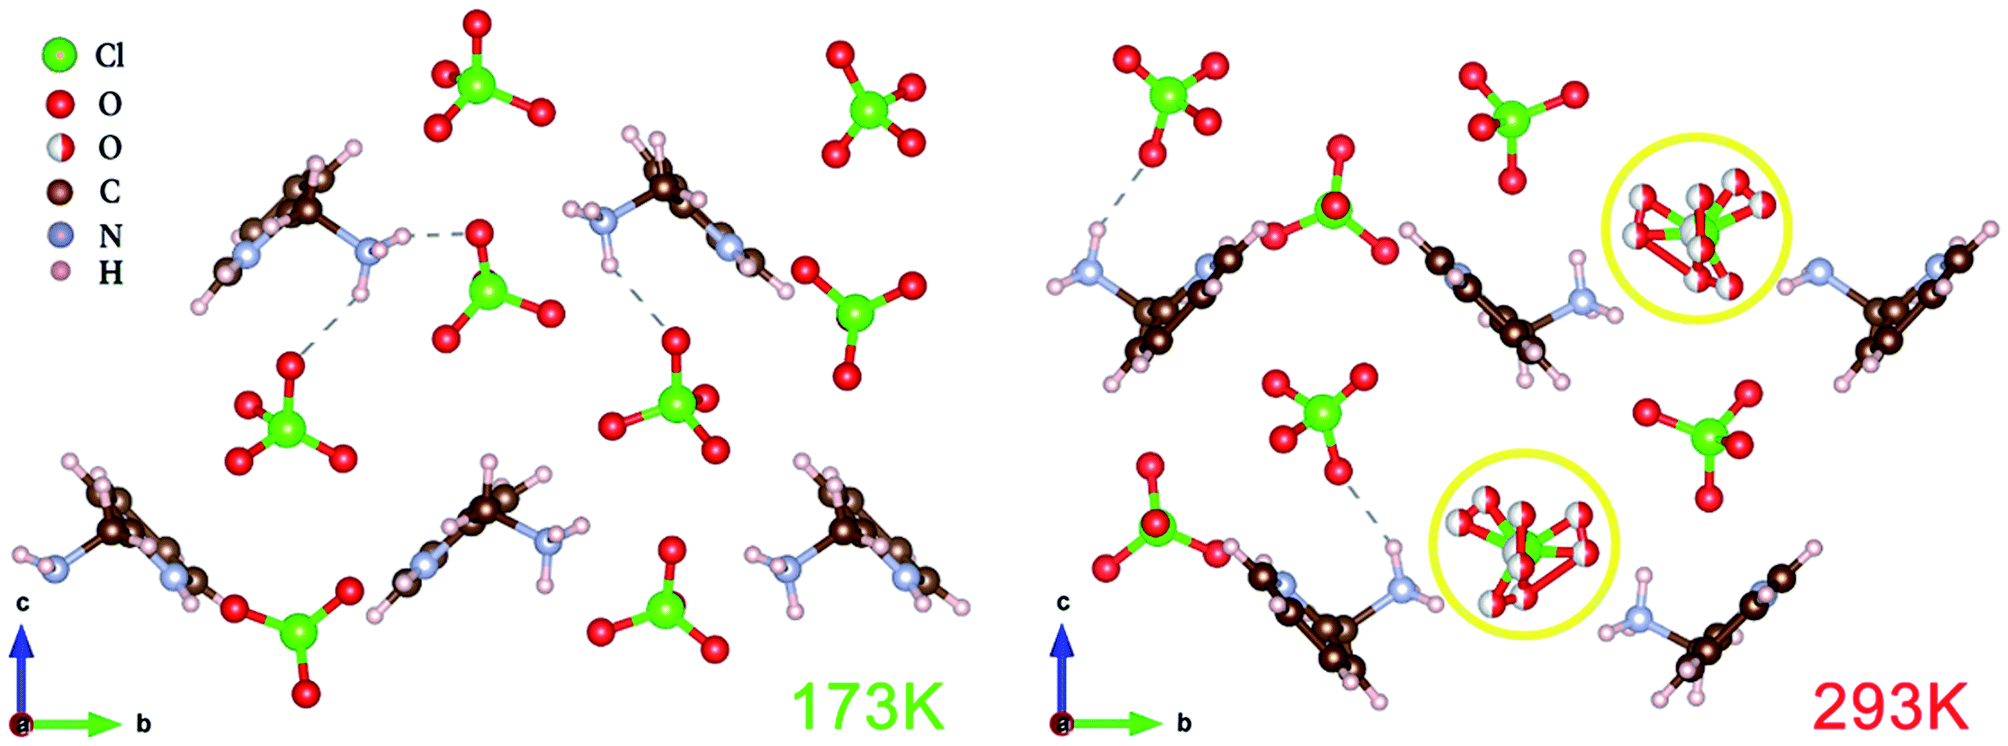 | ||
| Fig. 4 Crystal structure diagrams of the compound at 173 K and 293 K. | ||
The spontaneous polarization of ferroelectrics can be reversed with the reversal of the external electric field, exhibited by the typical polarization–electric field (P–E) hysteresis loops below the Tc. Fig. 5 shows the P–E hysteresis loops of compound 1 at different temperatures with a frequency of 50 Hz. The P–E hysteresis loops indicate that the spontaneous polarization increases slightly with the increase in the temperature and the coercive field decreases gradually. The spontaneous polarization (Ps) is 0.22 μC cm−2, and the coercive field (Ec) is 1.1 kV cm−1 as obtained from the ferroelectric hysteresis loop at 202 K. The value of the spontaneous polarization is slightly larger than that of the Rochelle salt (0.2 μC cm−2), which is less than the recently reported pyridin-4-ylmethanaminium perchlorate (1.25 μC cm−2). The coercive field is much smaller than most organic ferroelectrics, which is much less than that of the pyridin-4-ylmethanaminium perchlorate (2.6 kV cm−1). The hysteresis loops further demonstrate the ferroelectricity of pyridin-2-ylmethanaminium perchlorate below the Curie temperature.
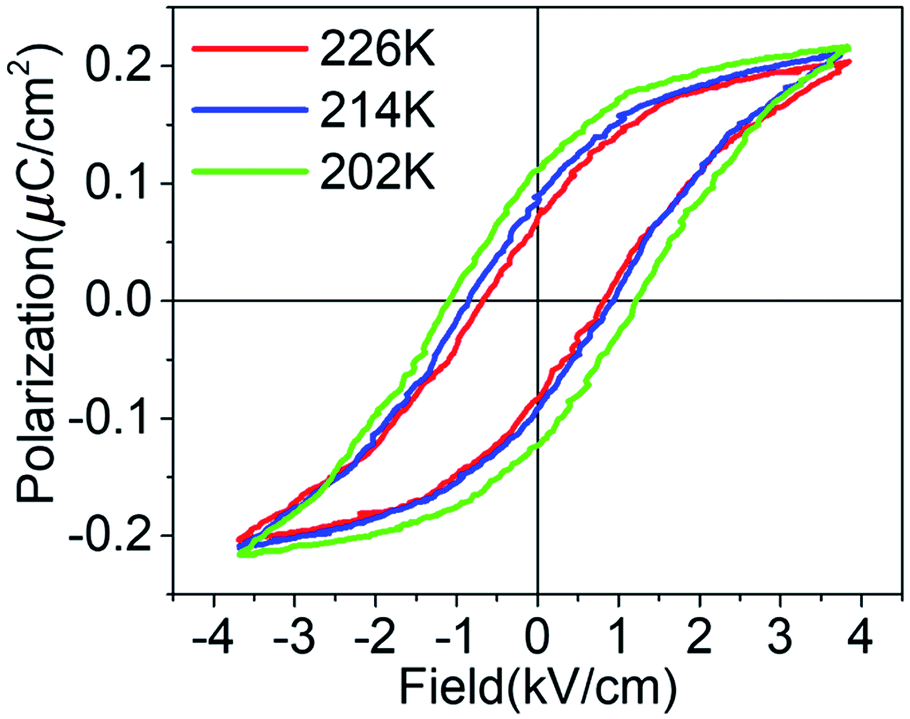 | ||
| Fig. 5 P–E hysteresis loops of compound 1 at different temperatures with a frequency of 50 Hz. | ||
Conclusions
In summary, we have discovered a new molecular ferroelectric pyridin-2-ylmethanaminium perchlorate, which is ferroelectric below Tc = 264.8 K and undergoes a ferroelectric phase transition at Tc. The spontaneous polarization of compound 1 is 0.22 μC cm−2, and the coercive field is 1.1 kV cm−1 at a temperature of 202 K. X-ray diffraction analysis reveals that the space group from LTP to HTP changes from P21 to P21/c. The X-ray diffraction analysis also shows that it belongs to the order–disorder type ferroelectrics.Conflicts of interest
There are no conflicts to declare.Acknowledgements
This study was supported by the National Natural Science Foundations of China (11574138, 21427801, 11874200), the Top-Notch Young Talents Program of China, the National Key R&D Program of China (2016YFA0201104), and Dengfeng Project B of Nanjing University.References
- S. Horiuchi and Y. Tokura, Nat. Mater., 2008, 7, 357–366 CrossRef CAS PubMed
.
- M. D. Aggarwal, Ferroelectrics, 2008, 366, 84–121 CrossRef
- M. E. Lines, A. M. Glass and G. Burns, Principles and Applications of Ferroelectrics and Related Materials, Clarendon Press, 2001 Search PubMed
- S. Mathews, R. Ramesh, T. Venkatesan and J. Benedetto, Science, 1997, 276, 238–240 CrossRef CAS PubMed
- S. L. Miller and P. J. Mcwhorter, J. Appl. Phys., 1992, 72, 5999–6010 CrossRef CAS
- Q. Ye, Y. Song, G. Wang, K. Chen, D. Fu, P. Wai, H. Chan, J. Zhu, S. D. Huang and R. Xiong, J. Am. Chem. Soc., 2006, 128, 6554–6555 CrossRef CAS PubMed
- J. F. Scott, Science, 2007, 315, 954–959 CrossRef CAS PubMed
- G. A. Smolenskii, V. A. Bokov, V. A. Isupov, N. N. Krainik, R. E. Pasynkov and A. I. Sokolov, Ferroelectrics and Related Materials, Gordon and Breach Science Publishers, 1987 Search PubMed
- D. L. Staebler, Ferroelectric crystals, Pergamon, 1962 Search PubMed
- L. Chen, Q. Ji, Q. J. Pan, X. X. Cao and G. C. Xu, CrystEngComm, 2017, 19, 5907–5914 RSC
- I. Collings, M. Bykov, E. Bykova, M. Hanfland, S. V. Smaalen, L. Dubrovinsky and N. Dubrovinskaia, CrystEngComm, 2018, 20(25), 3512–3521 RSC
- S. Q. Lu, X. G. Chen, J. X. Gao, Y. Lu, X. N. Hua and W. Q. Liao, CrystEngComm, 2017, 20(4), 454–459 RSC
- Y. Lu, Z. Wang, H. P. Chen and J. Z. Ge, CrystEngComm, 2017, 19(14), 1896–1901 RSC
- R. Mu, G. C. Xu, Y. Y. Zhang, L. Zhang and D. Z. Jia, CrystEngComm, 2017, 19(31), 4629–4633 RSC
- Y. Y. Zhang, J. T. Yu, B. Li, D. J. Li, Z. G. Gu, X. F. Sun, H. L. Cai, G. E. Kostakis and G. Peng, CrystEngComm, 2018, 20, 4582–4589 RSC
- K. Gao, Z. Cui, C. Liu, J. Zhu, H. L. Cai and X. Wu, RSC Adv., 2015, 5, 62647–62651 RSC
- K. Gao, M. Gu, X. Qiu, X. N. Ying, H. Y. Ye, Y. Zhang, J. Sun, X. Meng, F. M. Zhang and D. Wu, J. Mater. Chem. C, 2014, 2, 9957–9963 RSC
- C. Liu, K. Gao, Z. Cui, L. Gao, D. W. Fu, H. L. Cai and X. Wu, J. Phys. Chem. Lett., 2016, 7(10), 1756–1762 CrossRef CAS PubMed
- C. Xu, W. Zhang, L. Gao, X. Gan, X. Sun, Z. Cui, H. L. Cai and X. S. Wu, RSC Adv., 2017, 7, 47933–47937 RSC
- W. Zhang and R. G. Xiong, Chem. Rev., 2012, 112, 1163–1195 CrossRef CAS PubMed
- J. Valasek, Phys. Rev., 1921, 17, 475–481 CrossRef CAS
- L. E. Cross and R. E. Newnham, J. Am. Ceram. Soc., 1986, 11 Search PubMed
- G. Busch and P. Scherrer, Naturwissenschaften, 1935, 23, 737 CrossRef CAS
- S. Horiuchi, Y. Tokunaga, G. Giovannetti, S. Picozzi, H. Itoh, R. Shimano, R. Kumai and Y. Tokura, Nature, 2010, 463, 789 CrossRef CAS PubMed
- D. W. Fu, W. Zhang, H. L. Cai, J. Z. Ge, Y. Zhang and R. G. Xiong, Adv. Mater., 2011, 23, 5658–5662 CrossRef CAS PubMed
- D. W. Fu, H. L. Cai, Y. Liu, Q. Ye, W. Zhang, Y. Zhang, X. Y. Chen, G. Giovannetti, M. Capone and J. Li, Science, 2013, 339, 425–428 CrossRef CAS PubMed
- K. Gao, C. Liu, Z. Cui, J. Zhu, H. L. Cai and X. S. Wu, CrystEngComm, 2015, 17, 2429–2432 RSC
- K. Gao, C. Xu, Z. Cui, C. Liu, L. Gao, C. Li, D. Wu, H. L. Cai and X. S. Wu, Phys. Chem. Chem. Phys., 2016, 18, 7626–7631 RSC
- H. L. Cai, W. Zhang, J. Z. Ge, Y. Zhang, K. Awaga, T. Nakamura and R. G. Xiong, Phys. Rev. Lett., 2011, 107, 147601 CrossRef PubMed
- D. W. Fu, H. L. Cai, S. H. Li, Q. Ye, L. Zhou, W. Zhang, Y. Zhang, F. Deng and R. G. Xiong, Phys. Rev. Lett., 2013, 110, 257601 CrossRef PubMed
- P. Czarnecki, W. Nawrocik, Z. Pajak and J. Wasicki, J. Phys.: Condens. Matter, 1994, 6, 4955 CrossRef CAS
- P. Czarnecki, W. Nawrocik, Z. Pajak and J. Wasicki, Phys. Rev. B: Condens. Matter Mater. Phys., 1994, 49, 1511–1512 CrossRef CAS
- J. Wąsicki, P. Czarnecki, Z. Pająk, W. Nawrocik and W. Szczepański, J. Chem. Phys., 1997, 107, 576–579 CrossRef
- Z. Pająk, P. Czarnecki, J. Wąsicki and W. Nawrocik, J. Chem. Phys., 1998, 109, 6420–6423 CrossRef
- Z. Cui, K. Gao, C. Liu, Y. Yin, D. W. Fu, H. L. Cai and X. S. Wu, J. Phys. Chem. C, 2016, 120 Search PubMed
- B. A. Zakharov, B. A. Kolesov and E. V. Boldyreva, Phys. Chem. Chem. Phys., 2011, 13, 13106–13116 RSC
Footnote |
| † Electronic supplementary information (ESI) available. CCDC 1857985 and 1857987. For ESI and crystallographic data in CIF or other electronic format see DOI: 10.1039/c8ra10031d |
| This journal is © The Royal Society of Chemistry 2019 |