 Open Access Article
Cross-linked poly(ionic liquid) as precursors for nitrogen-doped porous carbons†
Shifu Cheng,
Bihua Chen,
Li Qin,
Yongya Zhang,
Guohua Gao * and
Mingyuan He*
Shanghai Key Laboratory of Green Chemistry and Chemical Processes, School of Chemistry and Molecular Engineering, East China Normal University, 3663, North Zhongshan Road, Shanghai, 200062, China. E-mail: ghgao@chem.ecnu.edu.cn; hemingyuan@126.com
First published on 13th March 2019
Abstract
A soluble and easily dispersive cross-linked poly(ionic liquid), copolymer of 1-vinyl-3-butylimidazolium bromide ([VBIM][Br]) and divinylbenzene (DVB), was used as a precursor for nitrogen doped porous carbons (NPCs) with SiO2 (from tetraethyl orthosilicate) as a template. The NPCs were characterized by infrared (IR) spectroscopy, nitrogen adsorption–desorption, scanning electron microscopy (SEM), transmission electron microscopy (TEM), X-ray diffraction (XRD), Raman spectroscopy, thermo gravimetric analysis (TGA), elemental analysis and X-ray photoelectron spectroscopy (XPS). The specific surface area and porosity of NPCs depended on the carbonization temperature, the SiO2/[VBIM][Br] ratio and the precursors. Under the optimized conditions, the NPC prepared from cross-linked poly(ionic liquid), P([VBIM][Br]–0.1DVB), gave a high specific surface area up to 1324 m2 g−1. XRD indicated that amorphous and disordered graphitic layers were dominant in NPCs. The nitrogen content was about 4–5 wt% in NPCs, and the nitrogen bonding state observed using XPS analysis was mainly pyridinic- and pyrrolic-N. Meanwhile, the cyclic voltammetry, gravimetric charge–discharge curves and electrochemical impedance spectroscopy of the NPCs were also investigated, the specific capacitance was up to 243 F g−1 at 0.1 A g−1, and the retention ratio was nearly 100% after charge–discharge cycling 2400 times at 2 A g−1 in 6 M KOH electrolyte.
Introduction
Nitrogen-doped porous carbons (NPCs) are functionalized materials created by substitutional doping of nitrogen atoms on various carbon materials. NPCs have received a great deal of attention due to their unique properties of specific pore structure, high electron density, basicity, wettability, conductivity and oxidation resistance, and have become one of the most lively research topics in current fundamental and applied materials.1–3 NPCs have been applied in catalysis,4–10 sorption,11–15 lithium-ion battery,16,17 fuel cells18,19 and supercapacitors.20–32Ionic liquids, possessing unique features such as negligible vapor pressure, versatile solubility, high chemical stability, cation–anion adjustable and easy processing, have be applied in many areas.33–36 Dai et al. firstly reported the preparation of NPCs by carbonization of nitrile functionalized ionic liquids using 1-cyanomethyl-3-methylimidazolium ([MCNIm]+) and 1,3-bis(cyanomethyl)imidazolium ([BCNIm]+) in 2009.37 After that, many task-specific ionic liquids containing nitrile groups38–41 have been applied to prepare NPCs with high carbonization yields, high nitrogen content and abundant porous structure. The high yields were attributed to the polymerization of nitrile group in the carbonization process. Carbonization of conventional ionic liquids without any cross-linkable functional groups under N2 atmosphere and ambient pressure affords no carbon yield.40,42 In order to solve this problem, Dai et al. successfully utilized the space confinement of the conventional ionic liquids such as 1-butyl-3-methylimidazolium bis(trifluoromethylsulfonyl)-imide ([BMIm][NTf2]) inside oxide networks (e.g., silica and titania) to prepare NPCs.42 Yuan et al. also applied poly[3-cyanomethyl-1-vinylimidazolium bis(trifluoromethanesulfonyl)-imide] (P[CMVIm][NTf2]) as a precursor for NPCs in which the polymer backbone acted as the material source, while the bulky counter-anion played a role as a molecular template for the porous.43 Subsequently, the same group reported a method for NPCs by carbonization of copolymers of monomeric ionic liquids and divinylbenzene under the CO2 activation.44
In this paper, we would report an one-pot method for fabricated NPCs by carbonization of cross-linked poly(ionic liquid) with SiO2 as template. After SiO2 was etched with HF, NPCs with high specific surface area up to 1324 m2 g−1 and disorder graphitic layers structure were obtained (Fig. 1). These NPCs had high specific electric capacitance amounting to 150–243 F g−1 and the retention ratio was nearly 100% after being charge and discharge 2400 times at a current density of 2 A g−1 in 6 M KOH electrolyte.
Experimental
Materials
1-Vinyl-3-butylimidazolium bromide ([VBIM][Br], 99%) was obtained from Lanzhou Institute of Chemical Physics, Chinese Academy of Sciences. Divinylbenzene (DVB, 55% mixture of isomers) was purchased from Aladdin. 2,2′-Azobis(2-methylpropionitrile) (AIBN, >99%), N,N-dimethylformamide (DMF, >99%) and tetraethyl orthosilicate (TEOS, 97%) were purchased from CHINASUN Specialty Products Co., Ltd. Hydrochloric acid (36%) and hydrofluoric acid (40%) were purchased from Sinopharm Chemical Reagent Co., Ltd. Solvents and other materials were used as received. Nitrogen (N2, 99.99%) and air were provided by Air Liquide.Preparation of cross-linked poly(ionic liquid)
Cross-linked poly(ionic liquid), P([VBIM][Br]–0.1DVB), was synthesized by polymerization of ionic liquid monomer and DVB in DMF. In a typical run, [VBIM][Br] (2.31 g, 10 mmol), DVB (0.26 g, 1.1 mmol), AIBN (0.164 g, 1 mmol) and DMF (15 mL) were loaded into a 100 mL of reactor. The mixture was stirred at 80 °C for 24 h under nitrogen atmosphere. The polymer DMF solution was slowly cooled down to room temperature. The linear PIL, P([VBIM][Br]), was synthesized by polymerization of [VBIM][Br] without any crosslinker.Preparation of NPCs
Typical, TEOS (1.602 g, convert to SiO2/[VBIM][Br] ratio of 0.2) was slowly added to above-mentioned P([VBIM][Br]–0.1DVB) DMF solutions under stirring. Hydrochloric acid (0.4 g) and H2O (2.0 g) were added dropwise, and stirred for 30 min. Then a yellow solution was formed. After removed solvent by distillation, faint yellow transparent monolithic gels were obtained. Carbonization was performed by heating the gels to 800 °C for 1 h at a heating rate of 5 °C min−1 under flowing N2. The carbon–silica composites were cooled down to room temperature, and finely grounded into powders. The powders were dispersed into hydrofluoric acid (6 mL), and stirred overnight. NPC product (0.25 g) was obtained by ultracentrifugation, washed four times with deionized water, and dried under vacuum at 120 °C overnight. Other NPCs with different precursors and carbonization temperatures were prepared by similar methods and denoted as NPCIL-x-y, NPCPIL-x-y and NPCP(IL–DVB)-x-y, where x represented the weight ratio of SiO2 and [VBIM][Br] (SiO2 from TEOS) and y represented carbonization temperature.Characterization methods
1H-NMR spectra were recorded at 400 MHz on Bruker Ascend 400 spectrometer with tetramethylsilane as the internal standard. IR spectra were measured on a SHIMADZU IR Affinity-1S spectrometer. Thermo gravimetric analysis (TGA) experiments were accomplished on a SDTQ600 apparatus at a heating rate of 10 °C min−1 under air, and the results were managed by software of Universal Analysis 2000. Scanning electron microscope (SEM) images were obtained on a ZEISS Gemini 300 operated at 20 kV after sputtering gold on the samples. Transmission electron microscope (TEM) images were obtained with a FEI Titan 3 microscope operated at 200 kV after ultrasonic treatment in ethyl alcohol. XRD-measurements were accomplished on a RIGAKU 2550 instrument. Raman-spectra were obtained using a SHIMADZU LabRAM HR Evolution equipped with a 633 nm laser. Elemental analysis was performed using a Vario EL Elementary. X-ray photoelectron spectroscopy (XPS) measurements were accomplished on a Thermo 250xi device using Al K Alpha radiation source. Nitrogen sorption experiments were performed with a Micromeritics ASAP 2020 at −196 °C. The special surface area was calculated using the BET equation. The pore size distribution was calculated with BJH an HK methods. The pore volume was calculated at P/P0 of 0.999. The samples were degassed at 250 °C for 2 h before measurements.Electrochemical measurements
Electrochemical measurements were performed on an electrochemical analyzer system CHI 633A (Chenhua Instrument Company of Shanghai, China). The electrochemical behaviors of the NPCs-based working electrode (80 wt% NPC, 10 wt% carbon black and 10 wt% polytetrafluoroethylene (PTFE)) were analyzed in 6 M KOH electrolyte in a three-electrode cell. An Hg/HgO electrode and a platinum plate were used as the reference electrode and the counter electrode, respectively. The cyclic voltammetry was performed in the potential range of −0.9 to −0.1 V with a scan rate from 5 to 100 mV s−1. The specific capacitance C (F g−1) was calculated from the gravimetric charge–discharge process according to C = IΔt/ΔV, where I was the constant discharge current density (A g−1), and Δt was the discharging time, which was measured from −0.9 to −0.1 V, and ΔV is the potential change except ohmic drop. The electrochemical impedance spectroscopy tests were carried out in frequency range of 0.01–100 kHz.Results and discussion
Synthesis of cross-linked poly(ionic liquid) and NPCs
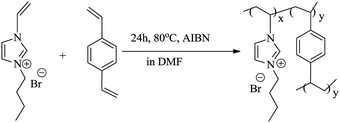
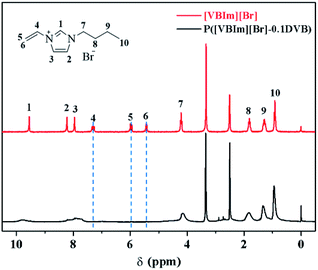
In order to gained NPCs, the carbon precursor, cross-linked poly(ionic liquid) and template must be mixed homogeneously. The soluble and easy-dispersible cross-linked poly(ionic liquid), P([VBIM][Br]–0.1DVB), with lower molar ratio of DVB to ionic liquid monomer was synthesized by the polymerization of [VBIM][Br] and DVB in DMF (Scheme 1).The 1H-NMR spectra of [VBIM][Br] and P([VBIM][Br]–0.1DVB) were listed in Fig. 2. The signals around 5.5–7.4 ppm corresponding to vinyl group were nearly disappeared in P([VBIM][Br]–0.1DVB), indicating the full polymerization of ionic monomer.
The faint yellow transparent complex gels of P([VBIM][Br]–0.1DVB)–SiO2 (see Fig. S1a in the ESI†) were obtained by addition of TEOS dropwise to poly(ionic liquid) DMF solution and subsequent hydrolysis with acid. The complex gels and corresponding carbonization products at different temperature were characterized by IR spectra (see Fig. 3). When the carbonization temperature was below 400 °C, the adsorption peaks of the sample around 1163 cm−1 assigned to C–N stretching vibration of imidazolium ring, 1552 cm−1 assigned to imidazolium ring skeleton45,46 were observed, indicating the imidazolium in poly(ionic liquid) was stable. However, when the carbonization temperature increased to 500 °C, the intensities of the peaks at 2856–2960 cm−1 assigned to C–H stretching vibration on the alkyl groups decreased dramatically and almost disappeared at the carbonization temperature of 600 °C, indicating the degradation of alkyl groups from imidazolium ring.40 In the meanwhile, the intensities of the characteristic peaks around 1552 and 1163 cm−1 decreased concomitantly, indicating the reconstruction of imidazolium ring into carbon occurred. When the carbonization temperature were above 700 °C, there were no any peaks assigned to P([VBIM][Br]–0.1DVB) (see Fig. 3b). In the meanwhile, the adsorption peaks related to SiO2, 3431 cm−1 of –OH asymmetric stretching vibration, 1074 cm−1 of Si–O–Si asymmetric stretching vibration, 798 cm−1 and 448 cm−1 of Si–O symmetry stretching vibration were observed.47 All these results indicated that the starting carbonization temperature was 500 °C, and the optimized carbonization temperature was above 700 °C. The IR spectra of eight NPCs from different carbonization temperatures (see Fig. S2 in ESI†) also gave the similar results.
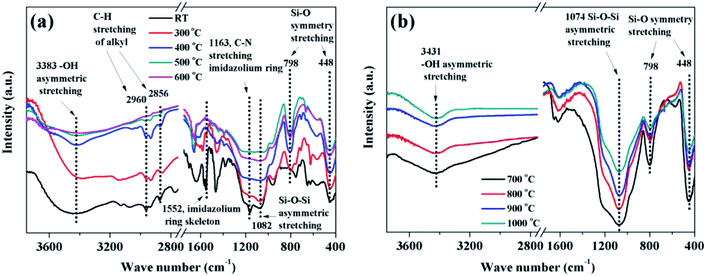 | ||
| Fig. 3 IR spectra of complex P([VBIM][Br]–0.1DVB)–SiO2 carbonization at (a) RT-600 °C and (b) 700–1000 °C. | ||
Characterization of NPCs
After the complex of NPC–SiO2 etched by HF (Fig. 1), black metal luster NPCs (see Fig. S1b in the ESI†) were obtained. The relationship between surface area and the carbonization temperature, the ratios of SiO2/[VBIM][Br] and the precursor types of NPCs were summarized in Table 1. Carbonization temperature was irreplaceable factor to the microstructure of NPCs from imidazolium-based ionic liquid.38,40,48 When the carbonization temperature was 500 °C, the surface area (27 m2 g−1) and the total pore volume (0.04 cm3 g−1) of NPCP(IL–DVB)-0.2-500 were low (Table 1, entry 1), indicating the incomplete carbonization. With the increase of carbonization temperature to 600 °C, the surface area (1121 m2 g−1) and the total pore volume (0.98 cm3 g−1) of NPCP(IL–DVB)-0.2-600 increased dramatically. The surface area and total pore volume were slight increase with temperature increasing from 700 to 900 °C. The surface area (1324 m2 g−1) and total pore volume (1.41 cm3 g−1) of NPCP(IL–DVB)-0.2-900 were maximum in the series of samples. When carbonization temperature increased to 1000 °C, the surface area (1257 m2 g−1) and total pore volume (1.31 cm3 g−1) of NPCP(IL–DVB)-0.2-1000 decreased slightly on the contrary. The average pore size was about 4.2 nm. These results showed the suitable carbonization temperature was 700–900 °C. N2 adsorption and desorption isotherms and pore size distribution of NPCs were also listed in Fig. S3a and c in the ESI.† With carbonization temperature increasing from 500 to 1000 °C, the adsorbing capacity was increasing obviously and the “hysteresis loop” was more obvious at relative pressure from 0.45 to 0.9 due to abundant micropores and mesopores. There were nearly no pores at the carbonization temperature of 500 °C. However, the pores centered at 0.7–0.9 nm and 2–4 nm were observed when carbonization temperature was reached to 600 °C, and there were some distribution at 5–20 nm.| Entry | Samples | Ta (°C) | SBET (m2 g−1) | Vt (cm3 g−1) | Average pore size (nm) |
|---|---|---|---|---|---|
| a Carbonization temperature. | |||||
| 1 | NPCP(IL–DVB)-0.2-500 | 500 | 27 | 0.04 | 6.15 |
| 2 | NPCP(IL–DVB)-0.2-600 | 600 | 1121 | 0.98 | 3.49 |
| 3 | NPCP(IL–DVB)-0.2-700 | 700 | 1257 | 1.37 | 4.36 |
| 4 | NPCP(IL–DVB)-0.2-800 | 800 | 1297 | 1.33 | 4.11 |
| 5 | NPCP(IL–DVB)-0.2-900 | 900 | 1324 | 1.41 | 4.25 |
| 6 | NPCP(IL–DVB)-0.2-1000 | 1000 | 1257 | 1.31 | 4.16 |
| 7 | NPCP(IL–DVB)-0.05-800 | 800 | 720 | 0.38 | 2.13 |
| 8 | NPCP(IL–DVB)-0.1-800 | 800 | 1006 | 0.62 | 2.35 |
| 9 | NPCP(IL–DVB)-0.3-800 | 800 | 1330 | 1.18 | 3.56 |
| 10 | NPCP(IL–DVB)-0.4-800 | 800 | 1285 | 0.93 | 2.89 |
| 11 | NPCP(IL–DVB)-0.5-800 | 800 | 1088 | 0.68 | 2.50 |
| 12 | NPCIL-0.2-800 | 800 | 832 | 0.52 | 2.48 |
| 13 | NPCPIL-0.2-800 | 800 | 932 | 0.65 | 2.78 |
Further study was focused on the relationship between surface area and porosity of NPCs and the ratios of SiO2 and [VBIM][Br] (Table 1, entry 4 and 7–9, Fig. S3b and d†). With the ratio increasing from 0.05 to 0.3, the surface area of NPCs increased from 720 to 1330 m2 g−1. The increase of surface area was due to more space released deriving from SiO2. In contrast, the total pore volume decreased from 1.33 to 1.18 cm3 g−1, when the ratio increased from 0.2 to 0.3. With further increase of the ratio to 0.4 and 0.5, the surface area and average pore size decreased on the contrary (Table 1, entry 10 and 11). This was possibly attributed to the collapse of large pore produced by excessive SiO2 in the etching process. The surface areas of NPCs from monomer IL ([VBIM][Br], 832 m2 g−1) and linear PIL (P([VBIM][Br]), 932 m2 g−1) were relatively low (Table 1, entry 12 and 13), comparing with the NPC from cross-linked poly ionic liquid (NPCP(IL–DVB)-0.2-800) (Table 1, entry 4). The cross-linked copolymer of [VBIM][Br] and DVB may form “framework intermediates” in carbonization, sequentially caused more pores.
The surface microstructure of NPCs from different carbonization temperature 500–1000 °C was visualized by scanning electron microscope (see Fig. 4). From Fig. 4a–f, the NPCs were composed of “cauli-flower” head which were agglomerated by around 20–50 nm spherules. When the carbonization temperature was 500 °C, there were scarcely any splits or cavity on NPCP(IL–DVB)-0.2-500 surface. With the increase of carbonization temperature to 600 °C, there were abundant splits, mesopores and macropores. Elevating carbonization temperature from 600 to 1000 °C, the surface microstructure has not obviously changed. The results indicated that the porosity of NPCs was influenced by carbonization temperature, which was consistent with the results obtained by nitrogen adsorption–desorption experiments.
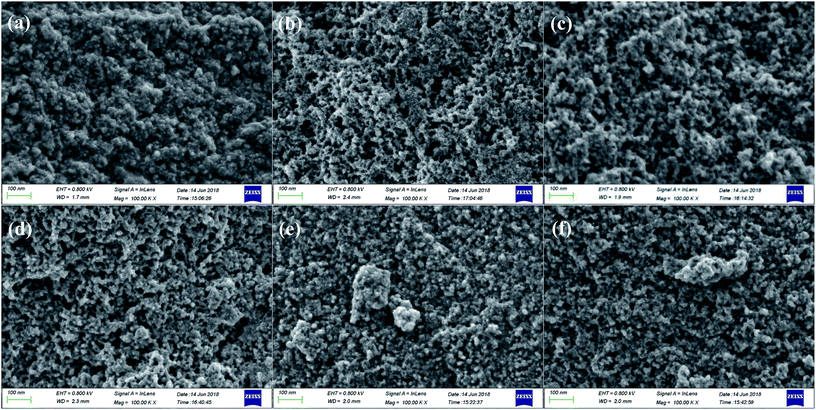 | ||
| Fig. 4 SEM of NPCs from different carbonization temperature: (a) 500 °C, (b) 600 °C, (c) 700 °C, (d) 800 °C, (e) 900 °C, (f) 1000 °C. | ||
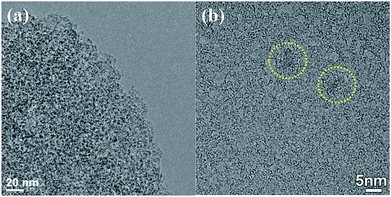
The images of TEM and HR-TEM of NPCP(IL–DVB)-0.2-800 were showed in Fig. 5. From TEM image, abundant pores with the size of 2–4 nm were observed (Fig. 5a). The HR-TEM image of NPCP(IL–DVB)-0.2-800 found that the most graphitic layers in NPC were bent and disordered, and only in two small areas found orderly graphitic layers (in yellow circle) (Fig. 5b). These results were similar with nitrogen doped carbon materials by J. P. Paraknowitsch using ionic liquids [EMIM][dca] and [MBP][dca] as precursors.38,40
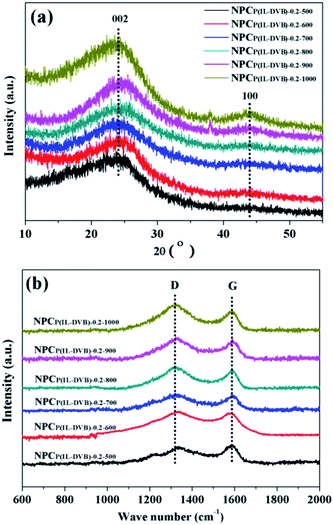
XRD and Raman spectra were employed to further investigate the crystallite structure of NPCs. Fig. 6a showed all NPC samples from different carbonization temperature possess broad stacking peaks at 24.2° and 43.4°, which related to graphite (002) and (100) plane, demonstrated the amorphous characteristics of all NPC samples.31 The degree of graphitization of NPCs can be easily followed by Raman-spectroscopy. All samples revealed two characteristic peaks at about 1318 and 1588 cm−1, which were attributed to typical D- and G-band (see Fig. 6b). The level of disordered structure was related to D-band, whereas G-band was reveal the degree of graphitization.49,50 The intensity of the D-bands was higher than that of the G-bands in all NPC samples (concrete dates see Fig. S4 in ESI†). These results indicated that the disordered structure was dominant in NPCs. The similar results were also reported by J. P. Paraknowitsch on the polycondensation of ionic liquid [EMIM][dca] towards nitrogen doped carbon materials.38,40
The oxidation resistance and heat resistance were important merits of NPCs.1–3 The oxidation resistance of NPCs from different carbonization temperature was investigated by TGA under 100 mL min−1 air flow. From Fig. 7a, all six NPC samples had a 3–7% weight loss from room temperature to 100 °C, which came from NPCs surface absorbed water. From 100 to 400 °C, there were not evident weight changes of all NPCs, showed preferable stability. All six NPC samples loss weight rapidly about 450 to 600 °C because of the burning, and the weight was decline to “zero” about 700 °C. In order to investigate the differences in detail, the weight loss start temperature and the loss fastest temperature through tangent line method with software of Universal Analysis 2000 were listed in Fig. 7b. The loss start temperature of NPCP(IL–DVB)-0.2-500 was 480 °C, and the loss fastest temperature was 534 °C. With the carbonization temperature increasing, the start temperature and loss fastest temperature increased and reached to 575 and 624 °C at the carbonization temperature of 1000 °C. These results indicated that the oxidation resistance and heat resistance were improved with the increase of carbonization temperature.
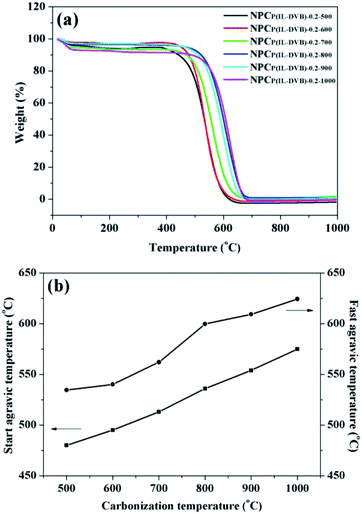 | ||
| Fig. 7 (a) TG curves and (b) loss start and fastest agravic temperature under air of NPCs from different carbonization temperature. | ||
The elemental components of NPCs were obtained by chemical analysis (Fig. 8). With the increase of carbonization temperature from 500 to 1000 °C, the carbon content was increasing and hydrogen content was decreasing. Meanwhile, nitrogen content was firstly increasing and then decreasing slowly. The unceasingly degradation of alkyl groups from incomplete carbonization NPCs (see IR spectra in Fig. 3a) at temperature of 500–700 °C, led to dropping of H content, whereas increasing of C and N contents. Above 700 °C, it was possibly the continuation of carbonization and the slight decomposition of N doped heterocyclic ring in graphitic layers, resulted in the increasing of C content and the decreasing of H and N content.23,40,48,51
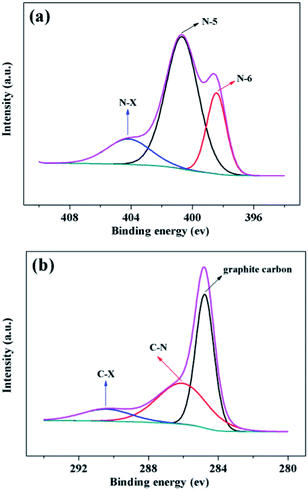
The bonding environment of nitrogen and carbon atoms can be probed by XPS spectra.21–23,40 High-resolution N1s spectra of NPCP(IL–DVB)-0.2-800 were fitted into three individual subpeaks located at 398.43, 400.68 and 404.16 eV, in accordance with pyridinic- (N-6), pyrrolic- (N-5) and oxidized-N (N-X), respectively (see Fig. 9a). According to the intensity of the subpeaks, the amount of different nitrogen bonding state was N-5 > N-6 > N-X. The bonding structures of the nitrogen revealed in the N1s-XPS spectra were further supported by respective results of the C1s spectra (see Fig. 9b), which exhibiting graphite-like carbon (284.78 eV), the nitrogen binding carbon (C–N, 286.07 eV), and a weakly peak at 290.42 eV may be oxidized form carbon (C-X).40,52 All N1s and C1s spectra of NPCs from different carbonization temperature were showed in Fig. S5 and S6 (see the ESI†).
Electrochemical properties of NPCs
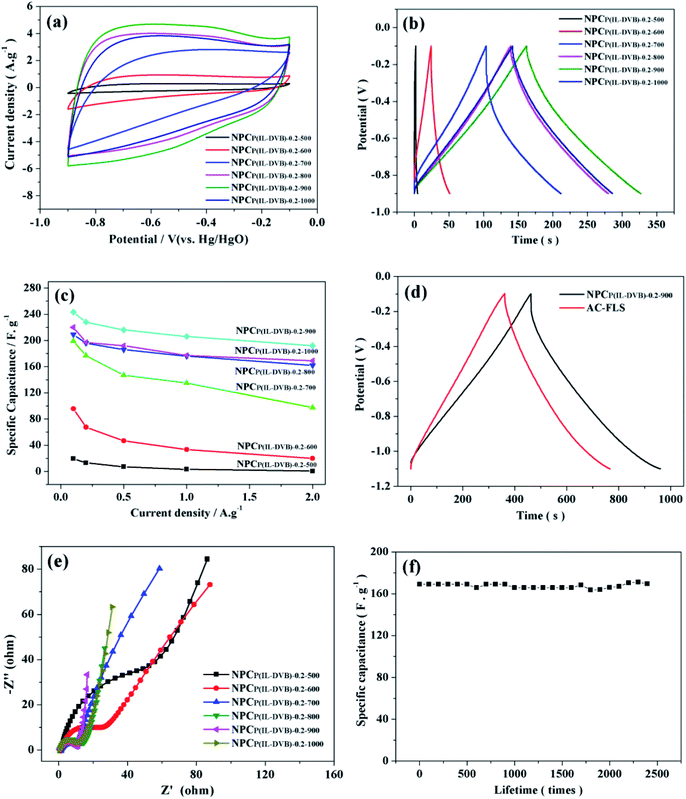
The electrochemical properties of NPCs were evaluated through cyclic voltammetry (CV), galvanostatic charge–discharge (GCD) and electrochemical impedance spectroscopy (EIS). CV was usually employed to evaluate the potential possibility of materials used for supercapacitor. The CV curves of NPCs at scan rate of 20 mV s−1 were listed in Fig. 10a. The curves of NPCP(IL–DVB)-0.20-500, NPCP(IL–DVB)-0.20-600 and NPCP(IL–DVB)-0.20-700 presented “rugby-like” shape and the accordingly enclosed area were narrow. Meanwhile, the CV curves of NPCs carbonization above 800 °C were “box-like” shape and lenient, especially, NPCP(IL–DVB)-0.20-900 performed larger enclosed area, which meant having a certain potential as electrode materials for supercapacitor. The GCD curves of NPCs at 1.0 A g−1 current density were showed in Fig. 10b. All curves presented “isosceles triangle-like” shape, and had no obvious “drop” at discharge process. Particularly, NPCP(IL–DVB)-0.2-900 performed longer charge–discharge time, meant higher specific capacitance. Fig. 10c showed the specific capacitance of NPCs at different current density. As the carbonization temperature increased, the specific capacitance of NPCs was improving and the rate capability was also promoting. Especially, NPCP(IL–DVB)-0.2-900 displayed better electrochemical property. The specific capacitances were up to 243 F g−1 at 0.1 A g−1, and 192 F g−1 at 2.0 A g−1, revealing a better rate capability. As comparison, a commercialized activated carbon FLS with BET surface area of 1845 m2 g−1 and total pore volume of 0.99 cm3 g−1 was used as a reference. The GCD curves at current density of 0.5 A g−1 (potential range of −1.1 to −0.1 V) were shown in Fig. 10d. Either NPCP(IL–DVB)-0.2-900 or FLS presented a linear GCD curve without obvious ohmic drop, indicating that both of them possess a good capacitive behavior under this current density. However, the specific capacitance of NPCP(IL–DVB)-0.2-900 reached 248 F g−1 (calculated from the gravimetric discharge process according to C = IΔt/ΔV) in this condition, larger than that of the FLS (202 F g−1). The EIS curves were also measured, Fig. 10e showed the Nyquist plots collected in the frequency range of 0.01–10 kHz. It was found that the slope curves of six samples in low frequency region were enhancing with NPCs the increase of carbonization temperature. NPCP(IL–DVB)-0.2-900 was near to 90°, indicating lower resistance in charge transfer and ion diffusion processes of supercapacitors. It was also found that the semicircular diameters of the high-frequency portions of the six impedance curves decreased with the carbonization temperature increasing, indicating the Rs decreasing and electrical conductivity increasing.25–28 NPCP(IL–DVB)-0.2-900 performed good electrochemical property that may be caused by the higher specific surface area, suitable pore size distribution53–55 and suitable N content.20–26In order to satisfy commercial application, especially in electric vehicle industry, quick charge–discharge and long cycle life demand of supercapacitor is impending.21 It was important to investigate the specific capacitance under high current density and retention rate at long cycle charge–discharge. The cycle life of charge–discharge at 2 A g−1 was also tested (see Fig. 10f), the specific capacitance of NPCP(IL–DVB)-0.2-1000 maintained around 169 F g−1 (the retention rate was nearly 100%) with no recession through 2400 times recycle. Such characteristic proved that pseudocapacitance effect introduced by nitrogen was stable with cycling, although the nitrogen content was lower than NPC from other ionic liquids.38–43 We speculate NPCs of this report will have excellent performance in acidic electrolytes.20 There will be good application prospect of NPCs in supercapacitor electrode materials.
Conclusions
A kind of nitrogen-doped porous carbon materials with 4–5% nitrogen content and abundant pores, have successfully been prepared by carbonization of cross-linked poly(ionic liquid) with SiO2 template under nitrogen atmosphere above 600 °C. The BET specific surface area of corresponding NPCs under the optimized condition can be up to 1324 m2 g−1, and total pore volume was 1.41 cm3 g−1. The graphitic layers in NPCs were amorphous and disordered, and the nitrogen bonding states were mainly pyrrolic- and pyridinic-N. The NPCs presented high specific capacitance (up to 243 F g−1), and excellent rate capability as the electrode material for supercapacitor, in galvanostatic charge–discharge process over a wide current density range in 6 M KOH electrolyte. The retention rate of specific capacitance was nearly 100% at 2 A g−1 through 2400 times recycle. We expect that NPCs of this report will have excellent performance in acidic electrolyte and a good application prospect in supercapacitor electrode materials.Conflicts of interest
There are no conflicts to declare.Acknowledgements
We thank the National Key Research and Development Program of China (2017YFA0403102), the National Natural Science Foundation of China (21573072, 21773068, 21811530273), and Shanghai Leading Academic Discipline Project (B409) for financial support.References
- Y. Zhai, Y. Dou, D. Zhao, P. Fulvio, R. T. Mayes and S. Dai, Adv. Mater., 2011, 23, 4828–4850 CrossRef CAS PubMed
.
- M. Li, F. Xu, H. Li and Y. Wang, Catal. Sci. Technol., 2016, 6, 3670–3693 RSC
.
- M. Inagaki, M. Toyoda, Y. Soneda and T. Morishita, Carbon, 2018, 132, 104–140 CrossRef CAS
.
- C. Pan, L. Qiu, Y. Peng and F. Yan, J. Mater. Chem., 2012, 22, 13578–13584 RSC
.
- T.-P. Fellinger, F. Hasché, P. Strasser and M. Antonietti, J. Am. Chem. Soc., 2012, 134, 4072–4075 CrossRef CAS PubMed
.
- Y. Liu, Y. Zhang, C. Zhai, X. Li and L. Mao, Mater. Lett., 2016, 166, 16–18 CrossRef
.
- J. Gao, N. Ma, Y. Zheng, J. Zhang, J. Gui, C. Guo, H. An, X. Tan, Z. Yin and D. Ma, ChemCatChem, 2017, 9, 1601–1609 CrossRef CAS
.
- X. Zhou, Y. Gao, S. Deng, S. Cheng, S. Zhang, H. Hu, G. Zhuang, X. Zhong and J. Wang, Ind. Eng. Chem. Res., 2017, 56, 11100–11110 CrossRef CAS
.
- J. Gao, C. He, J. Liu, P. Ren, H. Lu, J. Feng, Z. Zou, Z. Yin, X. Wen and X. Tan, Catal. Sci. Technol., 2018, 8, 1142–1150 RSC
.
- N. Zdolsěk, A. Dimitrijević, M. Bendová, J. Krstić, R. P. Rocha, J. L. Figueiredo, D. Bajuk-Bogdanović, T. Trtić-Petrović and B. Šljukić, ChemElectroChem, 2018, 5, 1037–1046 CrossRef
.
- P. F. Fulvio, J. S. Lee, R. T. Mayes, X. Wang, S. M. Mahurin and S. Dai, Phys. Chem. Chem. Phys., 2011, 13, 13486–13491 RSC
.
- L. Zhang, K. Cai, F. Zhang and Q. Yue, Chem. Res. Chin. Univ., 2015, 31, 130–137 CrossRef CAS
.
- J. Gong, H. Lin, M. Antonietti and J. Yuan, J. Mater. Chem. A, 2016, 4, 7313–7321 RSC
.
- J. Gong, M. Antonietti and J. Yuan, Angew. Chem., Int. Ed., 2017, 56, 7557–7563 CrossRef CAS PubMed
.
- M. Sarker, H. J. An, D. K. Yoo and S. H. Jhung, Chem. Eng. J., 2018, 338, 107–116 CrossRef CAS
.
- L. Zhao, Y. S. Hu, H. Li, Z. Wang and L. Chen, Adv. Mater., 2011, 23, 1385–1388 CrossRef CAS PubMed
.
- J. Balach, H. Wu, F. Polzer, H. Kirmse, Q. Zhao, Z. Wei and J. Yuan, RSC Adv., 2013, 3, 7979–7986 RSC
.
- Y. Shao, J. Sui, G. Yin and Y. Gao, Appl. Catal., B, 2008, 79, 89–99 CrossRef CAS
.
- F. Hasche, T.-P. Fellinger, M. Oezaslan, J. P. Paraknowitsch, M. Antonietti and P. Strasser, ChemCatChem, 2012, 4, 479–483 CrossRef CAS
.
- G. Lota, B. Grzyb, H. Machnikowska, J. Machnikowski and E. Frackowiak, Chem. Phys. Lett., 2005, 404, 53–58 CrossRef CAS
.
- W. Li, D. Chen, Z. Li, Y. Shi, Y. Wan, J. Huang, J. Yang, D. Zhao and Z. Jiang, Electrochem. Commun., 2007, 9, 569–573 CrossRef CAS
.
- L. Sun, H. Zhou, L. Li, Y. Yao, H. Qu, C. Zhang, S. Liu and Y. Zhou, ACS Appl. Mater. Interfaces, 2017, 9, 26088–26095 CrossRef CAS PubMed
.
- W. Tian, H. Zhang, H. Sun, M. O. Tade and S. Wang, Carbon, 2017, 118, 98–105 CrossRef CAS
.
- F. Zeng, Z. Li, X. Li, J. Wang, Z. Kong, Y. Sun, Z. Liu and H. Feng, Appl. Surf. Sci., 2019, 467, 229–235 CrossRef
.
- D. Tang, Y. Luo, W. Lei, Q. Xiang, W. Ren, W. Song, K. Chen and J. Sun, Appl. Surf. Sci., 2018, 462, 862–871 CrossRef CAS
.
- L. Shi, L. Jin, Z. Meng, Y. Sun, C. Li and Y. Shen, RSC Adv., 2018, 8, 39937–39947 RSC
.
- K. Krukiewicz, M. Krzywiecki, M. J. P. Biggs and D. Janas, RSC Adv., 2018, 8, 30600–30609 RSC
.
- Y. LV, Y. Zhou, Z. Shao, J. Wei, L. Li and Y. Wang, RSC Adv., 2018, 8, 28944–28952 RSC
.
- T. Liu, C. Jiang, W. You and J. Yu, J. Mater. Chem. A, 2017, 5, 8635–8643 RSC
.
- L. Winkless, Mater. Today, 2016, 19, 422 Search PubMed
.
- V. Veeramani, M. Sivakumar, S. Chen, R. Madhu, H. R. Alamri, Z. A. Alothman, M. S. A. Hossain, C. Chen, Y. Yamauchi, N. Miyamoto and K. C.-W. Wu, RSC Adv., 2017, 7, 45668–45675 RSC
.
- Z. Chen, S. Ye, S. D. Evans, Y. Ge, Z. Zhu, Y. Tu and X. Yang, Small, 2018, 14, 1704015–1704023 CrossRef PubMed
.
- P. Wasserscheid and W. Keim, Angew. Chem., Int. Ed., 2000, 39, 3773–3789 CrossRef
.
- J. Lu, F. Yan and J. Texter, Prog. Polym. Sci., 2009, 34, 431–448 CrossRef CAS
.
- J. Yuan and M. Antonietti, Polymer, 2011, 52, 1469–1482 CrossRef CAS
.
- T.-P. Fellinger, A. Thomas, J. Yuan and M. Antonietti, Adv. Mater., 2013, 25, 5838–5855 CrossRef CAS PubMed
.
- J. S. Lee, X. Wang, H. Luo, G. A. Baker and S. Dai, J. Am. Chem. Soc., 2009, 131, 4596–4597 CrossRef CAS PubMed
.
- J. P. Paraknowitsch, J. Zhang, D. S. Su, A. Thomas and M. Antonietti, Adv. Mater., 2010, 22, 87–92 CrossRef CAS PubMed
.
- J. S. Lee, X. Wang, H. Luo and S. Dai, Adv. Mater., 2010, 22, 1004–1007 CrossRef CAS PubMed
.
- J. P. Paraknowitsch, A. Thomas and M. Antonietti, J. Mater. Chem., 2010, 20, 6746–6758 RSC
.
- N. Fechler, T.-P. Fellinger and M. Antonietti, Adv. Mater., 2013, 25, 75–79 CrossRef CAS PubMed
.
- X. Wang and S. Dai, Angew. Chem., Int. Ed., 2010, 49, 6664–6668 CrossRef CAS PubMed
.
- Q. Zhao, T.-P. Fellinger, M. Antonietti and J. Yuan, J. Mater. Chem. A, 2013, 1, 5113–5120 RSC
.
- D. Kuzmicz, P. Coupillaud, Y. Men, J. Vignolle, G. Vendraminetto, M. Ambrogi, D. Taton and J. Yuan, Polymer, 2014, 55, 3423–3430 CrossRef CAS
.
- H. Zhou, J. Song, X. Kang, J. Hu, Y. Yang, H. Fan, Q. Meng and B. Han, RSC Adv., 2015, 5, 15267–15273 RSC
.
- Y. Zhang, B. Wang, E. H. M. Elageed, L. Qin, B. Ni, X. Liu and G. Gao, ACS Macro Lett., 2016, 5, 435–438 CrossRef CAS
.
- S. E. Zakiyan, M. H. N. Famili and M. Ako, J. Mater. Sci., 2014, 49, 6225–6239 CrossRef CAS
.
- J. P. Paraknowitsch and A. Thomas, Macromol. Chem. Phys., 2012, 213, 1132–1145 CrossRef CAS
.
- A. C. Ferrari and J. Robertson, Phys. Rev. B: Condens. Matter Mater. Phys., 2000, 61, 14095–14107 CrossRef CAS
.
- S. Reich and C. Thomsen, Philos. Trans. R. Soc., A, 2004, 362, 2271–2288 CrossRef CAS PubMed
.
- M. Kodamaa, J. Yamashita, Y. Soneda, H. Hatori, S. Nishimura and K. Kamegawa, Mater. Sci. Eng., B, 2004, 108, 156–161 CrossRef
.
- C. Silien, M. Buck, G. Goretzki, D. Lahaye, N. R. Champness, T. Weidner and M. Zharnikov, Langmuir, 2009, 25, 959–967 CrossRef CAS PubMed
.
- S. Yoon, J. W. Lee, T. Hyeon and S. M. Oh, J. Electrochem. Soc., 2000, 147, 2507–2512 CrossRef CAS
.
- E. Frackowiak and F. Beguin, Carbon, 2001, 39, 937–950 CrossRef CAS
.
- A. G. Pandolfo and A. F. Hollenkamp, J. Power Sources, 2006, 157, 11–27 CrossRef CAS
.
Footnote |
| † Electronic supplementary information (ESI) available. See DOI: 10.1039/c8ra10022e |
| This journal is © The Royal Society of Chemistry 2019 |


