DOI:
10.1039/C8RA09281H
(Paper)
RSC Adv., 2019,
9, 8146-8158
Morphology and crystallization behavior of poly(3-hydroxybutyrate-co-3-hydroxyvalerate)/polyhedral oligomeric silsesquioxane hybrids
Received
10th November 2018
, Accepted 1st March 2019
First published on 12th March 2019
Abstract
Poly(3-hydroxybutyrate-co-3-hydroxyvalerate)/polyhedral oligomeric silsesquioxane (PHBV/POSS) hybrids with different POSS contents of 5, 10, 15, 20, 25 and 30 wt% were prepared by solution casting. The composition, crystallization and melting behavior, crystal structure, spherulite morphology, surface morphology, and tensile properties of PHBV/POSS hybrids were characterized by EDS, DSC, FTIR, XRD, HSPOM, AFM and a tensile testing machine. The results showed that POSS was well dispersed in the PHBV matrix. PHBV and POSS crystals coexisted in the hybrids. The crystallinity of pure PHBV was larger than that of PHBV/POSS hybrids. POSS restricted the crystallization of PHBV in PHBV/POSS hybrids. With the increase of POSS content, the crystallinity of PHBV/POSS hybrids decreased from 56.8 (pure PHBV) to 33.6% (PHBV/POSS hybrid with 30 wt%). However, the introduction of POSS did not affect the spherulite morphology of PHBV. The Avrami equation was used to describe the isothermal crystallization kinetics of PHBV/POSS hybrids. The results showed that as the crystallization temperature increased, the crystallization rate became slow. In addition, POSS can improve the tensile properties of PHBV.
Introduction
Poly(3-hydroxybutyrate-co-3-hydroxyvalerate) (PHBV) is a polyhydroxyalkanoate (PHA). PHAs are a family of natural biodegradable polyesters that are synthesized by microorganisms.1,2 PHBV is biocompatible and degradable.3 However, PHBV has some disadvantages in that it is rigid and brittle.4,5 The main reason is that PHBV has high crystallinity, large spherulites and cracks in the spherulites. The degree of crystallinity and mechanical properties of PHBV materials depend on its crystallization behavior. Thus, it is particularly important to control the crystallization behavior of PHBV. To solve pivotal problems, various approaches have been used to change the crystallization behavior of PHBV.
Physical blending is often used to modify PHBV. Firstly, staple fibers have been used to blend with PHBV. For example, Avella M. et al.6 have investigated the thermal and mechanical behavior of PHBV reinforced with wheat straw fibers. The addition of straw fibers has been found to increase the crystallization rate of PHBV, while it does not affect the crystallinity content. Secondly, blending PHBV with polymers such as poly (ethylene glycol) (PEG), poly(ε-caprolactone) (PCL), poly (L-lactide acid) (PLLA), poly (ethylene oxide) (PEO) is becoming more and more widely studied.7–10 The defect of PHBV is improved to some extent by the introduction of another polymer. Thirdly, inorganic fillers such as talc and BN have been added to PHBV to change crystallization behavior and improve the mechanical properties. For example, both BN and talc have good nucleating ability in the crystallization of PHBV. BN acts as a nucleating agent itself and initiates nucleation in the crystallization of PHBV. Talc acts in a different way. It reacts as a chemical reagent. The addition of these nucleating agents caused an increase in the overall crystallization rate of PHBV.11 In addition, inorganic fillers can improve the mechanical properties. However, it is difficult for inorganic fillers to disperse uniformly in polymer matrix.
Fortunately, polyhedral oligomeric silsesquioxane (POSS) can overcome the above drawbacks of inorganic fillers. POSS can be reconsidered as organic–inorganic hybrid materials at a molecular level. A typical POSS molecule possesses a cubic rigid (T8) structure represented by the formula R8Si8O12, where the central inorganic core (Si8O12) is functionalized with organic moieties (R) at each of the eight vertices.12–15 The rigid silica cube shows significantly good mechanical properties, high thermal and chemical stability, which can enhance mechanical, thermal and chemical properties of polymers. The eight organic corner spheres can make it disperse uniformly in polymer matrix. For example, POSS is often used to improve the mechanical and thermal properties of PLA.16–18 However, few efforts have been done to modify PHBV by blending POSS expect that Seydibeyoğlu M. et al.19 improved PHBV by blending functionalized vegetable oils and POSS. The addition of POSS to the PHBV-oil system, the melting temperature of PHBV was reduced more than 10 °C, increasing the processability of PHBV.
In this work, it is expected to change the crystallization behavior and mechanical properties of PHBV by addition of a new POSS. Avrami equation is used to describe isothermal crystallization kinetics of PHBV/POSS hybrids. At the same time, the dispersion, chemical structure, crystal structure, the morphologies of spherulites of PHBV/POSS hybrids are explored.
Experimental
Materials
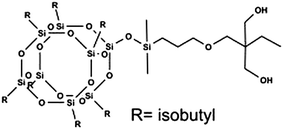
PHBV (Mw = 2.6 × 10⁵ g mol−1) containing 2.0 mol% hydrovalerate (HV) was produced by Tianan Biologic Material Co. Ltd., Ningbo, China. TMP Diollsobutyl-POSS was produced from Hybrid Plastics Co. Ltd. The chemical structure of POSS was described in Fig. 1. Chloroform was purchased from Guoyao Group Chemical Reagent Co. Ltd., Shanghai, China. Ethanol (>99.7%) was obtained from Shanghai Titan Scientific Co. Ltd., Shanghai, China.
 |
| | Fig. 1 The chemical structure of TMP Diollsobutyl-POSS. | |
Sample preparation
PHBV was purified and filtered by dissolution in chloroform and precipitated in 99.7% ethanol. PHBV/POSS hybrids with different POSS content of 5, 10, 15, 20, 25 and 30 wt% were prepared by solution casting. PHBV/POSS film was obtained after chloroform was evaporated naturally. Then PHBV/POSS film was floated in water and dried.
Energy dispersive X-ray spectroscopy (EDS)
Energy dispersive X-ray spectroscopy (EDS) measurements were carried out with SU1510 (Hitachi, Japan) and EDAX Octane EDS-30 (China). The morphologies of samples were observed under a working voltage of 20 kV. The distribution of Si element was characterized by X-ray spectroscopy.
Fourier transform infrared spectroscopy (FTIR)
Attenuated total reflection fourier transform infrared spectra (4000–500 cm−1) of the samples were tested by Nicolet iS10 FTIR. Each spectrum was recorded with a total of 16 scans and a resolution of 4 cm−1 at room temperature.
X-ray diffraction (XRD)
Crystal structures of the samples were detected by Bruker D2 diffraction system with Cu Kα radiation source at a voltage of 40 kV and a current of 40 mA. Scans were run from a 2θ value of 5 to 60° at a scan speed of 0.02° steps.
Differential scanning calorimeter (DSC)
The melting and crystallization behaviors of the samples were determined by DSC (Q200, USA) with nitrogen as purging gas. In and Pb were used for calibration. The weight of the samples was in the range of 4–6 mg. Samples were heated from 0 to 200 °C (10 °C min−1), kept at that temperature for 3 min to erase thermal history, followed by cooling to 0 °C, and then reheated to 200 °C at 10 °C min−1. The isothermal crystallization kinetics of the samples were also studied by DSC Q200. Samples were kept at 200 °C for 3 min, and quickly cooled to isothermal crystallization temperature (Tc). The relationship between heat flow and time was recorded.
Hot-stage polarized microscope (HSPOM)
Crystal morphologies of the samples were characterized by Leica DM2700P, which was equipped with LINKAM TMS420 hot stage and a CCD camera. PHBV/POSS hybrids were melted at 200 °C for 3 min and then quickly cooled to 50 °C for isothermal crystallization.
Static contact angles
Static water contact angles of PHBV/POSS hybrids were observed by DSA25 contact angle instrument (KRUSS Co., Germany) with test software called Advance. PHBV/POSS hybrids were placed on the console for static water contact angle tests. The droplet size was 2 μL. The injection speed was 0.16 mL min−1, and the method of measurement was Young equation.
Atomic force microscope (AFM)
Surface characteristics of PHBV/POSS hybrids were analyzed by Multimode 8 (Bruker Co., Germany). AFM was used that combines microfabricated cantilevers with a described optical lever system to monitor deflection.
Tensile property of PHBV/POSS hybrids
Tensile properties of PHBV/POSS hybrids were studied by a Shimadzu EZ-LX tensile testing machine. The dimension of the samples is 100 mm in length, 10 mm in width, and 33–135 μm in thickness. Tests were carried out at a cross-head speed of 5 mm min−1 and gauge length of 50 mm at room temperature. For each sample, the test was repeated at least five times.
Results and discussion
Dispersion of POSS in PHBV/POSS hybrids
Fig. 2 presented that colored dots were evenly distributed in the images. The results showed that POSS was well dispersed in PHBV/POSS hybrids. Fig. 3 presented the proportion of each element. It could be seen that as the content of POSS increased, the intensity of Si element became higher. The proportion of Si element in all of elements of PHBV/POSS hybrids with different POSS content was 2%, 8%, 11%, 15%, 20%, 28%, 29%, respectively.
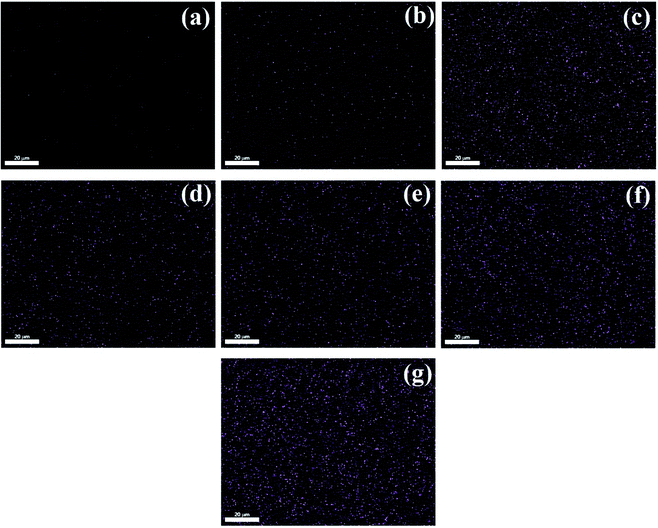 |
| | Fig. 2 Dispersion of silicon element in PHBV/POSS hybrids with different POSS content. (a) PHBV, (b) 5% POSS, (c) 10% POSS, (d) 15% POSS, (e) 20% POSS, (f) 25% POSS, (g) 30% POSS. | |
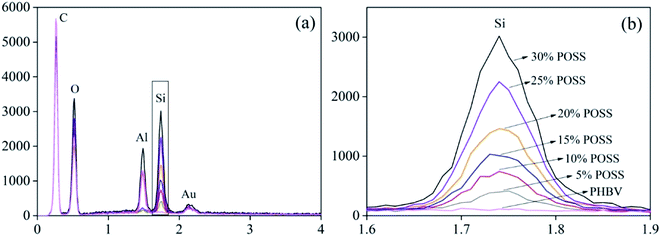 |
| | Fig. 3 The spectra of Si element in all kinds of elements. | |
FTIR analysis
Fig. 4 presented the FTIR spectra of the pure POSS and PHBV/POSS hybrids. In Fig. 4(a), the band at 1719 cm−1 was considered as C![[double bond, length as m-dash]](https://www.rsc.org/images/entities/char_e001.gif) O stretching of PHBV. The bands at 2976 cm−1 and 2933 cm−1 were assigned to CH3 symmetric stretching and CH2 antisymmetric stretching. 2874 cm−1 corresponded to CH2 symmetric stretching.20 In Fig. 4(b), the Si–O absorption band of POSS appeared at 1080 cm−1.21 The bands at 1282 cm−1 and 1224 cm−1 corresponded to C–O–C stretching in crystal structure. The band at 1180 cm−1 corresponded to C–O–C stretching in amorphous structure.22 However, at around 1100 cm−1, the peak of PHBV/POSS hybrids became more and more obvious with increasing of POSS content due to characteristic peak of POSS. It was consistent with the conclusion of EDS test.
O stretching of PHBV. The bands at 2976 cm−1 and 2933 cm−1 were assigned to CH3 symmetric stretching and CH2 antisymmetric stretching. 2874 cm−1 corresponded to CH2 symmetric stretching.20 In Fig. 4(b), the Si–O absorption band of POSS appeared at 1080 cm−1.21 The bands at 1282 cm−1 and 1224 cm−1 corresponded to C–O–C stretching in crystal structure. The band at 1180 cm−1 corresponded to C–O–C stretching in amorphous structure.22 However, at around 1100 cm−1, the peak of PHBV/POSS hybrids became more and more obvious with increasing of POSS content due to characteristic peak of POSS. It was consistent with the conclusion of EDS test.
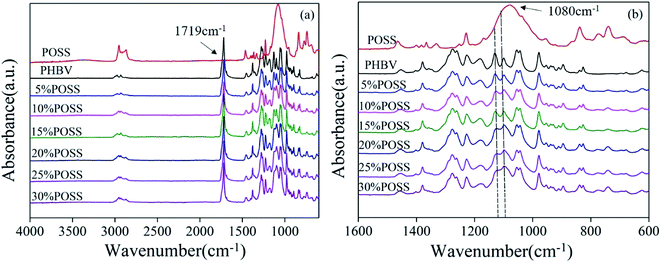 |
| | Fig. 4 FTIR spectra of PHBV, POSS and PHBV/POSS hybrids with different POSS content. (a) 4000–600 cm−1 (b) 1600–600 cm−1. | |
XRD analysis
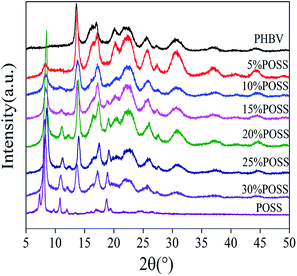
PHBV, PHBV/POSS hybrids and pure POSS were studied for crystal structure by XRD analysis and the diffraction curves were presented in Fig. 5. The characteristic reflection peaks of PHBV appeared at 13.53°, 16.97°, 21.54°, 25.58° and 30.06°, corresponding to (020), (110), (111), (031), (002) crystalline planes, respectively. The characteristic reflection peaks of POSS appeared at 8.12°, 10.8° and 18.8°, corresponding to (101), (110), (122) crystalline planes, respectively. PHBV/POSS hybrids exhibited the crystalline planes for both PHBV and POSS, indicating that the two crystalline phases coexisted. Besides, the peak intensity of POSS phase at 18.8° increased with increasing of POSS content.
 |
| | Fig. 5 XRD spectra of PHBV, POSS and PHBV/POSS hybrids. | |
Melting and crystallization behavior of PHBV/POSS hybrids
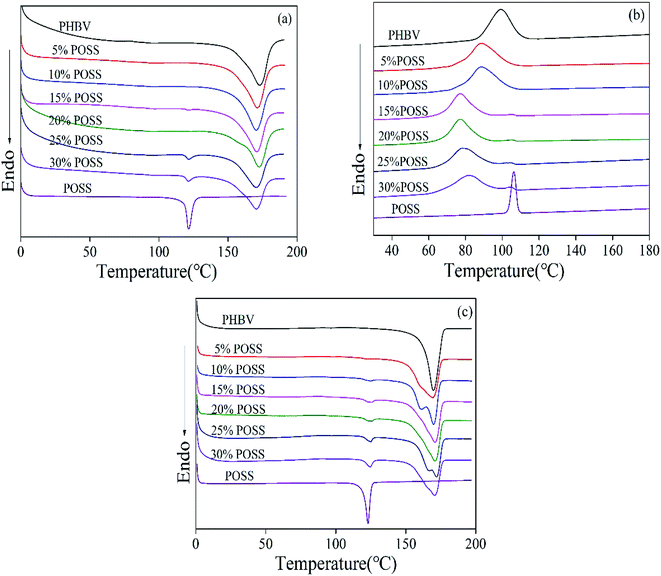
Fig. 6 showed melting and crystallization behavior of PHBV/POSS hybrids. The melting parameters of the second heating curves were shown in Table 1. Melting endotherm was represented by Tm. The enthalpy of endotherm was represented by ΔHm. χ was degree of crystallinity. Table 1 showed that Tm of the hybrids didn't have obvious changes. Tm were 169.8 °C, 169.4 °C, 170.0 °C, 170.9 °C, 171.0 °C, 170.7 °C, 170.6 °C, respectively. The crystallinity of the hybrids decreased by 14.3% comparing with PHBV. POSS hindered the crystallization of PHBV.
 |
| | Fig. 6 DSC curves of PHBV/POSS hybrids with different POSS content. (a) The first heating curves (b) the cooling curves and (c) the second heating curves. | |
Table 1 Melting behavior of PHBV and PHBV/POSS hybrids
| Sample |
Tm (°C) |
ΔHm (J g−1) |
χ(t∞) (%) |
| PHBV |
169.8 |
89.0 |
56.8 |
| 5% POSS |
169.4 |
86.6 |
55.3 |
| 10% POSS |
170.0 |
76.3 |
48.7 |
| 15% POSS |
170.9 |
79.8 |
51.0 |
| 20% POSS |
171.0 |
69.5 |
44.4 |
| 25% POSS |
170.7 |
67.6 |
43.2 |
| 30% POSS |
170.6 |
66.6 |
42.5 |
The parameters of the crystallization process were shown in Table 2. Tc(onset) was the temperature at the intercept of the tangents at the baseline of the high-temperature side. The width at half-height of the exotherm peak (ΔW) was determined after the normalization of the peak to a constant sample mass. The initial slope of the exotherm (S1), which was the slope at inflexion on the high-temperature side of the exotherm. S1 was defined as the nucleation rate. The parameter Tc(onset)–Tc was a measure of the overall rate of crystallization. The smaller Tc(onset)–Tc was, the greater the rate of crystallization was. The smaller ΔW was, the narrower the size distribution of the crystallites was.4
Table 2 Crystallization parameters of samples
| Sample |
Tc (°C) |
Tc(onset) (°C) |
ΔW (°C) |
ΔHc (J g−1) |
S1 = tan![[thin space (1/6-em)]](https://www.rsc.org/images/entities/char_2009.gif) α α |
| PHBV |
98.9 |
114.9 |
12.7 |
−75.1 |
0.07 |
| 5% POSS |
88.2 |
111.2 |
16.1 |
−74.9 |
0.03 |
| 10% POSS |
82.4 |
110.2 |
20.2 |
−72.0 |
0.02 |
| 15% POSS |
76.8 |
95.2 |
13.0 |
−59.3 |
0.03 |
| 20% POSS |
77.8 |
97.5 |
16.3 |
−55.4 |
0.03 |
| 25% POSS |
81.2 |
99.4 |
18.0 |
−51.0 |
0.03 |
| 30% POSS |
78.4 |
98.9 |
17.8 |
−50.7 |
0.02 |
The results showed that Tc and Tc(onset) of hybrids decreased in comparison with pure PHBV. By calculation, the values of Tc(onset)–Tc for pure PHBV was lower than those of PHBV/POSS hybrids. The values of Tc(onset)–Tc were 16 °C, 23 °C, 27.8 °C, 18.4 °C, 19.7 °C, 18.2 °C, 20.5 °C, respectively. These results indicated that the crystallization became difficult and the incorporation of POSS hindered the crystallization process of pure PHBV. It was also concluded in Table 2 that the value of ΔW for PHBV was smaller than those of PHBV/POSS hybrids and the value of S1 for PHBV was greater than those of PHBV/POSS hybrids. This implied that the crystallization peak region became wider. POSS reduced the nucleation or crystallization rates of PHBV.
Maybe a reduction of the driving force for crystallization due to the changes in the equilibrium melting point is one of factors. In conclusion, they are the dilution effect and hindrance effect. POSS has a certain miscibility with pure PHBV. Interactions between the two macromolecules may reduce the crystallization rate of the overall material and decrease nucleation capability of PHBV.
HSPOM analysis
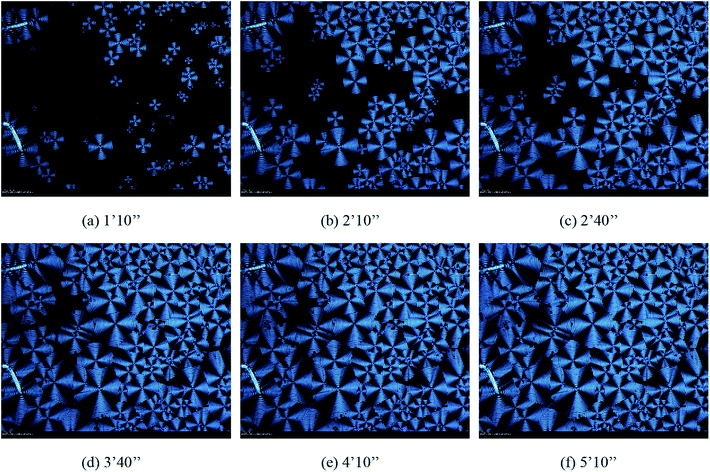
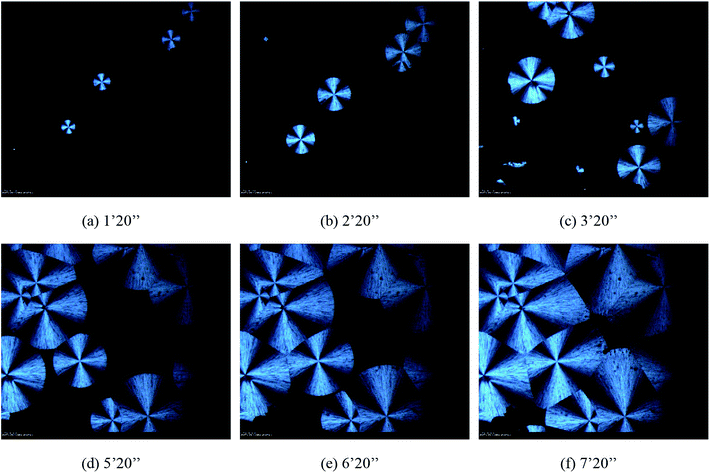
Fig. 7–9 showed the morphology of PHBV, 5% POSS, and 30% POSS during isothermal crystallization at 50 °C. A spherulitic produced birefringence exhibiting characteristic black cross extinction patterns. By calculation, the relationship between spherulite diameter and time could be known. As shown in Fig. 10, the diameter of spherulites was approximately linear with crystallization time, and the growth rate of spherulites was substantially constant. The growth rates of spherulites for PHBV and 5% POSS were approximately 4 nm s−1. When POSS content was 30%, the growth rates were about 5 nm s−1. The crystallization peak of 30% POSS was closer to 50 °C than those of PHBV and 5% POSS. As a result, 30% POSS had a faster crystallization rate during isothermal crystallization at 50 °C.
 |
| | Fig. 7 The morphologies of spherulites in PHBV during isothermal crystallization at 50 °C observed by HSPOM: (a) 1′10′′ (b) 2′10′′ (c) 2′40′′ (d) 3′40′′ (e) 4′10′′ (f) 5′10′′. | |
 |
| | Fig. 8 The morphologies of spherulites in 5% POSS during isothermal crystallization at 50 °C observed by HSPOM: (a) 1′20′′ (b) 2′20′′ (c) 3′20′′ (d) 5′20′′ (e) 6′20′′ (f) 7′20′′. | |
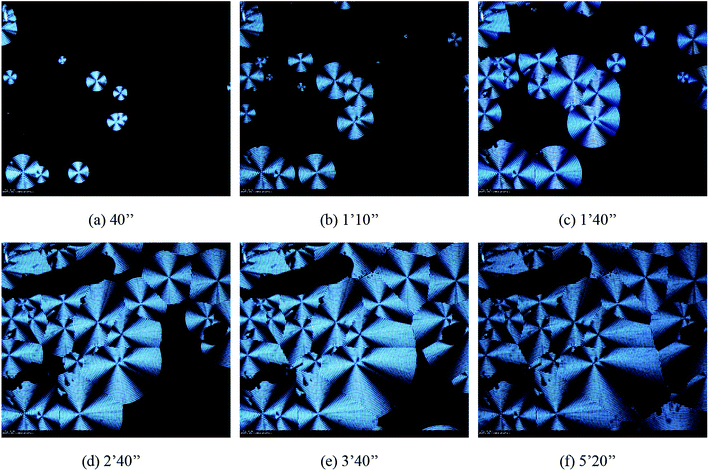 |
| | Fig. 9 The morphologies of spherulites in 30% POSS during isothermal crystallization at 50 °C observed by HSPOM: (a) 40′′ (b) 1′10′′ (c) 1′40′′ (d) 2′40′′ (e) 3′40′′ (f) 5′20′′. | |
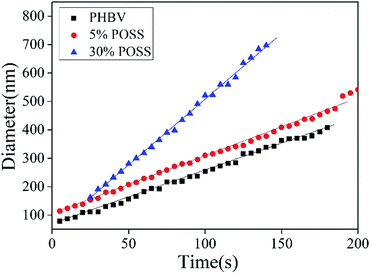 |
| | Fig. 10 The plots of diameter vs. time of spherulites in PHBV. | |
Isothermal crystallization kinetics
The isothermal crystallization kinetics of PHBV and PHBV/POSS hybrids were performed by DSC. The samples were heated to 200 °C, kept the temperature for 3 min, and subsequently cooled to Tc. At the temperature, it would be kept for 60 minutes to observe its crystallization. DSC cooling curves of all samples were shown in Fig. 11.
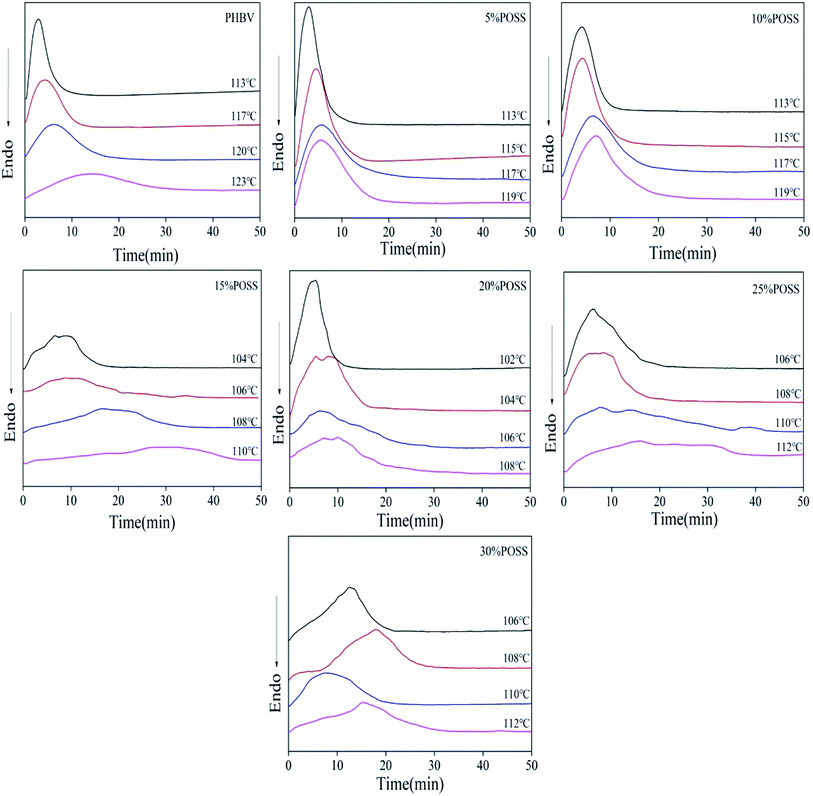 |
| | Fig. 11 DSC curves of the isothermal crystallization for PHBV and PHBV/POSS hybrids. | |
The crystallization kinetics of PHBV/POSS hybrids was a complex phenomenon. The process was affected by factors such as the thermodynamic conditions during the crystallization, the molecular characteristics of the components, and the strength of their interactions, and so on. Similar to small molecules, the isothermal crystallization of polymers could also use Avrami equation to describe:
X(
t) was the relative crystallinity at time
t (Fig. 12).
n was the Avrami index, which was related to the nucleation mechanism and crystal growth mode.
Z was the crystallization rate constant, and formula
(1) could be expressed as:
| |
log[−ln(1 − X(t))] = log![[thin space (1/6-em)]](https://www.rsc.org/images/entities/char_2009.gif) Z + n Z + n![[thin space (1/6-em)]](https://www.rsc.org/images/entities/char_2009.gif) log log![[thin space (1/6-em)]](https://www.rsc.org/images/entities/char_2009.gif) t t
| (2) |
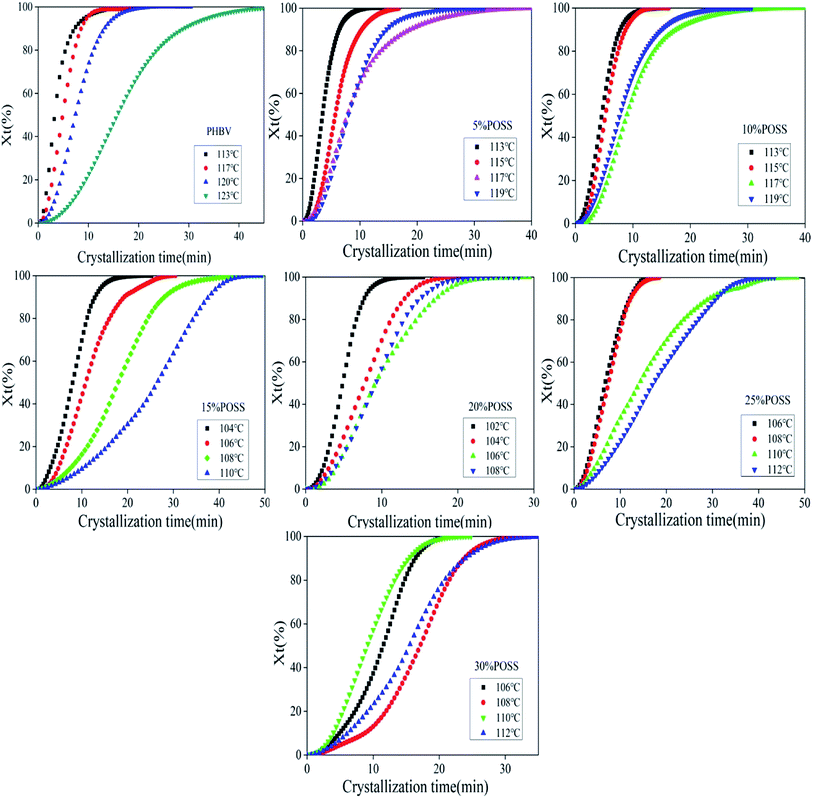 |
| | Fig. 12 The plots of relative degree of crystallinity of PHBV, 5% POSS, 10% POSS, 15% POSS, 20% POSS, 25% POSS, 30% POSS as a function of crystallization time under isothermal conditions. | |
Although the Avrami exponent (n) represented only the initial section of polymer crystallization correctly, it could provide valuable information about the general crystallization of polymers (Fig. 13).
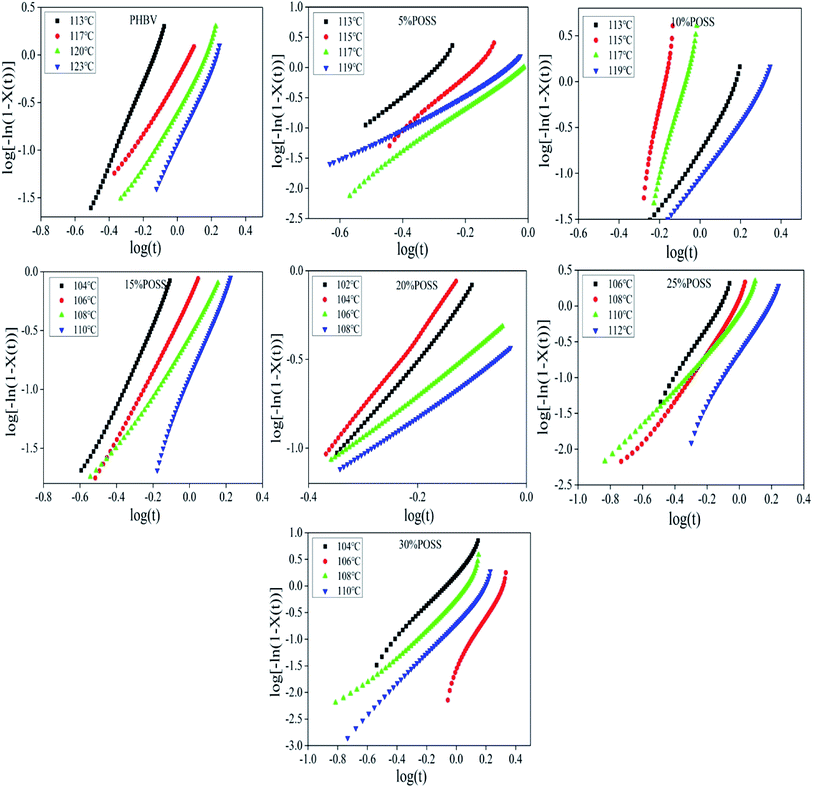 |
| | Fig. 13 The plots of log[−ln(1 − X(t))] as a function of log(t) for PHBV, 5% POSS, 10% POSS, 15% POSS, 20% POSS, 25% POSS, 30% POSS under isothermal conditions. | |
Low values of n (n < 3) correspond to two dimensional (disc shaped) spherulite growth with a sporadic mechanism at the beginning of crystallization, while higher n values (n ≥ 3) are related to three-dimensional spherulite growth with sporadic or combination of sporadic and simultaneous nucleation types.23
Another important parameter to study the isothermal crystallization kinetics was crystallization half time (t1/2), which was the time required for the system to reach a relative degree of crystallinity of 50%. The kinetic parameters obtained from fitting the Avrami model were shown in Table 3.
| |
 | (3) |
Table 3 Avrami exponent, kinetic constant, half-time of PHBV, 5% POSS, 10% POSS, 15% POSS, 20% POSS, 25% POSS, 30% POSS
| Sample |
Temperature (°C) |
n |
Z (min−1) |
t1/2 (min) |
| PHBV |
113 |
4.4 |
25.7 |
0.4 |
| 117 |
3.2 |
3.2 |
0.6 |
| 120 |
3.6 |
0.5 |
1.1 |
| 123 |
3.6 |
0.1 |
1.8 |
| 5% POSS |
113 |
4.2 |
17.3 |
0.5 |
| 115 |
4.7 |
3.6 |
0.6 |
| 117 |
4.1 |
1.6 |
0.8 |
| 119 |
3.9 |
0.6 |
1.0 |
| 10% POSS |
113 |
4.2 |
6.9 |
0.6 |
| 115 |
4.7 |
2.8 |
0.7 |
| 117 |
4.6 |
0.4 |
1.1 |
| 119 |
4.1 |
1.0 |
0.9 |
| 15% POSS |
104 |
3.6 |
1.1 |
0.9 |
| 106 |
2.8 |
0.5 |
1.1 |
| 108 |
2.4 |
0.3 |
1.5 |
| 110 |
4.1 |
0.1 |
1.8 |
| 20% POSS |
102 |
3.6 |
2.9 |
0.7 |
| 104 |
4.0 |
1.1 |
0.9 |
| 106 |
2.3 |
0.2 |
1.6 |
| 108 |
2.1 |
0.8 |
1.0 |
| 25% POSS |
106 |
3.7 |
3.2 |
0.7 |
| 108 |
2.7 |
0.5 |
1.1 |
| 110 |
2.9 |
0.8 |
1.0 |
| 112 |
3.6 |
0.2 |
1.4 |
| 30% POSS |
104 |
3.0 |
0.6 |
1.0 |
| 106 |
4.4 |
0.1 |
1.6 |
| 108 |
2.7 |
0.6 |
1.0 |
| 110 |
3.0 |
0.4 |
1.2 |
In Table 3, the value of n was more than 3. It was illustrated that PHBV was three-dimensional growth of homogeneous nucleation and n was not an integer, maybe due to the presence of some partially heterogeneous nucleation. With the addition of POSS, the mechanism of nucleation became complicated. Homogeneous nucleation and heterogeneous nucleation coexisted. At the same time, it could be seen that as the crystallization temperature increased, the semi-crystallization time also increased, the crystallization rate became slow.
Static contact angle analysis
The results were shown in Fig. 14. The surface of PHBV and PHBV/POSS hybrids was evaluated by static water contact angle. As seen from Table 4, the average contact angles of PHBV and PHBV/POSS hybrids were 77.3°, 81.0°, 81.1°, 86.4°, 88.6°, 96.5°, 90.8°, respectively. Factors affecting the size of contact angles were related to the properties of material. Other effects included the smoothness of the surface, the degree of flatness, the geometry/microscopic morphology, hygroscopicity to the liquid, etc. The values of static water contact angles for PHBV were roughly the same as in the literature.20 Surface characteristics were analyzed by atomic force microscopy (AFM). The results were shown in Fig. 15 and Table 5.
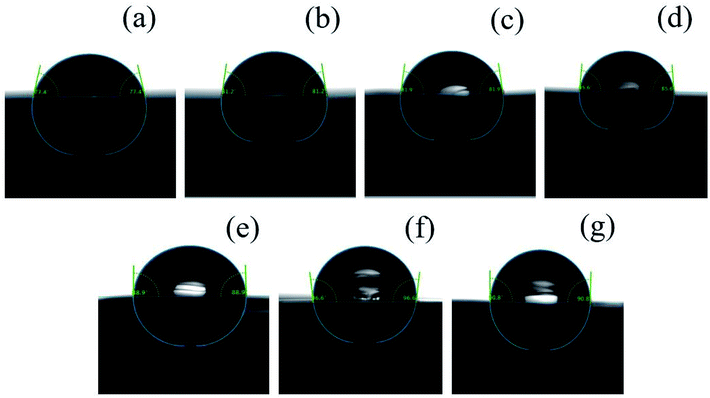 |
| | Fig. 14 The static water contact angles of (a) PHBV, (b) 5% POSS, (c) 10% POSS, (d) 15% POSS, (e) 20% POSS, (f) 25% POSS, (g) 30% POSS. | |
Table 4 The parameters of static water contact for PHBV and PHBV/POSS hybrids
| |
PHBV |
5% POSS |
10% POSS |
15% POSS |
20% POSS |
25% POSS |
30% POSS |
| Average (°) |
77.3 |
81.0 |
81.1 |
86.4 |
88.6 |
96.5 |
90.8 |
| CV (%) |
0.06 |
0.07 |
0.1 |
0.1 |
0.1 |
0.03 |
0.03 |
 |
| | Fig. 15 3D surface morphology images of (a) PHBV, (b) 5% POSS, (c) 10% POSS, (d) 15% POSS, (e) 20% POSS, (f) 25% POSS, (g) 30% POSS. 2D surface morphology images of (a′) PHBV, (b′) 5% POSS, (c′) 10% POSS, (d′) 15% POSS, (e′) 20% POSS, (f′) 25% POSS, (g′) 30% POSS. | |
Table 5 Parameters of AFM for PHBV and PHBV/POSS hybrids
| |
Scan size |
Samples/line |
Ra |
Rq |
| PHBV |
1.7 μm × 1.7 μm |
512 |
4.5 nm |
5.8 nm |
| 5% POSS |
1.7 μm × 1.7 μm |
512 |
7.6 nm |
9.4 nm |
| 10% POSS |
1.7 μm × 1.7 μm |
512 |
5.6 nm |
7.1 nm |
| 15% POSS |
1.7 μm × 1.7 μm |
512 |
8.7 nm |
11.2 nm |
| 20% POSS |
1.7 μm × 1.7 μm |
512 |
4.5 nm |
5.8 nm |
| 25% POSS |
1.7 μm × 1.7 μm |
512 |
4.8 nm |
6.1 nm |
| 30% POSS |
1.7 μm × 1.7 μm |
512 |
5.4 nm |
7.5 nm |
Samples were scanned of area to 1.7 μm×1.7 μm. Scanning speed was 512 times every line. Ra was ordinary average roughness. Rq was RSM roughness. There was no significant change in roughness of PHBV and PHBV/POSS hybrids. The changes in static water contact angles might be affected by addition of POSS.
Tensile properties
Tensile properties of PHBV and PHBV/POSS hybrids were investigated. The stress–strain curves for PHBV and PHBV/POSS hybrids were shown in Fig. 16 and the results of tensile properties were presented in Table 6. In Fig. 16, tensile curves presented a typical brittle fracture. However, the stress of PHBV/POSS hybrids was greater than that of PHBV in Table 6. It was concluded that with the addition of POSS, the tensile strength of hybrids had been improved.24 The PHBV/POSS hybrid with 20 wt% POSS owned the highest stress of 6.1 MPa.
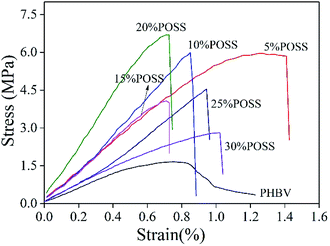 |
| | Fig. 16 Tensile stress–strain curves of PHBV and PHBV/POSS hybrids. | |
Table 6 Tensile properties of PHBV and PHBV/POSS hybrids
| |
PHBV |
5% POSS |
10% POSS |
15% POSS |
20% POSS |
25% POSS |
30% POSS |
| Stress (MPa) |
1.4 |
5.9 |
6.0 |
4.0 |
6.1 |
4.1 |
2.2 |
| CV |
0.1 |
0.9 |
0.2 |
0.3 |
0.5 |
0.6 |
0.6 |
Conclusions
PHBV/POSS hybrids with different POSS content of 5, 10, 15, 20, 25 and 30 wt% were prepared by solution casting. The composition, crystallization and melting behavior, crystal structure, spherulite morphology, surface morphology, water contact angle and mechanical property of PHBV/POSS hybrids were characterized by EDS, DSC, FTIR, XRD, HSPOM, AFM, static contact angle tester, and tensile testing machine. The results showed that POSS was well dispersed in PHBV matrix. Both PHBV and POSS formed separate crystalline phase. POSS restricted the crystallization of PHBV in PHBV/POSS hybrids. The crystallinity of pure PHBV was larger than that of PHBV/POSS hybrids. With the increase of POSS content, the crystallinity of PHBV/POSS hybrids decreased from 56.8 (pure PHBV) to 33.6% (PHBV/POSS hybrid with 30 wt%). The spherulites of PHBV and PHBV/POSS hybrids exhibited characteristic black cross extinction patterns. The growth rates of spherulites for PHBV and 5% POSS were approximately 4 nm s−1. When POSS content was 30%, the growth rates were about 5 nm s−1. Avrami equation was used successfully to describe isothermal crystallization kinetics of PHBV/POSS hybrids. Homogeneous nucleation and heterogeneous nucleation coexisted in PHBV/POSS hybrids. The water contact angle of pure PHBV was smaller than those of PHBV/POSS hybrids. In addition, POSS can improve the tensile property of PHBV obviously. The PHBV/POSS hybrid with 20 wt% POSS owned the highest stress of 6.1 MPa.
Conflicts of interest
There are no conflicts to declare.
Acknowledgements
This research was supported by the National Natural Science Foundation of China (51403084), Equipment Pre-Research Fund (61409220412), the Key Research and Development Program (Industry Forward and Common Key Technology) Project of Suqian City (H201708), the Jiangsu Overseas Research Training Program for University Prominent Young and Middle-Aged Teachers and Presidents, the Foundation of Key Laboratory of Pulp and Paper Science and Technology of Ministry of Education/Shandong Province of China (KF201714), the 111 Project (B17021), the Priority Academic Program Development of Jiangsu Higher Education Institutions, and the Top-notch Academic Programs Project of Jiangsu Higher Education Institutions (PPZY2015B147).
References
- Z. Li, J. Yang and X. J. Loh, NPG Asia Mater., 2016, 8, e265–285 CrossRef CAS.
- Z. B. Li and X. J. Loh, Chem. Soc. Rev., 2015, 44, 2865–2879 RSC.
- N. Sultana and M. Wang, J. Mater. Sci.: Mater. Med., 2008, 19, 2555–2561 CrossRef CAS PubMed.
- J. Li, M. F. Lai and J. J. Liu, J. Appl. Polym. Sci., 2004, 92, 2514–2521 CrossRef CAS.
- W. J. Liu, H. L. Yang, Z. Wang, L. S. Dong and J. J. Liu, J. Appl. Polym. Sci., 2010, 86, 2145–2152 CrossRef.
- M. Avella, G. L. Rota, E. Martuscelli, M. Raimo, P. Sadocco, G. Elegir and R. Riva, J. Mater. Sci., 2000, 35, 829–836 CrossRef CAS.
- Z. M. Xhxwscw Renlin, Sci. China: Chem., 2013, 56, 716–723 CrossRef.
- Z. Tan and X. Shen, China Synthetic Fiber Industry, 2008 Search PubMed.
- B. M. P. Ferreira, C. A. C. Zavaglia and E. A. R. Duek, J. Appl. Polym. Sci., 2010, 86, 2898–2906 CrossRef.
- Y. Xu, L. Zou, H. Lu, Y. Wei, J. Hua and S. Chen, J. Mater. Sci., 2016, 51, 5695–5711 CrossRef CAS.
- W. Kai, Y. He and Y. Inoue, Polym. Int., 2010, 54, 780–789 CrossRef.
- J. J. Schwab and J. D. Lichtenhan, Appl. Organomet. Chem., 1998, 12, 707–713 CrossRef CAS.
- T. S. Haddad and J. D. Lichtenhan, Macromolecules, 1996, 29, 7302–7304 CrossRef CAS.
- K. Tanaka and Y. Chujo, J. Mater. Chem., 2012, 22, 1733–1746 RSC.
- A. Fina, O. Monticelli and G. Camino, J. Mater. Chem., 2010, 20, 9297–9305 RSC.
- M. Kodal, A. A. Wis and G. Ozkoc, Radiat. Phys. Chem., 2018, 153, 214–225 CrossRef CAS.
- C.-H. Jung, I.-T. Hwang, C.-H. Jung and J.-H. Choi, Radiat. Phys. Chem., 2014, 102, 23–28 CrossRef CAS.
- S. Yilmaz, M. Kodal, T. Yilmaz and G. Ozkoc, Composites, Part B, 2014, 56, 527–535 CrossRef CAS.
- M. Ö. Seydibeyoğlu, M. Misra and A. Mohanty, Int. J. Plast. Technol., 2010, 14, 1–16 CrossRef.
- J. Zhang, H. Sato, I. Noda and Y. Ozaki, Macromolecules, 2005, 38, 3109–3121 Search PubMed.
- S. A. Mirmohammadi and M. Atai, J. Polym. Res., 2013, 20, 1–13 CAS.
- S. Kennouche, N. L. Moigne, M. Kaci, J. C. Quantin, A. S. Caro-Bretelle, C. Delaite and J. M. Lopez-Cuesta, Eur. Polym. J., 2016, 75, 142–162 CrossRef CAS.
- K. Sarikhani, R. Nasseri, V. Lotocki, R. B. Thompson, C. B. Park and P. Chen, Polymer, 2016, 98, 100–109 CrossRef CAS.
- B. Rai, W. Noohom, P. H. Kithva, L. Grondahl and M. Trau, Chem. Mater., 2008, 20, 2802–2808 CrossRef CAS.
|
| This journal is © The Royal Society of Chemistry 2019 |
Click here to see how this site uses Cookies. View our privacy policy here.  Open Access Article
 *abc and
Bingyao Denga

![[double bond, length as m-dash]](https://www.rsc.org/images/entities/char_e001.gif) O stretching of PHBV. The bands at 2976 cm−1 and 2933 cm−1 were assigned to CH3 symmetric stretching and CH2 antisymmetric stretching. 2874 cm−1 corresponded to CH2 symmetric stretching.20 In Fig. 4(b), the Si–O absorption band of POSS appeared at 1080 cm−1.21 The bands at 1282 cm−1 and 1224 cm−1 corresponded to C–O–C stretching in crystal structure. The band at 1180 cm−1 corresponded to C–O–C stretching in amorphous structure.22 However, at around 1100 cm−1, the peak of PHBV/POSS hybrids became more and more obvious with increasing of POSS content due to characteristic peak of POSS. It was consistent with the conclusion of EDS test.
O stretching of PHBV. The bands at 2976 cm−1 and 2933 cm−1 were assigned to CH3 symmetric stretching and CH2 antisymmetric stretching. 2874 cm−1 corresponded to CH2 symmetric stretching.20 In Fig. 4(b), the Si–O absorption band of POSS appeared at 1080 cm−1.21 The bands at 1282 cm−1 and 1224 cm−1 corresponded to C–O–C stretching in crystal structure. The band at 1180 cm−1 corresponded to C–O–C stretching in amorphous structure.22 However, at around 1100 cm−1, the peak of PHBV/POSS hybrids became more and more obvious with increasing of POSS content due to characteristic peak of POSS. It was consistent with the conclusion of EDS test.


![[thin space (1/6-em)]](https://www.rsc.org/images/entities/char_2009.gif) α
α


![[thin space (1/6-em)]](https://www.rsc.org/images/entities/char_2009.gif) Z + n
Z + n![[thin space (1/6-em)]](https://www.rsc.org/images/entities/char_2009.gif) log
log![[thin space (1/6-em)]](https://www.rsc.org/images/entities/char_2009.gif) t
t


