 Open Access Article
Effect of molecular weight distribution of PSSA on electrical conductivity of PEDOT:PSS
Jooyoung Kim,
Chanil Park,
Soeun Im,
Hongjoo Lee and
Jung Hyun Kim *
*
Department of Chemical Biomolecular Engineering, Yonsei University, 134 Shinchon-Dong, Seodaemoon-Gu, Seoul 120-749, South Korea. E-mail: jayhkim@yonsei.ac.kr; Fax: +82 2 312 0305; Tel: +82 2 2123 7633
First published on 30th January 2019
Abstract
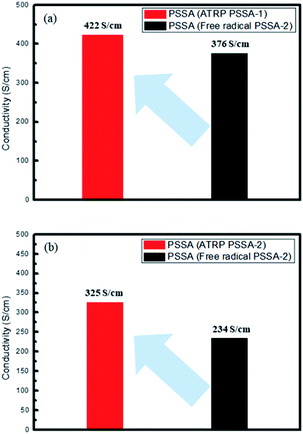
Poly(3,4-ethylenedioxythiophene):poly(styrenesulfonate) (PEDOT:PSS) is the most successful conductive polymer. In this study, we investigated the electrical properties of PEDOT:PSS prepared using poly(styrenesulfonic acid) (PSSA) having different molecular weight distributions. Herein PSSA with different molecular weight distributions were successfully polymerized by free radical polymerization and atom-transfer radical polymerization (ATRP). Polydispersity index values of PSSA obtained by the free radical process and ATRP process were 2.3–2.8 and 1.2–1.6 respectively. The electrical conductivity of PEDOT:PSS was enhanced from 376 S cm−1 (prepared using free radical PSSA) to 422 S cm−1 (prepared using ATRP PSSA) when PSSA of Mn 35![[thin space (1/6-em)]](https://www.rsc.org/images/entities/char_2009.gif) 000 g mol−1 PSSA was used and was enhanced from 234 S cm−1 (prepared using free radical PSSA) to 325 S cm−1 (prepared using ATRP PSSA) when PSSA of Mn 55
000 g mol−1 PSSA was used and was enhanced from 234 S cm−1 (prepared using free radical PSSA) to 325 S cm−1 (prepared using ATRP PSSA) when PSSA of Mn 55![[thin space (1/6-em)]](https://www.rsc.org/images/entities/char_2009.gif) 000 g mol−1 was used, by a factor of 15–30%. The greater the regularity of PSSA, the greater the packing density of PEDOT:PSS and consequently, charge carrier density. The improvement of packing density of PEDOT:PSS was confirmed by improvement in crystallinity of PEDOT:PSS by X-ray diffraction (XRD) analysis.
000 g mol−1 was used, by a factor of 15–30%. The greater the regularity of PSSA, the greater the packing density of PEDOT:PSS and consequently, charge carrier density. The improvement of packing density of PEDOT:PSS was confirmed by improvement in crystallinity of PEDOT:PSS by X-ray diffraction (XRD) analysis.
Introduction
Intrinsically conductive polymers (ICPs) have recently drawn widespread research attention owing to their intrinsic properties and stability compared to extrinsically conductive polymers, which are blends of electrically conductive additives (metallic materials or carbon materials) with thermoplastic polymers. One of the advantages of ICPs is that the molecules are connected by strong interactions like covalent bonds and ionic interaction. Saturated polymers like polyethylene, polystyrene and polyvinyl chloride contain saturated C–C bonds and show non conducting behavior due to their electrically and chemically stable form with localized electrons. In contrast, conjugated polymers like polyacetylene have π electrons that are delocalized along the long conjugated carbon chain, which play an important role in electron conduction.PEDOT:PSS is one of the remarkable intrinsically conjugated conducting polymers due to their stable dispersed form in water and good electrical conductivity. PEDOT is hydrophobic and unstable in water; therefore, it has to be treated with PSSA to form this polyelectrolyte complex system, because it helps PEDOT form a stable dispersion in water and enhances conductivity as a primary dopant for PEDOT.1–6 PSSA also acts as a template polymer for PEDOT. Crystallinity of PEDOT is affected by regularity of PSSA. Suttisak et al. investigated the sulfonated polyimide for high temperature application. In this study, they used two different sulfonated polyimide with different molecular weight distribution.7 However this study was not for molecular weight distribution of PSSA. To investigate effect of molecular weight distribution of PSSA, we had to find more sophisticated polymer synthesis method.
PSSA is generally polymerized by conventional free radical polymerization, because it is a simple, convenient and cost-effective process that does not involve complicated refining. Unlike conventional free radical processes, controlled processes like atom-transfer radical polymerization (ATRP) and reversible addition fragmentation chain transfer (RAFT) polymerization enables the formation of polymers with uniform chain lengths, because of the intrinsic character of the ATRP process. As the name suggests, the atom transfer step is key in the ATRP process and it enables the polymer to have uniform chain length and structure.8–18
In this study, we investigated the electrical properties of PEDOT:PSS especially, electrical conductivity prepared using PSSA having different molecular weight distributions. To confirm this hypothesis, we prepared PSSA having different molecular weight distributions. Generally, PSSA polymerized by a free radical process has polydispersity index (PDI) over 2.3. By narrowing down PDI of PSSA under 1.5, we anticipated improvement of electrical conductivity of PEDOT:PSS. The greater the regularity of PSSA, the greater is packing density of PEDOT:PSS and consequently, charge carrier density. The improvement of packing density of PEDOT:PSS was confirmed by improvement of crystallinity of PEDOT:PSS by X-ray diffraction (XRD) analysis.
Conventional PSSA polymerized by a free radical process has polydispersity index (PDI) of 2.3–2.8, while PSSA polymerized by ATRP has PDI of 1.2–1.6. The electrical conductivity of PEDOT:PSS was enhanced from 376 S cm−1 (prepared using free radical PSSA) to 422 S cm−1 (prepared using ATRP PSSA) when PSSA of Mn 35![[thin space (1/6-em)]](https://www.rsc.org/images/entities/char_2009.gif) 000 g mol−1 PSSA and enhanced from 234 S cm−1 (prepared using free radical PSSA) to 325 S cm−1 (prepared using ATRP PSSA) when PSSA of Mn 55
000 g mol−1 PSSA and enhanced from 234 S cm−1 (prepared using free radical PSSA) to 325 S cm−1 (prepared using ATRP PSSA) when PSSA of Mn 55![[thin space (1/6-em)]](https://www.rsc.org/images/entities/char_2009.gif) 000 g mol−1 PSSA by a factor of 15–30%. We investigated these phenomena for improving crystallinity and the primary doping level of PEDOT by using X-ray diffraction (XRD) analysis, UV-vis spectrometry and Raman spectrometry.
000 g mol−1 PSSA by a factor of 15–30%. We investigated these phenomena for improving crystallinity and the primary doping level of PEDOT by using X-ray diffraction (XRD) analysis, UV-vis spectrometry and Raman spectrometry.
Experimental
Materials
Styrenesulfonic acid sodium salt hydrate (NaSS, ≥ 99.5%), ethyl α-bromo-isobutyrate (C6H11BrO2, ≥98.0%), 2,2′-bipyridyl (C10H8–N2, ≥99.0%), copper(I) bromide (CuBr, ≥98.0%), 3,4-ethylenedioxythiphene (EDOT, ≥97%) sodium persulfate (Na2S2O8, ≥99.0%), iron(III) sulfate (Fe2(SO4)3, 97%), dimethyl sulfoxide (DMSO), deuterium oxide (D2O, 99.5 atom%), methanol (CH3OH, ≥99.0%) cation exchange resin, anion exchange resin were purchased from Sigma Aldrich Co., Yongin-Si, Gyeonggi-do, Korea. All reagents were used as received without further purification. Distilled deionized (DDI) water was used in all the experiments.Polymerization of PSSA via free radical process and ATRP process
For free radical polymerization of PSSA, NaSS (22.2 g, 0.1077 mol) was dissolved in DDI water (190 g) in an inert argon atmosphere at 80 °C. Sodium persulfate (0.69 g, 0.00289 mol) initiator, dissolved in 4 mL DDI, was added to a 250 mL double-jacketed glass reactor at 25 °C and sonicated for 20 min to obtain sufficient dissolution in the water bath. Stirring speed was maintained at 350 rpm during the reaction. After reaction time of 12 h, cation exchange resin was added to the reactor to remove the residual initiator and any by-products of the reaction.For PSSA polymerization via ATRP process, (NaSS) (35.24 g, 0.153 mol) and ethyl α-bromo-isobutyrate (0.1 g, 0.51 mmol) as an alkyl halide initiator were dissolved in DDI water (204 g) and methanol (17 g) in an inert argon atmosphere at 10 °C. CuBr (0.15 g, 0.001 mol) catalyst and 2,2′-bipyridyl (0.31 g, 0.002 mol) ligand were dissolved in methanol (4 mL) at 25 °C added to the reactor and sonicated for 20 min to obtain sufficient dissolution in the water bath. Stirring speed were maintained at 350 rpm during reaction. After reaction time of 12 h, cation exchange resin and anion exchange resin were added to the reactor to remove the residual initiator and any residual by-products of the reaction. PSSA samples obtained by the two above-mentioned method were dried to eliminate water and methanol by heating at 50 °C to minimize the influence of thermal energy.
Polymerization of PEDOT:PSS using 2 different PSSA samples
PEDOT:PSS was polymerized via oxidative polymerization. First, 0.84 g of PSSA was dissolved in 73 g of DDI water and stirred at 400 rpm until sufficient dissolution in an inert argon atmosphere at 10 °C. Then, (EDOT) was added to the reactor. Fe2(SO4)3 (0.0053 g) in DDI water (3 g) and Na2S2O8 (0.772 g) in DDI water (2 g) were sequentially added to the reactor. After reaction time of 24 h, cation exchange resins and anion exchange resins were added the reactor to remove the residual initiator and any residual by-products of the reaction.Characterization
Structural characterization of both PSSA samples, made via free radical process and ATRP process, were performed by 1H nuclear magnetic resonance (NMR) spectroscopy (Bruker Biospin, Advanced III, Seongnam-si, Korea). Molecular weight and its distribution in both PSSA samples made via free radical process and ATRP process were measured by gel permeation chromatography (GPC) (YL instruments, ACME9000 equipped with a series of Waters columns; HR4, HR3, HR2 and HR1; Anyang-si, Korea). Before analysis, PSSA samples were dried at 50 °C to eliminate water for minimizing the effect of thermal energy. UV-visible absorption spectra were obtained on a UV-vis spectrometer (Jasco, Jasco V-700, Seoul, Korea). Raman spectra were measured by Raman spectrometer (LabRam Aramis, Horriba Jobin Yvon, Seoul, Korea). Dispersive stability of PEDOT:PSS were measured by a zeta potential analyzer (Malvern instrument, Zetasize Nano Zs, Seongnam-si, Korea). Crystallinity of PEDOT:PSS were measured by X-ray diffraction analyzer (Rigaku, SmartLab, Seoul, Korea). The sheet resistance were measured by four point probe method (Napson, RT-70V/RG5, Seoul, Korea) and the film thicknesses were measured by a surface profiler (Bruker, DektakXT Stylus Profiler, Seongnam-si, Korea). The elemental composition of the PEDOT:PSS film surface was analysed by X-ray photoelectron spectroscopy (Thermo UK, K-alpha, Seoul, Korea).Electrical conductivity of PEDOT:PSS were measured following procedure. PEDOT:PSS solution was coated on the bare glass substrate by spin coater with 300, 500, 700, 900 rpm respectively. After coating, we annealed the PEDOT:PSS coated glass in drying oven at 120 °C for 2 minutes. Sheet resistance were measured using four point probe method. Then the thickness of PEDOT:PSS were measured using surface profiler by 4 times. We averaged 4 times measurement thickness values and used the averaged thickness value. The electrical conductivity were calculated inverse value of sheet resistance divided by sheet thickness.
Results and discussion
General opinions on factors affected on electrical conductivity of PEDOT:PSS
As per Ohm's law, current can be obtained using the following equation (current is generally denoted by i and electromotive force is generally denoted by E).| i = σE = E/ρ |
Resistivity is a characteristic that quantifies how much a given material opposes the flow of current, i.e. current flows easily when the resistance is low. The resistivity is generally denoted by ρ and electrical conductivity, i.e. the inverse of resistivity is generally denoted by σ. Conductivity can be expressed by the following equation (sheet resistance is generally denoted by Rs and sheet thickness is generally denoted by t).
| ρ = Rst, σ = 1/ρ |
When materials are electrically charged, carrier works under electrical field. When the carrier is electron, the material is termed as electrical-conducting and when the carrier is ion, it can be termed as ion-conducting. In this study, we deal with electrical conduction. Electrical conductivity can be expressed by the following equation (charge carrier density is generally denoted by n, elemental charge is generally denoted by e and charge carrier mobility is generally denoted by μ).
| σ = neμ |
For PEDOT:PSS, only holes participate in charge transportat-ion, because free electrons immediately recombine at the oxidized PEDOT. To obtain high electrical conductivity for PEDOT:PSS, the condition of high density and mobility of charge carriers must be satisfied. In this study, charge carrier density is thought by crystallinity of PEDOT:PSS from XRD measurement and charge carrier mobility of PEDOT:PSS is thought by getting easily doped from UV-visible spectroscopy and Raman spectroscopy. The greater the crystallinity of PEDOT:PSS, the greater is its packing density and consequently, charge carrier density.
Conventional PSSA polymerized by a free radical process has polydispersity index (PDI) of 2.3–2.8, while PSSA polymerized by ATRP has PDI of 1.2–1.6. The electrical conductivity of PEDOT:PSS was enhanced from 376 S cm−1 (prepared using free radical PSSA) to 422 S cm−1 (prepared using ATRP PSSA) when PSSA of Mn = 35![[thin space (1/6-em)]](https://www.rsc.org/images/entities/char_2009.gif) 000 g mol−1 PSSA and enhanced from 234 S cm−1 (prepared using free radical PSSA) to 325 S cm−1 (prepared using ATRP PSSA) when PSSA of Mn = 55
000 g mol−1 PSSA and enhanced from 234 S cm−1 (prepared using free radical PSSA) to 325 S cm−1 (prepared using ATRP PSSA) when PSSA of Mn = 55![[thin space (1/6-em)]](https://www.rsc.org/images/entities/char_2009.gif) 000 g mol−1 PSSA by a factor of 15–30% (Fig. 1 and Table 1).
000 g mol−1 PSSA by a factor of 15–30% (Fig. 1 and Table 1).
| Description | Average conductivity (S cm−1) |
|---|---|
| PEDOT:PSS (ATRP PSSA-1) | 422 |
| PEDOT:PSS (free radical PSSA-1) | 376 |
| PEDOT:PSS (ATRP PSSA-2) | 325 |
| PEDOT:PSS (free radical PSSA-2) | 234 |
Polymerization of PSSA with narrow molecular weight distribution via ATRP and with broad molecular weight distribution via free radical process
The ATRP process involves relatively mild reaction conditions, because this polymerization process is initiated by atoms instead of radicals and reaction temperature is ∼10 °C. Due to the characteristics of the reaction mechanism, PSSA prepared by ATRP process has narrow molecular weight distribution (PDI is under 1.6). On the other hands, the free radical process involves relatively harsh reaction conditions, because the highly reactive radical molecules must be generated by thermal cleavage, and the reaction temperature is above 80 °C. Based on these differences of the intrinsic reaction mechanism, PSSA samples prepared by the two processes have different molecular weight distributions. Generally, PSSA obtained from the free radical process and the ATRP process have PDI values greater than 2.0, and less than 1.6 respectively. (Scheme 1) To check the differences in molecular weight distribution between PSSA obtained by the two processes, GPC measurement was implemented. Before measurement, we calibrated the GPC instrument using standard GPC samples with different molecular weights (Mn = 37![[thin space (1/6-em)]](https://www.rsc.org/images/entities/char_2009.gif) 500/60
500/60![[thin space (1/6-em)]](https://www.rsc.org/images/entities/char_2009.gif) 000/210, 400/740, 500)19,20 (Fig. 2 and Table 2).
000/210, 400/740, 500)19,20 (Fig. 2 and Table 2).
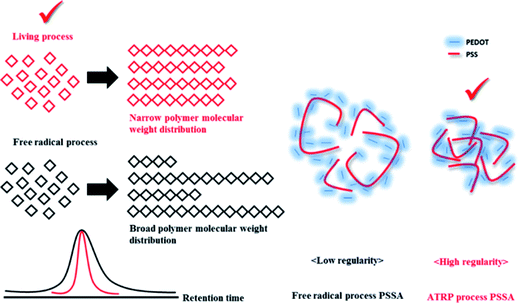 | ||
| Scheme 1 Schematic illustration of effect of molecular weight distribution of PSSA on electrical conductivity of PEDOT:PSS. | ||
 | ||
| Fig. 2 GPC calibration by PSSA standard sample and measurement of molecular weight of PSSA prepared by the ATRP and free radical processes (PSSA standard (a and b), PSSA-1 (c), PSSA-2 (d)). | ||
| Description | Mn (g mol−1) | Mw (g mol−1) | PDI |
|---|---|---|---|
| PSSA-1 (ATRP) | 33![[thin space (1/6-em)]](https://www.rsc.org/images/entities/char_2009.gif) 000 000 |
40![[thin space (1/6-em)]](https://www.rsc.org/images/entities/char_2009.gif) 000 000 |
1.21 |
| PSSA-1 (free radical) | 35![[thin space (1/6-em)]](https://www.rsc.org/images/entities/char_2009.gif) 000 000 |
81![[thin space (1/6-em)]](https://www.rsc.org/images/entities/char_2009.gif) 000 000 |
2.31 |
| PSSA-2 (ATRP) | 58![[thin space (1/6-em)]](https://www.rsc.org/images/entities/char_2009.gif) 000 000 |
99![[thin space (1/6-em)]](https://www.rsc.org/images/entities/char_2009.gif) 000 000 |
1.65 |
| PSSA-2 (free radical) | 55![[thin space (1/6-em)]](https://www.rsc.org/images/entities/char_2009.gif) 000 000 |
153![[thin space (1/6-em)]](https://www.rsc.org/images/entities/char_2009.gif) 000 000 |
2.78 |
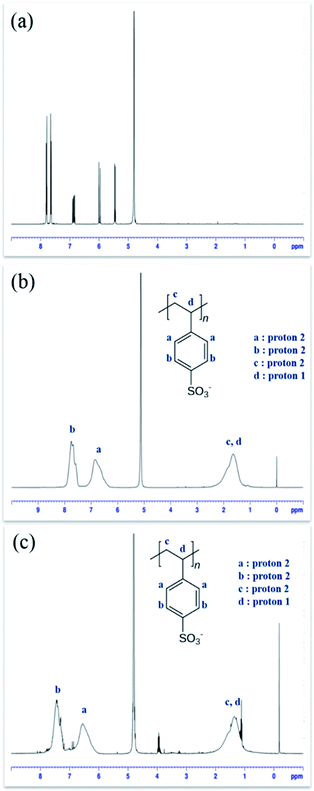
1H NMR spectroscopy was used for structural characterization of PSSA samples polymerized via free radical process and ATRP process, D2O was used as the NMR solvent to dissolve PSSA samples. It was found that PSSA polymerized by the two different processes have identical structures21–23 (Fig. 3).
We prepared PSSA of two molecular weight group: one with Mn = 33![[thin space (1/6-em)]](https://www.rsc.org/images/entities/char_2009.gif) 000–35
000–35![[thin space (1/6-em)]](https://www.rsc.org/images/entities/char_2009.gif) 000 g mol−1 and the other with Mn = 55
000 g mol−1 and the other with Mn = 55![[thin space (1/6-em)]](https://www.rsc.org/images/entities/char_2009.gif) 000–58
000–58![[thin space (1/6-em)]](https://www.rsc.org/images/entities/char_2009.gif) 000 g mol−1. GPC measurement revealed that PSSA polymerized by the ATRP process and the free radical process have PDI values of less than 1.6 and greater than 2.3, respectively. By comparing the PDI values of PSSA prepared by the two processes, we ascertained the differences between the two processes.
000 g mol−1. GPC measurement revealed that PSSA polymerized by the ATRP process and the free radical process have PDI values of less than 1.6 and greater than 2.3, respectively. By comparing the PDI values of PSSA prepared by the two processes, we ascertained the differences between the two processes.
Polymerization of PEDOT with PSSA with narrow molecular weight distribution, prepared via the ATRP process and with PSSA with broad molecular weight distribution, prepared via the free radical process
PSSA acts as a dispersion stabilizer in water and as a counter ion or dopant for PEDOT:PSS in water. To investigate the effect of molecular weight distribution of PSSA on the electrical conductivity of PEDOT:PSS, we performed polymerization of PEDOT using PSSA prepared via the ATRP process and the free radical process. PSSA ratio for EDOT monomer was 250 wt%. The reaction conditions, i.e. reaction temperature, feed rate of purging argon gas for preventing air inflow, agitation speed and reaction time were identical. Before studying the electrical properties of PEDOT:PSS, we checked the dispersive stability of PEDOT:PSS using the zeta potential analyzer. PEDOT:PSS solution was diluted 1![[thin space (1/6-em)]](https://www.rsc.org/images/entities/char_2009.gif) :
:![[thin space (1/6-em)]](https://www.rsc.org/images/entities/char_2009.gif) 100 using DDI water. Both PEDOT:PSS samples had potential values between −85 mv and −95 mV, and thus showed good dispersive stability. When the absolute value of zeta potential is ranged 50–100 mV, the dispersion is considered stable.24
100 using DDI water. Both PEDOT:PSS samples had potential values between −85 mv and −95 mV, and thus showed good dispersive stability. When the absolute value of zeta potential is ranged 50–100 mV, the dispersion is considered stable.24
We ascertained that PEDOT:PSS obtained using ATRP PSSA had higher electrical conductivity than PEDOT:PSS obtained using free radical PSSA. Higher electrical conductivity originates from the structural regularity of the PEDOT:PSS molecules. Hui et al. stated that entangled PEDOT:PSS chain changed into linear or expanded coil formation by UV–ozone treatment. Accordingly the number of charge trapping defects decreases and the electrical conductivity is enhanced.25 ATRP PSSA has more regular molecular weight distribution than free radical PSSA; therefore, PEDOT:PSS prepared using ATRP PSSA forms more crystalline structure than PEDOT:PSS prepared using free radical PSSA. This was confirmed by analyzing the crystallinity of PEDOT:PSS.
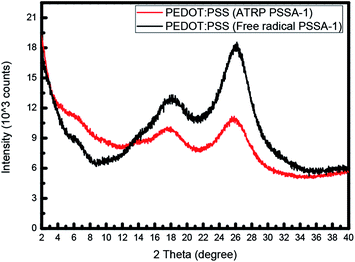
Kim et al. stated that The XRD patterns show characteristic peaks at 2θ = 3.8°, 6.6°, 17.7°, 25.6°. The low-angle reflections at 2θ = 3.8° show the lamellar stacking distance of two distinct alternate ordering of PEDOT and PSS, whereas the high angle reflections at 2θ = 17.7° and 25.6° show the amorphous halo of PSS and the interchain planar ring-stacking distance of PEDOT.26–33 XRD spectrum (Fig. 4) revealed that PEDOT and PSS became more crystalline when prepared using ATRP PSSA. At low-angle reflection at 3.8°, PEDOT:PSS using ATRP PSSA shows higher intensity value and At high-angle reflection at 17.7° and 25.6°, PEDOT:PSS using ATRP PSSA shows lower intensity value than PEDOT:PSS using free radical PSSA.
High electrical conductivity also originates from the primary doping level of PEDOT:PSS prepared by using the more regular PSSA obtained from the ATRP process. To confirm this hypothesis, we performed UV-vis and Raman spectroscopic analyses.
The UV-visible spectra (Fig. 5) showed that with increasing amount of primary dopant (PSSA) in the PEDOT molecules, absorbance increases, especially in the near-IR (NIR) range (800–1400 nm). We ascertained that PEDOT:PSS prepared using ATRP PSSA absorbs more NIR light than that prepared using free radical PSSA.34
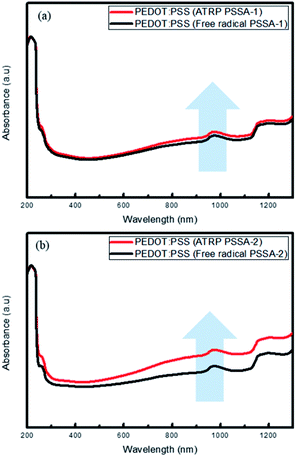 | ||
| Fig. 5 UV-visible spectra (absorbance mode) of PEDOT:PSS (ATRP) and PEDOT:PSS (free radical) (a) PSSA-1 (b) PSSA-2. | ||
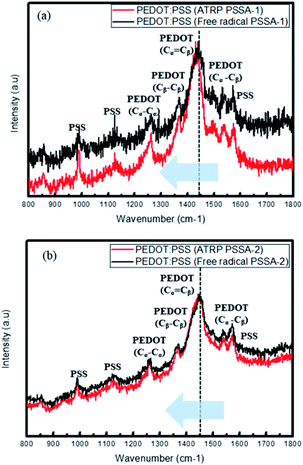
Raman spectra (Fig. 6) revealed that PEDOT became more crystalline and was stabilized by resonance by transforming from the benzoid structure to the quinoid structure when prepared using ATRP PSSA. The five main peaks observed are attributed to the Cα–Cβ antisymmetric stretching vibrations (1517 cm−1), Cα![[double bond, length as m-dash]](https://www.rsc.org/images/entities/char_e001.gif) Cβ symmetric stretching vibrations (1438 cm−1), Cβ–Cβ deformations (1373 cm−1), Cα–Cα′ symmetric stretching vibrations (1263 cm−1) and oxyethylene ring deformation (996 cm−1). The two structures have different π-conjugations and charge delocalizations. When this phenomenon occurs, the Raman spectra show red shift. (The peak due to PEDOT Cα
Cβ symmetric stretching vibrations (1438 cm−1), Cβ–Cβ deformations (1373 cm−1), Cα–Cα′ symmetric stretching vibrations (1263 cm−1) and oxyethylene ring deformation (996 cm−1). The two structures have different π-conjugations and charge delocalizations. When this phenomenon occurs, the Raman spectra show red shift. (The peak due to PEDOT Cα![[double bond, length as m-dash]](https://www.rsc.org/images/entities/char_e001.gif) Cβ symmetric stretching shifted to shorter wavenumber, i.e. 1450 cm−1) ATRP PSSA have more crystalline structure than free radical PSSA; therefore, ATRP PSSA can easily donate proton to PEDOT. For PSSA-1, the Cα
Cβ symmetric stretching shifted to shorter wavenumber, i.e. 1450 cm−1) ATRP PSSA have more crystalline structure than free radical PSSA; therefore, ATRP PSSA can easily donate proton to PEDOT. For PSSA-1, the Cα![[double bond, length as m-dash]](https://www.rsc.org/images/entities/char_e001.gif) Cβ symmetric stretching vibrations were shifted from 1441 cm−1 (free radical) to 1431 cm−1 (ATRP) and PSSA-2, the Cα
Cβ symmetric stretching vibrations were shifted from 1441 cm−1 (free radical) to 1431 cm−1 (ATRP) and PSSA-2, the Cα![[double bond, length as m-dash]](https://www.rsc.org/images/entities/char_e001.gif) Cβ symmetric stretching vibrations were shifted from 1448 cm−1 (free radical) to 1444 cm−1 (ATRP).35–37
Cβ symmetric stretching vibrations were shifted from 1448 cm−1 (free radical) to 1444 cm−1 (ATRP).35–37
Seo et al. investigated the effect of TiO2 nanoparticle addition on the structure of PEDOT:PSS. In this study, TiO2 nanoparticle added PEDOT:PSS shows structural change from benzoid to quinoid in Raman spectroscopy. The benzoid prefer coil conformation structure, while the quinoid prefer linear or expanded-coil structure.38 From this study, relatively linear polymer complex, PEDOT:PSS synthesized from ATRP process shows quinoid structure, while entangled coil polymer complex, PEDOT:PSS synthesized from free radical process shows benzoid structure in Raman spectroscopy.
Conclusions
We investigated the effect of PSSA with different molecular weight distributions on the electrical conductivity of PEDOT:PSS. Although PSSA plays an important role in the PEDOT:PSS complex as polyanionic polyelectrolyte and a primary dopant, the effect of molecular weight distribution of PSSA was not investigated before. We ascertained that PSSA polymerized via controlled radical processes like ATRP had narrow molecular weight distribution compared to PSSA polymerized via free radical process. We used ethyl α-bromo-isobutyrate as an atom transfer agent for the ATRP process. Compared to the free radical process, the ATRP process polymerized PSSA under milder reaction conditions, especially the reaction temperature (free radical process: 80 °C, ATRP process: 10 °C). In addition, more reactive radicals initiated the polymerization in free radical process, while less reactive atoms initiated the polymerization in the ATRP process. Therefore, PSSA polymerized via the ATRP process has narrower molecular weight distribution than PSSA polymerized via the free radical process (PDI values obtained using the free radical process and the ATRP process are 2.3–2.8 and 1.2–1.6 respectively). The electrical conductivity of PEDOT:PSS was enhanced from 376 S cm−1 (using free radical PSSA) to 422 S cm−1 (using ATRP PSSA) when prepared using PSSA of Mn = 35![[thin space (1/6-em)]](https://www.rsc.org/images/entities/char_2009.gif) 000 g mol−1 and was enhanced from 234 S cm−1 (using free radical PSSA) to 325 S cm−1 (using ATRP PSSA) when prepared using PSSA of Mn = 55
000 g mol−1 and was enhanced from 234 S cm−1 (using free radical PSSA) to 325 S cm−1 (using ATRP PSSA) when prepared using PSSA of Mn = 55![[thin space (1/6-em)]](https://www.rsc.org/images/entities/char_2009.gif) 000 g mol−1 PSSA by a factor of 15–30%. XRD analysis confirmed that the enhancement of electrical conductivity originated from the increase in crystallinity. The UV-vis and Raman spectra revealed that the enhancement in electrical conductivity was due to the primary doping level and stabilization of the PEDOT structure.
000 g mol−1 PSSA by a factor of 15–30%. XRD analysis confirmed that the enhancement of electrical conductivity originated from the increase in crystallinity. The UV-vis and Raman spectra revealed that the enhancement in electrical conductivity was due to the primary doping level and stabilization of the PEDOT structure.
Conflicts of interest
There are no conflicts to declare.Acknowledgements
This work was supported by the Nano Material Technology Development Program through the National Research Foundation of Korea (NRF) funded by the Ministry of Science, ICT & Future Planning (MSIP, Korea) (NRF-2014M3A7B4050960/2014M3A7B4051745). This research was also supported by the Priority Research Centers Program via the National Research Foundation of Korea (NRF) funded by the Ministry of Education, Science and Technology (2009-0093823).Notes and references
- W. Cho, S. Im, S. Kim, S. Kim and J. H. Kim, Polymers, 2016, 8, 189 CrossRef
.
- C. h. Chen, J. C. LaRue, R. D. Nelson, L. Kulinsky and M. J. Madou, J. Appl. Polym. Sci., 2012, 125, 3134–3141 CrossRef CAS
.
- J. E. McCarthy, C. A. Hanley, L. J. Brennan, V. G. Lambertini and Y. K. Gun'ko, J. Mater. Chem. C, 2014, 2, 764–770 RSC
.
- S. Mukherjee, R. Singh, S. Gopinathan, S. Murugan, S. Gawali, B. Saha, J. Biswas, S. Lodha and A. Kumar, ACS Appl. Mater. Interfaces, 2014, 6, 17792–17803 CrossRef CAS PubMed
.
- Z. Li, F. Qin, T. Liu, R. Ge, W. Meng, J. Tong, S. Xiong and Y. Zhou, Org. Electron., 2015, 21, 144–148 CrossRef CAS
.
- W. Cho, J. K. Hong, J. J. Lee, S. Kim, S. Kim, S. Im, D. Yoo and J. H. Kim, RSC Adv., 2016, 6, 63296–63303 RSC
.
- S. Srisuwan, Y. Ding, D. Mamangun, S. Thongyai, P. Praserthdam and G. A. Sotzing, J. Appl. Polym. Sci., 2013, 128, 3840–3845 CrossRef CAS
.
- C.-K. Choi and Y.-B. Kim, Polym. Bull., 2003, 49, 433–439 CrossRef CAS
.
- P. Iddon, K. Robinson and S. Armes, Polymer, 2004, 45, 759–768 CrossRef CAS
.
- J. K. Hong, Y. S. Kim, W. Cho and J. H. Kim, Macromol. Res., 2017, 25, 243–248 CrossRef CAS
.
- M. Kato, M. Kamigaito, M. Sawamoto and T. Higashimura, Macromolecules, 1995, 28, 1721–1723 CrossRef CAS
.
- J.-S. Wang and K. Matyjaszewski, J. Am. Chem. Soc., 1995, 117, 5614–5615 CrossRef CAS
.
- B. Keoshkerian, M. K. Georges and D. Boils-Boissier, Macromolecules, 1995, 28, 6381–6382 CrossRef CAS
.
- Y. Mitsukami, M. S. Donovan, A. B. Lowe and C. L. McCormick, Macromolecules, 2001, 34, 2248–2256 CrossRef CAS
.
- Z. Tang, S. Liu, Z. Wang, S. Dong and E. Wang, Electrochem. Commun., 2000, 2, 32–35 CrossRef CAS
.
- X.-S. Wang, S. Lascelles, R. Jackson and S. Armes, Chem. Commun., 1999, 1817–1818 RSC
.
- K. L. Robinson, J. V. Weaver, S. P. Armes, E. D. Marti and F. C. Meldrum, J. Mater. Chem., 2002, 12, 890–896 RSC
.
- P. Liu, D. Liang, Z. Tong and X. Liu, Macromolecules, 2002, 35, 1487–1488 CrossRef CAS
.
- R. W. Lewis, R. A. Evans, N. Malic, K. Saito and N. R. Cameron, Polym. Chem., 2017, 8, 3702–3711 RSC
.
- K. S. Kang, C. H. Jee, T. Kim, I. Chung and P. Huh, Polym.-Plast. Technol. Eng., 2017, 56, 117–122 CrossRef CAS
.
- J. C. Yang, M. J. Jablonsky and J. W. Mays, Polymer, 2002, 43, 5125–5132 CrossRef CAS
.
- W. J. Bae, K. H. Kim, Y. H. Park and W. H. Jo, Chem. Commun., 2003, 2768–2769 RSC
.
- S. Hietala, S. L. Maunu and F. Sundholm, Macromolecules, 1999, 32, 788–791 CrossRef CAS
.
- G. Wang, Y. Ding, F. Wang, X. Li and C. Li, J. Colloid Interface Sci., 2008, 317, 199–205 CrossRef CAS PubMed
.
- H. Shi, C. Liu, Q. Jiang and J. Xu, Adv. Electron. Mater., 2015, 1, 1500017 CrossRef
.
- N. Kim, S. Kee, S. H. Lee, B. H. Lee, Y. H. Kahng, Y. R. Jo, B. J. Kim and K. Lee, Adv. Mater., 2014, 26, 2268–2272 CrossRef CAS PubMed
.
- N. Kim, B. H. Lee, D. Choi, G. Kim, H. Kim, J.-R. Kim, J. Lee, Y. H. Kahng and K. Lee, Phys. Rev. Lett., 2012, 109, 106405 CrossRef PubMed
.
- K. Aasmundtveit, E. Samuelsen, L. Pettersson, O. Inganäs, T. Johansson and R. Feidenhans, Synth. Met., 1999, 101, 561–564 CrossRef CAS
.
- N. Murthy and H. Minor, Polymer, 1990, 31, 996–1002 CrossRef CAS
.
- M. V. Fabretto, D. R. Evans, M. Mueller, K. Zuber, P. Hojati-Talemi, R. D. Short, G. G. Wallace and P. J. Murphy, Chem. Mater., 2012, 24, 3998–4003 CrossRef CAS
.
- A. Laforgue and L. Robitaille, Macromolecules, 2010, 43, 4194–4200 CrossRef CAS
.
- J. Y. Kim, M. H. Kwon, Y. K. Min, S. Kwon and D. W. Ihm, Adv. Mater., 2007, 19, 3501–3506 CrossRef CAS
.
- M. A. Ali, H. Kim, C. Lee, H. Nam and J. Lee, Synth. Met., 2011, 161, 1347–1352 CrossRef CAS
.
- Y. Wang, C. Zhu, R. Pfattner, H. Yan, L. Jin, S. Chen, F. Molina-Lopez, F. Lissel, J. Liu and N. I. Rabiah, Sci. Adv., 2017, 3, e1602076 CrossRef PubMed
.
- Y. Kim, W. Cho, Y. Kim, H. Cho and J. H. Kim, J. Mater. Chem. C, 2018, 6, 8906–8913 RSC
.
- J. Y. Oh, M. Shin, J. B. Lee, J.-H. Ahn, H. K. Baik and U. Jeong, ACS Appl. Mater. Interfaces, 2014, 6, 6954–6961 CrossRef CAS PubMed
.
- T.-R. Chou, S.-H. Chen, Y.-T. Chiang, Y.-T. Lin and C.-Y. Chao, J. Mater. Chem. C, 2015, 3, 3760–3766 RSC
.
- H. Seo, M.-K. Son, N. Itagaki, K. Koga and M. Shiratani, J. Power Sources, 2016, 307, 25–30 CrossRef CAS
.
| This journal is © The Royal Society of Chemistry 2019 |

