 Open Access Article
A green approach of preparation of fine active alumina with high specific surface area from sodium aluminate solution
Guoyu Wu ,
Guihua Liu
 *,
Xiaobin Li,
Zhihong Peng,
Qiusheng Zhou
 and
Tiangui Qi
School of Metallurgy and Environment, Central South University, Changsha 410083, Hunan, China. E-mail: liugh303@csu.edu.cn
First published on 14th February 2019
Abstract
Fine active alumina (FAA) with a high specific surface area (SSA) is used in catalysis, adsorbents and other applications. This study presents a novel method of preparing high surface area FAA via a phase evolution from gibbsite through ammonium aluminum carbonate hydroxide (AACH) to FAA. Thermodynamic calculations showed that increasing the pH and (NH4)2CO3 concentration both promoted the transformation of gibbsite to AACH. Fine gibbsite precipitated from a sodium aluminate solution could thus be efficiently changed to AACH and subsequently to FAA. Minimal particle aggregation was achieved from gibbsite to AACH to FAA owing to the filling of capillaries by NH3 and CO2, the formation of boehmite and interfacial hydrophobicity. Furthermore, capillary pressures of 1.25–46.56 MPa during the AACH roasting process prevented the collapse of mesopores. The high capillary pressure, numerous open mesopores, and inhibition of aggregation produced FAA with an extremely high SSA. The SSA of FAA was as high as 1088.72 m2 g−1 following the roasting of AACH at 300 °C for 180 min. This FAA was demonstrated to remove phosphate from wastewater with an adsorption capacity of 300.28 mg g−1.
1 Introduction
γ-Al2O3 is widely used in catalysts, catalyst supports, wastewater purification, gas separation, automobile exhaust emission reduction systems and flue gas cleaning.1 As many of those applications depend on a large specific surface area (SSA), increasing the SSA of active alumina is an important research challenge.Because the SSA of fine alumina is often less than 250 m2 g−1, the SSA is typically increased by preparing nano-alumina as well as by regulating the pore structure of the material. Various methods have been developed for the preparation of nano-alumina, including chemical vapor deposition,2 mechanical grinding,3 chemical pyrolysis,4 wet sol–gel,5,6 microemulsion,7 precipitation8–10 and hydrothermal synthesis.11 Among these, the wet method has been extensively investigated owing to its low cost, simplicity and ready industrial application. However, the unavoidable aggregation of nano-particles during precipitation from solution as well as during drying or roasting can greatly increase the particle size. Hence, various additional processes to inhibit aggregation have also been reported. In those approaches, an Al(OH)3 or AlOOH precursor is first carefully prepared, such as by diluting a more concentrated solution,12 modifying the solvent properties of a solution via the addition of organic solvents,13,14 adding a surfactant or chelator,15 modifying the particle surfaces16 or coating the particle surfaces.17 Various approaches, including azeotropic distillation,18 freeze-drying,19 supercritical drying20 and surface modification,21 are subsequently applied during drying or roasting (calcining) of the precursor. Additionally, the pore structure (pore size, pore volume) can be tuned so as to increase the SSA, such as surfactants,5,6 templates,22–25 coupling templates26 or pore-expanding agents.27–29 Those techniques increase the SSA of nano-alumina to the range of 200 to 700 m2 g−1. Even so, such methods are expensive and tend to generate large amounts of high salinity waste water. Meanwhile, the fine active alumina (FAA) can be prepared in an economically friendly, economical manner using a sodium aluminate solution, which leads to less aggregation compared to nanoparticles,30 although the low SSA of this material (<300 m2 g−1) limits its applications. Therefore, a green, economical methods of synthesizing FAA have a high SSA (>500 m2 g−1) is required.
Ammonium aluminum carbonate hydroxide (AACH) is often used as a precursor for FAA production. AACH, in turn, is typically prepared by adding ammonium bicarbonate to an aluminum sulphate solution.31 This process generates a large amount of wastewater containing (NH4)2SO4. If AACH could be generated from gibbsite rather than amorphous aluminum hydroxide, an inexpensive sodium aluminate solution could be used to prepare FAA via a precipitation process that does not generate wastewater. Trimm et al. demonstrated that AACH can be synthesized from fine amorphous aluminum hydroxide by pumping CO2 into a dilute sodium aluminate solution. This material was found to have a low SSA (from 200 to 300 m2 g−1) after the roasting process.32,33 However, there have been few reports of AACH synthesis using gibbsite. Furthermore, FAA with a high SSA of over 500 m2 g−1 is expected to be obtained from a sodium aluminate solution without wastewater.
In the present study, an inexpensive sodium aluminate solution was used to prepare FAA by promoting a sequential phase evolution from gibbsite to AACH to FAA. The feasibility of changing gibbsite to AACH in an ammonium carbonate solution was initially examined based on thermodynamic calculations. The phase evolution process, along with the resultant particle size distribution (PSD), particle morphology and pore structure, were subsequently characterized by X-ray diffraction (XRD), PSD analysis, scanning electron microscopy (SEM), transmission electron microscopy (TEM) and N2 adsorption–desorption isotherms. The mechanism associated with the formation of FAA with a high SSA was also studied in detail. In addition, the FAA resulting from this process was employed to remove phosphate from wastewater. The results demonstrate a novel green process for the preparation of FAA with a high SSA and also improve our understanding of the mechanism by which particle aggregation is inhibited.
2 Experiment
2.1 Experimental materials
Sodium aluminate solution with αk 1.45 (molar ratio of caustic soda Na2O to alumina Al2O3 in sodium aluminate solution) was prepared with aluminum hydroxide and sodium hydroxide (Xilong Chemical Co., Ltd.). H2O2, (NH4)2CO3, NH3 ˙H2O and CH3CH2OH (Sinopharm Chemical Reagent Beijing Co., Ltd, China), as well as reagents used in analysis were of analytical purity.2.2 Experimental
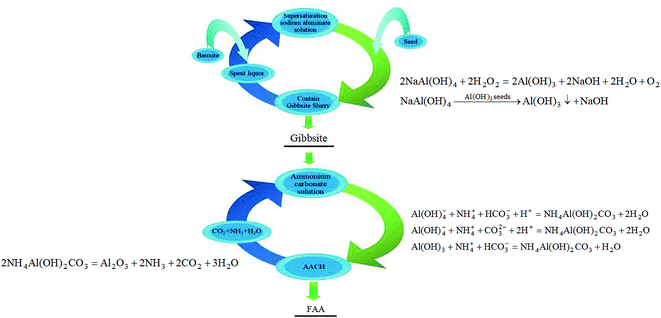 | ||
| Fig. 1 The green economical approach to prepare FAA with high specific surface area from sodium aluminate solution (containing reaction equation). | ||
In Fig. 1, the spent liquor (spent sodium aluminate solution) is used to dissolve aluminum hydroxide or bauxite, and the fine gibbsite is then precipitated from the supersaturated sodium aluminate solution, in which caustic soda is recycled. In addition, CO2 and NH3, decomposed from AACH, are transformed into (NH4)2CO3 solution, and AACH is then formed in (NH4)2CO3 solution. CO2 and NH3 are also recycled. Therefore, no wastewater and gas will be discharged during the preparation of FAA from sodium aluminate solution.
2.3 Characterization and methods
 | (1) |
 | (2) |
3 Results and discussion
3.1 Transformation from gibbsite to AACH
Gibbsite can be economically precipitated from the supersaturated sodium aluminate solution relative to preparation of amorphous Al(OH)3 by neutralization or hydrolysis. Thus, the possibility of gibbsite changing into AACH was firstly examined through thermodynamic calculation, and the transformation was then verified by experiments.| Substances | AlO2− | Al(OH)4− | Al(OH)3 | AlOOH | NH4+ | HCO3− | CO32− |
| ΔfGθ/(kJ mol−1) | −827.48 | −1305.7 | −1154.01 | −1831.51 | −79.5 | −586.77 | −527.98 |
| Serial number | Ions reaction equation | lg![[thin space (1/6-em)]](https://www.rsc.org/images/entities/char_2009.gif) K K |
|---|---|---|
a lg![[thin space (1/6-em)]](https://www.rsc.org/images/entities/char_2009.gif) K for eqn (8)–(12) are obtained according to the following equation ΔGθ298 = −RT K for eqn (8)–(12) are obtained according to the following equation ΔGθ298 = −RT![[thin space (1/6-em)]](https://www.rsc.org/images/entities/char_2009.gif) ln ln![[thin space (1/6-em)]](https://www.rsc.org/images/entities/char_2009.gif) K. K. |
||
| (1) | AlO2− + H+ + H2O = Al(OH)3 | 15.66 |
| (2) | Al(OH)4− + H+ = Al(OH)3 + H2O | 14.97 |
| (3) | Al(OH)4− + H+ = AlOOH + 2H2O | 15.19 |
| (4) | (NH4)2CO3 + H+ = 2NH4+ + HCO3− | 0.99 |
| (5) | HCO3− = H+ + CO32− | 10.33 |
| (6) | NH3·H2O = NH4+ + OH− | 9.24 |
| (7) | H+ + OH− = H2O | 14.00 |
| (8) | Al(OH)4− + NH4+ + HCO3− + H+ = NH4Al(OH)2CO3 + 2H2O | 16.38 |
| (9) | Al(OH)4− + NH4+ + CO32− + 2H+ = NH4Al(OH)2CO3 + 2H2O | 27.03 |
| (10) | Al(OH)3 + NH4+ + HCO3− = NH4Al(OH)2CO3 + H2O | 4.34 |
| (11) | Al(OH)3 + NH4+ + CO32− + H+ = NH4Al(OH)2CO3 + H2O | 14.99 |
| (12) | NH4Al(OH)2CO3 = AlOOH + NH4+ + HCO3− | 0.155 |
Ammonium exists in the form of NH3, NH4+ and NH4Al(OH)2CO3 in the system of gibbsite (Al(OH)3) changing into AACH (NH4Al(OH)2CO3). The total concentration of ammonium in the solution, denoted as [N]T, was expressed in the following eqn (13) on the basis of the mass balance and reaction formula.
| [N]T = [NH3] + [NH4+] + [NH4Al(OH)2CO3] | (13) |
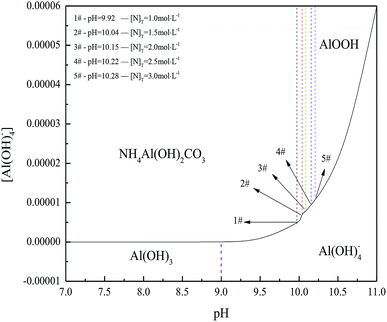
As solubility of aluminum hydroxide is minimal in the weakly alkaline (NH4)2CO3 solution, little Al(OH)4− exists in the solution. Meanwhile, no corresponding activity coefficient in the (NH4)2CO3 solution was reported. Therefore, the ion activity was nearly equal to its concentration. Based on the equilibrium reactions (8)–(12) and mass balance (13), Fig. 2 presents the dependence of [N]T on pH at 298.15 K.
Results in Fig. 2 indicated that NH4Al(OH)2CO3 could be formed at a pH range from 9.92 to 10.28. Furthermore, raising pH and (NH4)2CO3 concentration widened the region of NH4Al(OH)2CO3 and narrowed the region of AlOOH. Meanwhile, increasing total (NH4)2CO3 concentration benefitted Al(OH)3 or Al(OH)4− transformation into NH4Al(OH)2CO3 and limited the formation of AlOOH. However, NH4Al(OH)2CO3 could be changed into AlOOH or Al(OH)4− in concentrated alkaline solution.
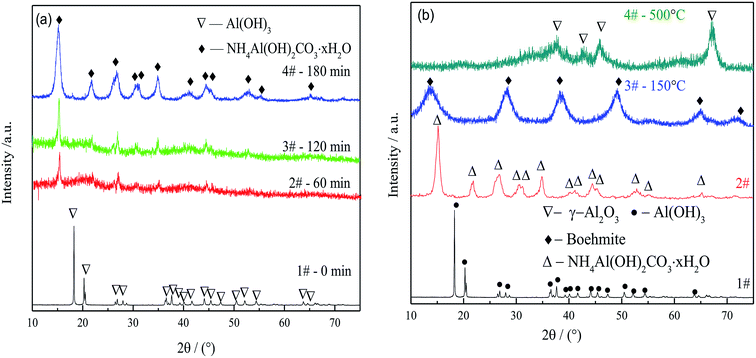
Fig. 3(b) shows the phase evolution from gibbsite through AACH and boehmite to FAA. Boehmite (PDF no. 21-1307) was observed during the roasting of AACH at 150 °C, and active alumina γ-Al2O3 (PDF no. 04-0880) was produced during roasting at 500 °C for 180 min. The γ-Al2O3 evidently had a low degree of crystallization and contained defect sites and high reactive sites, as demonstrated by the broad diffraction peaks in Fig. 3(b), pattern 3.42 Those data demonstrate that γ-Al2O3 is successfully produced by phase evolution from gibbsite to AACH and FAA.
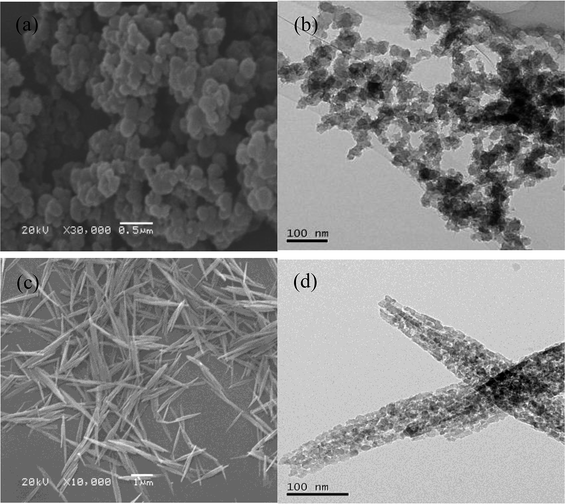
Thus, particle aggregation during the transformation from gibbsite through AACH to FAA was effectively inhibited. This process allows the economical, environmentally friendly preparation of FAA from a sodium aluminate solution, based on recycling of the spent sodium aluminate solution and the decomposition gases NH3, and CO2 produced during the roasting step.
3.2 Pore structure of FAA
The pore structure (pore size, pore volume, and open or closed pore) of the FAA, which is related to its SSA, is affected by the roasting process. Thus, the effects of both the roasting temperature and heating rate were investigated, with the aim of minimizing the particle aggregation.In Fig. 6, similar TG-DTA curves were acquired at heating rates of 5, 10 and 20 °C min−1. However, increasing the heating rate shifted the onset of thermal decomposition from 195.27 to 201.47 to 219.92 °C, while reducing the extent of mass loss. There results suggest that a greater volume of gas will be released per unit time when applying a more rapid heating during the roasting of AACH. A strong endothermic peak appears at 200 °C in each curve, attributed to the formation of boehmite as an intermediate (in Fig. 3(b)). Increasing the heating rate may accelerate the formation of boehmite because a mass losses of 56.03 wt% occurred at 20 °C min−1 comparison to 56.83 wt% in the form of boehmite from AACH. Moreover, a 1.55–1.85 wt% mass loss was observed above 500 °C, owing to the formation of γ-Al2O3.43 From those results, the AACH appears to have decomposed according to the following series of reactions.
AlOOH was interestingly found during the transformation of AACH into FAA. Its surface property and water mass loss differed from those of Al(OH)3(2Al(OH)3 = Al2O3 + 3H2O),44,45 formation of boehmite may mitigate the hard aggregation of particles in roasting process.
| 1#-Al(OH)3 | 2#-AACH | 3#-boehmite | 4#-FAA-R2 | 5#-FAA-R3 | 6#-FAA-R4 | 7#-FAA-R5 | 8#-FAA-R8 | |
|---|---|---|---|---|---|---|---|---|
| a 0.2 g sample was pressed into a thin tablet under 20 MPa for 1 min.47 1#-Al(OH)3, 2#-AACH, 3#-boehmite, roasting AACH at 150 °C for 180 min, 4#-FAA-R2, roasting AACH at 200 °C for 180 min, 5#-FAA-R3, roasting AACH at 300 °C for 180 min, 6#-FAA-R4, roasting AACH at 400 °C for 180 min, 7#-FAA-R5, roasting AACH at 500 °C for 180 min, 8#-FAA-R8, roasting AACH at 800 °C for 180 min. | ||||||||
| Roasting temperature (°C) | — | — | 150 | 200 | 300 | 400 | 500 | 800 |
| θ1 (glycerol, °) | 63.78 | 62.71 | 50.23 | 47.55 | 30.14 | 27.30 | 15.45 | 14.37 |
| θ2 (diiodomethane, °) | 38.92 | 36.59 | 36.95 | 27.19 | 23.09 | 21.62 | 14.28 | 13.52 |
| θ3 (water, °) | 28.34 | 30.82 | 33.79 | 53.45 | 25.14 | 22.62 | 20.73 | 18.10 |
| γs (mJ m−2) | 40.26 | 41.37 | 44.67 | 47.81 | 44.82 | 44.93 | 45.50 | 61.97 |
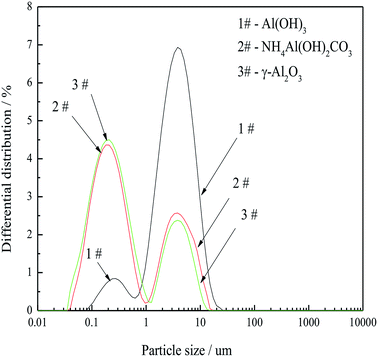
The results in Table 3 indicated that the contact angles tended to vary significantly when glycerol, diiodomethane and water were acted as the liquid phase. Elevating the temperature gradually decreased the contact angle with glycerol, while the contact angles of AACH and boehmite remained nearly constant with diiodomethane. In contrast, the contact angle initially increased and then decreased with increasing temperature when using water (Table 3 (θ3)). These data suggest that the hydrophobicity increases in the order of AACH > boehmite > FAA, thereby preventing particle aggregation. In addition, the solid surface energy remained essentially constant at roasting temperatures ranging from 150 to 500 °C but significantly increased at 800 °C. This finding is in agreement with the minimal increase in particle size on going from AACH to FAA (Fig. 4). This finding reveals that the interface energy of the powder is dependent on particle size.
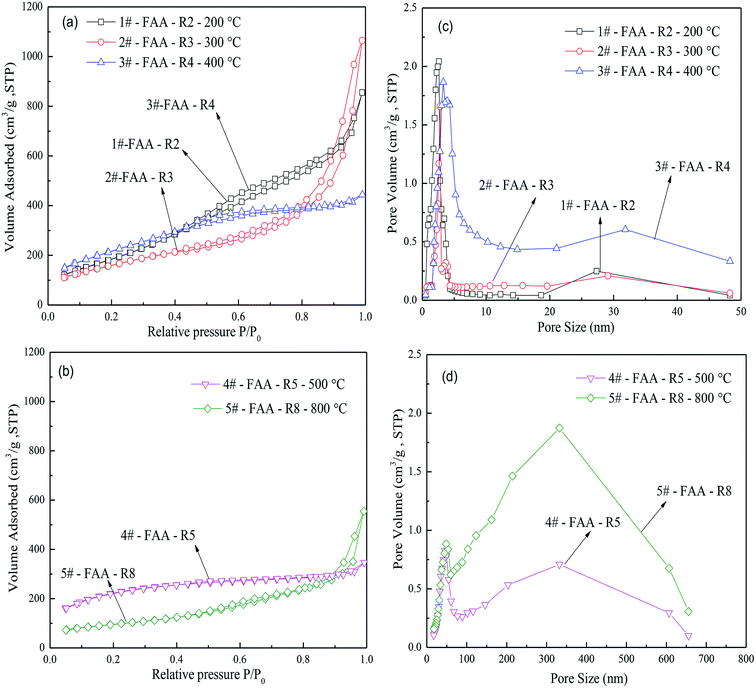
Fig. 7(a) and (b) present the N2 adsorption–desorption isotherms of FAA roasted at various temperatures. Type IV curves were obtained at 200, 300 and 800 °C, as well as type H1 hysteresis loop according to the IUPAC classification system, confirming the presence of open mesopores. In contrast, type I curves were generated by the AACH roasted at 400 and 500 °C, primarily due to the presence of (NH4)2CO3 in water in the capillaries. These samples also produced type H4 hysteresis loops consistent with narrow pores.
In Fig. 7(c) and (d), two peaks of pore diameter size were found. Numerous mesopores and few macropores in FAA would promote its functioning as an adsorbent because there pores can provide efficient transportation pathways to molecules.49–51 Increasing the temperature from 200 to 800 °C enlarged the pore diameters, while smaller pores (2–30 nm) were correspondingly disappeared. There results suggest that smaller pores are preferentially destroyed during thermal decomposition of the AACH, and that the appearance of large pores can be inhibit particle aggregation due to great capillary pressure.
![[thin space (1/6-em)]](https://www.rsc.org/images/entities/char_2009.gif) cos
cos![[thin space (1/6-em)]](https://www.rsc.org/images/entities/char_2009.gif) θ/r, using the data in Tables 3 and 4, as well as in Fig. 6 and 7. Capillary pressures (dynamic pressure) were also calculated using the van der Waals equation of state, based on the data in Fig. 6(c). Fig. 8 plots the capillary pressures as functions of the roasting temperature.
θ/r, using the data in Tables 3 and 4, as well as in Fig. 6 and 7. Capillary pressures (dynamic pressure) were also calculated using the van der Waals equation of state, based on the data in Fig. 6(c). Fig. 8 plots the capillary pressures as functions of the roasting temperature.
| Samples | Temperature (°C) | Surface area (BET) (m2 g−1) | Total pore volume (cm3 g−1)a | Average pore diameter (nm)b | |||
|---|---|---|---|---|---|---|---|
| Rapid heating ratec | Slow heating rated | Rapid heating rate | Slow heating rate | Rapid heating rate | Slow heating rate | ||
| a Single point total pore volume of pores at P/P0 = 0.99.b Estimated using the BJH desorption branch of the isotherm.c Rapid heating rate: sample was roasted by a rapid heating rate (20 °C min−1) from 200 °C to a given temperature in muffle furnace.d Slow heating rate: sample was roasted according to heating rate of 5 °C min−1 from 100 °C to in muffle furnace. | |||||||
| 1#-FAA-R2 | 200 | 982.52 | 771.41 | 0.55 | 0.28 | 2.44 | 2.54 |
| 2#-FAA-R3 | 300 | 1088.72 | 925.61 | 0.56 | 0.45 | 2.80 | 2.85 |
| 3#-FAA-R4 | 400 | 813.23 | 618.68 | 1.32 | 0.54 | 7.17 | 4.43 |
| 4#-FAA-R5 | 500 | 722.59 | 552.77 | 1.65 | 0.55 | 102.03 | 4.71 |
| 5#-FAA-R8 | 800 | 336.43 | 241.24 | 1.85 | 0.58 | 109.59 | 5.73 |
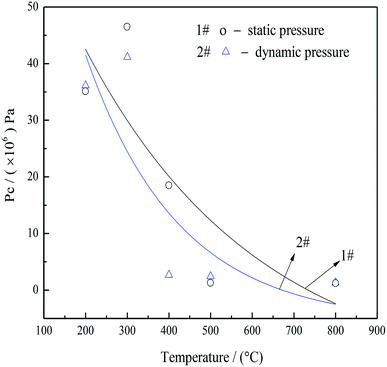 | ||
Fig. 8 Static (1#)a and dynamic (2#)b capillary pressure in pore structures as functions of roasting temperatures. aCalculated according to the equation, Pc = 2σ![[thin space (1/6-em)]](https://www.rsc.org/images/entities/char_2009.gif) cos cos![[thin space (1/6-em)]](https://www.rsc.org/images/entities/char_2009.gif) θ/r.52 Where Pc is the capillary pressure (Pa), σ is the interfacial tension of the interface (mN m−1), θ is the contact angle (°), r is the pore diameter size (m). bCalculated according to the equation, (P + a/V02)(V0 − b) = RT.53,54 Where P is the gas pressure (Pa), a and b are species-dependent critical parameters, V0 is a gas of the molar volume (L), R is the gas constant (R = 8.314 J (mol K)−1), T is the real temperature (°C). V0 was calculated according to mass loss in Fig. 6(c). θ/r.52 Where Pc is the capillary pressure (Pa), σ is the interfacial tension of the interface (mN m−1), θ is the contact angle (°), r is the pore diameter size (m). bCalculated according to the equation, (P + a/V02)(V0 − b) = RT.53,54 Where P is the gas pressure (Pa), a and b are species-dependent critical parameters, V0 is a gas of the molar volume (L), R is the gas constant (R = 8.314 J (mol K)−1), T is the real temperature (°C). V0 was calculated according to mass loss in Fig. 6(c). | ||
There data showed that the capillary pressure was reduced from 46.56 to 2.65 MPa when the roasting temperature was increased from 200 to 400 °C, because large amounts of NH3 and CO2 filled the mesopores after decomposition of the AACH. Accordingly, the high capillary pressure prevented mesopore from collapse, leading to minimal particle aggregation and numerous open mesopores. Although the heating rate of the thermal analysis instrument (SDT-2960) was limited, additional increases in the heating rate would be expected to further increase the amount of gas released per unit time. Consequently, the pressure in the capillary (as shown in curve 1 in Fig. 8) was increased (relative to that in curve 2 in Fig. 8). Thus, a rapid heating rate, favoring the inhibition of particle aggregation, was adopted in the following experiments.
In addition, the NH3 gas generated in this process produced a weakly alkaline solution in the capillary that was conducive to the formation of AlOOH (Fig. 1) instead of Al(OH)3. The data in Table 3 also showed that boehmite was more hydrophobic than gibbsite (Al(OH)3) (In Table 3 θAlOOH = 33.79° > θAl(OH)3 = 28.34°). This finding suggests that the formation of boehmite contributes to the inhibition of aggregation during the AACH roasting process.
Elevating the temperature (in Table 4) increased the average pore size and pore volume of the FAA, while reducing the BET surface area. A rapid heating rate also significantly increased the FAA surface area and total pore volume relative to those obtained using a low heating rate of 5 °C min−1. Surprisingly, the maximum alumina BET surface area was 1088.72 m2 g−1 at 300 °C when applying a rapid heating rate. This value is much greater than values obtained for nano-alumina produced by sol–gel, neutralization or hydrolysis.20 Roasting the AACH for 180 min at a rapid heating rate achieved SSA values of 722.59 and 336.43 m2 g−1 at 500 and 800 °C, respectively, both of which are also significantly greater than values for fine alumina and nano-alumina.21,22 There data demonstrate that the heating rate is closely correlated with the pore structure, total pore volume and average pore diameter.
Based on the above, FAA having a d(50) of 0.417 μm with a super-high SSA, a large amount of open mesopores and minimal aggregation is attributed to high capillary pressure, the formation of boehmite as an intermediate and the low surface energy of the particles.
3.3 Efficient removal of phosphate from wastewater with FAA
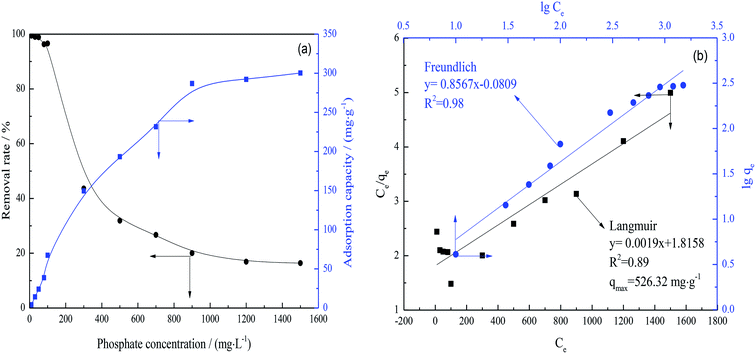
The as-prepared FAA, having plentiful open mesopores, represents an excellent adsorbent for the purification of wastewater. Thus, this FAA was used to efficiently remove phosphate from wastewater. Fig. 9(a) presents the removal rates and adsorption capacities for various solutions, while Fig. 9(b) plots the fitting of the data based on isothermal Langmuir and Freundlich adsorption models.Fig. 9(a) confirmed that the adsorption capacity of the FAA increased rapidly along with the phosphate concentration at concentrations less than 900 mg L−1 and then increased slowly. There data suggest that the phosphate uptake was primarily due to physisorption rather than chemisorption. Increases in the phosphate concentration at a constant FAA load reduced the removal rate. The FAA was found to exhibit an absorption capacity of 300.28 mg g−1 at equilibrium, significantly greater than the 49.67 mg g−1 achieved with nano-alumina.55
From Fig. 9(b), the data were in well agreement with the Freundlich isotherm model,56,57 suggesting that multilayer and monolayer adsorption occur simultaneously on the FAA surface. The maximum theoretical phosphate adsorption capacity for the FAA was 526.32 mg g−1 according to the qm calculated from the Langmuir model. The efficient adsorption of phosphate by this material is attributed to its high SSA and plentiful open mesopores. These data also suggest that this FAA could be employed for the efficient purification of wastewater.
4 Conclusions
(1) FAA was prepared via a green, economical process involving phase evolution from gibbsite through AACH to FAA. Increase in both the pH and (NH4)2CO3 concentration promoted the transition of gibbsite to AACH. In this process, fine gibbsite was precipitated from a saturated sodium aluminate solution, followed by AACH preparation from a (NH4)2CO3 solution and the subsequent synthesis of FAA by roasting the AACH.(2) The particle size remained nearly unchanged in the transformation from gibbsite to AACH to FAA. However, increasing the roasting temperature increased the average pore diameter and pore volume while reducing the SSA. A rapid heating rate increased the BET surface area and pore volume, such that the FFA SSA reached 1088.72 m2 g−1 after heating at 300 °C for 180 min.
(3) The particle aggregation was effectively inhibited by the formation of boehmite as an intermediate and by the interface hydrophobicity and high capillary pressure during phase evolution from gibbsite to AACH to FAA. High capillary pressure, plentiful open mesopores and inhibition of aggregation all contributed to the super-high SSA of the FAA.
(4) The adsorption capacity of the FAA for phosphate from wastewater was as high as 300.28 mg g−1, which reflects the high SSA and open mesopores of this material.
Conflicts of interest
There are no conflicts to declare.Acknowledgements
The authors gratefully acknowledge the financial support from the National Natural Science Foundation of China (No. 51874366), and project (FA2017029) supported by Science and Technology Program of Chongzuo, China.References
- R. Lafficher, M. Digne, F. Salvatori, M. Boualleg, D. Colson and F. Puel, J. Cryst. Growth, 2017, 468 Search PubMed.
- E. Boresella, S. Botti, R. Giorgi, S. Martelli, S. Turtù and G. Zappa, Appl. Phys. Lett., 1993, 63(10), 1345–1347 CrossRef.
- Z. R. Hesabi, H. R. Hafizpour and A. Simchi, J. Mater. Sci. Eng. A, 2007, 454(16), 89–98 CrossRef.
- X. Shi, C. Yang, L. Zhang, Z. Lu, Y. Zhu, D. Y. Tang, C. Cui and H. B. Zeng, J. Nanomater., 2014,(14), 1 Search PubMed.
- J. Aguado, J. M. Escola, M. C. Castro and B. Paredes, Microporous Mesoporous Mater., 2005, 83(1), 181–192 CrossRef CAS.
- G. Lee, C. Chen, S. T. Yang and W. S. Ahn, Microporous Mesoporous Mater., 2010, 127(1), 152–156 CrossRef CAS.
- E. Ponthieu, E. Payen and J. Grimblot, J. Non-Cryst. Solids, 1992, 147–148, 598–605 CrossRef CAS.
- M. Yada, M. Machida and T. Kijima, Chem. Commun., 1996, 36(6), 769–770 RSC.
- M. Yada, H. Hiyoshi, K. Ohe, M. Machida and T. Kijima, Inorg. Chem., 1997, 36(24), 5565–5569 CrossRef CAS.
- M. Yada, H. Kitamura, M. Machida and T. Kijima, Langmuir, 1997, 13(20), 5252–5257 CrossRef CAS.
- Y. Chang, Z. Ling, Y. Li and X. Hu, Electrochim. Acta, 2013, 93, 241–247 CrossRef CAS.
- X. Liu, Y. Wei, D. Jin and W. H. Shih, Mater. Lett., 2000, 42(3), 143–149 CrossRef CAS.
- W. El-Nadjar, M. Bonne, E. Trela, L. Rouleau, A. Mino, S. Hocine, E. Payen, C. Lancelot, C. Lamonier, P. Blanchard, X. Courtois, F. Can, D. Duprez and S. Royer, Microporous Mesoporous Mater., 2012, 158(8), 88–98 CrossRef CAS.
- W. Deng, M. W. Toepke and B. H. Shanks, Adv. Funct. Mater., 2010, 13(1), 61–65 CrossRef.
- H. C. Lee, H. J. Kim, H. R. Chang, H. L. Kyung, J. S. Lee and S. H. Chung, Microporous Mesoporous Mater., 2005, 79(1), 61–68 CrossRef CAS.
- H. Fischer, C. Niedhart, N. Kaltenborn, A. Prange, R. Marx, F. Niethard and R. Telle, Biomaterials, 2005, 26(31), 6151–6157 CrossRef CAS PubMed.
- N. Kaltenborn, M. Sax, F. A. Müller, L. Müller, H. Dieker, A. Kaiser, R. Telle and H. Fischer, J. Am. Ceram. Soc., 2010, 90(5), 1644–1646 CrossRef.
- W. Q. Cai, H. Q. Li and Y. Zhang, Mater. Chem. Phys., 2006, 96(1), 136–139 CrossRef CAS.
- W. Ling and I. K. Lloyd, J. Am. Ceram. Soc., 2010, 74(11), 2934–2936 Search PubMed.
- T. M. Sullivan, US Pat., 5238669 A, 1993.
- L. Bokobza and J. P. Chauvin, Polymer, 2005, 46(12), 4144–4151 CrossRef CAS.
- H. C. Lee, H. J. Kim, H. R. Chang, K. H. Lee, J. S. Lee and S. H. Chung, Microporous Mesoporous Mater., 2005, 79(1), 61–68 CrossRef CAS.
- Y. Li, J. Liu and Z. Jia, Mater. Lett., 2006, 60(29), 3586–3590 CrossRef CAS.
- Z. Zhu, H. Liu, H. Sun and D. Yang, Microporous Mesoporous Mater., 2009, 123(1), 39–44 CrossRef CAS.
- J. C. Ray, K. S. You, J. W. Ahn and W. S. Ahn, Microporous Mesoporous Mater., 2007, 100(1–3), 183–190 CrossRef CAS.
- J. H. Kim, K. Y. Jung, K. Y. Park and S. B. Cho, Microporous Mesoporous Mater., 2010, 128(1–3), 85–90 CrossRef CAS.
- N. Cruise, K. Jansson and K. Holmberg, J. Colloid Interface Sci., 2001, 241(2), 527–529 CrossRef CAS.
- M. I. F. Macêdo, C. C. Osawa and C. A. Bertran, J. Sol-Gel Sci. Technol., 2004, 30(3), 135–140 CrossRef.
- B. Xu, T. Xiao, Z. Yan, X. Sun, J. Sloan, S. L. González-Cortés, F. Alshahrani and M. L. H. Green, Microporous Mesoporous Mater., 2006, 91(1), 293–295 CrossRef CAS.
- G. H. Liu, G. Y. Wu, W. Chen, X. B. Li, Z. H. Peng, Q. S. Zhou and T. G. Qi, Hydrometallurgy, 2018, 176, 253–259 CrossRef CAS.
- O. Yong-Taeg, S. W. Kim and D. C. Shin, Colloids Surf., A, 2008, 313(9), 415–418 Search PubMed.
- E. R. Mardis, L. Ding, M. D. Mclellan and K. Chen, N. Engl. J. Med., 2009, 361(11), 1058–1066 CrossRef CAS PubMed.
- D. L. Trimm and A. Stanislaus, Appl. Catal., 1986, 21(2), 215–238 CrossRef CAS.
- J. Xie, Y. Lin, C. Li, D. Wu and H. Kong, Powder Technol., 2015, 269(4), 351–357 CrossRef CAS.
- P. Bénézeth, D. A. Palmer, L. M. Anovitz and J. Horita, Geochim. Cosmochim. Acta, 2007, 71(18), 4438–4455 CrossRef.
- G. Stoica and J. Pérez-Ramírez, Geochim. Cosmochim. Acta, 2010, 74(24), 7048–7058 CrossRef CAS.
- D. D. Wagman, W. H. Evans, V. B. Parker, R. H. Schumm, I. Har-Low, S. M. Bailey, K. L. Churney and R. L. Nuttall, J. Phys. Chem. Ref. Data, 1989, 11(suppl. 2) Search PubMed.
- B. S. Hemingway, R. A. Robie and J. A. Kittrick, Geochim. Cosmochim. Acta, 1978, 42(10), 1533–1543 CrossRef CAS.
- K. Kawazuishi and J. M. Prausnitz, Ind. Eng. Chem. Res., 1987, 26(7), 1482–1485 CrossRef CAS.
- Q. Zhao, S. Wang, F. Qin and C. Chen, Ind. Eng. Chem. Res., 2011, 50(9), 5316–5325 CrossRef CAS.
- H. Katsumi, M. Nishikawa, F. Yamashita and M. Hashida, J. Ceram. Soc. Jpn., 2010, 98(1137), 444–449 Search PubMed.
- T. Oikawa, Y. Masui, T. Tanaka, Y. Chujo and M. Onaka, J. Organomet. Chem., 2007, 692(1–3), 554–561 CrossRef CAS.
- Z. Wu, Y. Shen, Y. Dong and J. Jiang, J. Alloys Compd., 2010, 467(1), 600–604 Search PubMed.
- S. Melis, M. Verduyn, G. Storti, M. Morbidelli and J. Bałdyga, AIChE J., 1999, 45(7), 1383–1393 CrossRef CAS.
- J. P. Hsu and B. T. Liu, J. Colloid Interface Sci., 1998, 198(1), 186–189 CrossRef CAS.
- D. K. Owens and R. C. Wendt, J. Appl. Polym. Sci., 1969, 13(8), 1741–1747 CrossRef CAS.
- X. B. Li, L. Yan, D. F. Zhao, Q. S. Zhou, G. H. Liu, Z. H. Peng, S. S. Yang and T. G. Qi, Trans. Nonferrous Met. Soc. China, 2013, 23(5), 1472–1479 CrossRef CAS.
- B. M. Yu, Adv. Mech., 2003, 33(3), 333–340 Search PubMed.
- J. Ji, X. Z. Duan, G. Qian, X. G. Zhou, G. S. Tong and W. K. Yuan, Int. J. Hydrogen Energy, 2014, 39(24), 12490–12498 CrossRef CAS.
- A. A. Taromi and S. Kaliaguine, Appl. Catal., A, 2018, 558, 140–149 CrossRef.
- M. Thommes, K. Kaneko, A. V. Neimar k, J. P. Olivier, F. Rodriguez-Reinoso, J. Rouquerol and K. S. W. Sing, Pure Appl. Chem., 2016, 38(1), 25 Search PubMed.
- M. J. Readey, R. R. Lee, J. W. Halloran and A. H. Heuer, J. Am. Ceram. Soc., 2010, 73(6), 1499–1503 CrossRef.
- S. M. Hassanizadeh and W. G. Gray, Water Resour. Res., 1993, 29(10), 3389–3405 CrossRef.
- D. Y. Peng and D. B. Robinson, Minerva Ginecol., 1976, 12(11–12), 3069–3078 Search PubMed.
- J. W. Choi, S. Y. Lee, S. H. Lee, J. E. Kim, K. Y. Park, D. J. Kim and S. W. Hong, Water, Air, Soil Pollut., 2012, 223(6), 2881–2890 CrossRef CAS.
- S. Mor, K. Chhoden, P. Negi and K. Ravindra, Environmental Nanotechnology, Monitoring and Management, 2017,(7), 15–23 CrossRef.
- T. Liu, K. Wu and L. Zeng, J. Hazard. Mater., 2012,(217–218), 29–35 CrossRef PubMed.
| This journal is © The Royal Society of Chemistry 2019 |

