DOI:
10.1039/C8RA09843C
(Paper)
RSC Adv., 2019,
9, 4203-4209
Pore structure control of porous carbon obtained from phenol formaldehyde resin and ethylene glycol: the effect of H3BO3 on the pore structure
Received
30th November 2018
, Accepted 21st January 2019
First published on 31st January 2019
Abstract
Boric acid was used as a source of complexing agent to change phase separation kinetics and dynamics of the resin-glycol system to regulate the pore structure of porous carbon. The results show that the addition of H3BO3 in the resin mixtures can change the polymerization dynamics during curing of resin-glycol mixtures. For the complexation of H3BO3 to diols, the size of the ethylene glycol-rich phase produced during the curing of the resin mixture increase with the increase of the content of H3BO3. Similarly, the pore size of porous carbon after pyrolysis increases with the increase of H3BO3 content. The average pore size of resulting porous carbon can be regulated in the range from 15 to 2754 nm. These results reveal that H3BO3 exhibited obvious effects in changing the pore structure of resin-glycol system during pyrolysis.
1. Introduction
As a carbon functional material with excellent pore structure, the porous carbon has excellent properties such as high porosity, good conductivity, controlled pore size and high specific surface area.1–3 So, it was widely employed in various fields, such as gas separation, water and air purification, adsorption materials, catalyst support, chromatography, supercapacitors and preparation of structural carbide ceramics.4–9 The application of porous carbon materials has a close relationship with its pore structure. For porous carbon in the field of supercapacitors, gas chromatography, etc., the pore size is required to be at the mesoporous size (2–50 nm). The novel macromolecular catalysts, conversion and separation materials, or porous carbons as preforms in the preparation of carbide ceramics, the pore size needs to be at the macrospore size (>50 nm). How to effectively control the pore structure of porous carbon is of great significance, especially in the field of preparation of carbide ceramics. Hucke10 obtained a porous full carbon billet by high temperature cracking of high molecular polymer and obtained dense silicon carbide ceramic after siliconizing. Studies have shown that the pore structure of porous carbon has a great influence on the process of silicon infiltration, so it is necessary to precisely control the pore structure of porous carbon.
At present, many methods have been used to prepare porous carbon materials such as hard/soft template method,11,12 activation method,9 and polymerization-induced phase separation (PIPS).13–18 In comparison, PIPS has a lot of advantages such as low manufacturing cost, simple technology process, and easy to industrialize. The process of PIPS is described as follows: the initial homogeneous solution of a non-reactive component (NRC) in reactive monomers (RM) will occur phase separation during polymerization of RM. After phase separation process, there are only polymerized RM-rich phase and an NRC-rich phase. The porous materials can be obtained by the removed of the NRC-rich phase and pyrolyzed of polymerized RM-rich phase to form frameworks. Thus the pore structure of resulting porous carbon can be controlled by changing phase separation reaction kinetics and dynamics. In order to control the pore structure and pore size of porous carbons, adequate research of the polymerization process is very necessary. At present, many researchers have reported the preparation of porous carbon with controlled pore structure based on the PIPS method.13–18 Wang16 have systematically studied the effect of the process parameters on the pore structure of porous carbon which fabricated by finished sterol resin. Xu17 systematically investigated the effect of the ingredients of resin mixtures and the resin curing temperature on the pore structure of carbon monoliths which fabricated by phenol-formaldehyde resin (PF). The pore structure control of porous carbon is mainly related to the curing polymerization process of the organic resin.17 Zhang Y.13 and Yuan Z.14,21 have studied the effect of the resin system composition and curing agent on the pore structure of porous carbon. However, few studies addressed the possible relationship between the polymerization of the organic resin and pore structure of the carbonized product.
Boric acid has rapidly developed into a thriving research area.18 The complexation of boric acid with diols and their congeners has shown great promise to develop novel aryl boron-containing polymers with unusual properties, with borate linkages acting as inter-component bonds of supramolecular structures.19 Wang20 introduced aryl-boron structure into PF to improve their heat resistance. In this paper, H3BO3 was used as a source of complexing agent to change phase separation reaction kinetics and dynamics of the resin-glycol system to achieve the pore structure control of porous carbon. Compared to the previous report,13,14,17,21 our method is more effective. The addition of boric acid can achieve that the pore size of the resulting porous carbon material can be regulated in the range of nm to μm. The effect of H3BO3 content on the pore structure of the porous carbons has been systematically investigated.
2. Experimental procedures
2.1 Materials
The chemicals used for the synthesis of porous carbon materials were PF, ethyl alcohol (EG), H3BO3. PF (industrial level) were used as the carbon precursor. EG (AR, average molecular weight: 46.07) was employed as both the pore-forming agent and the solvent, and H3BO3 was used as the complexing agent.
2.2 Preparation of precursor solutions and porous carbons
The porous carbonaceous materials were synthesized by PIPS. The preparation process of porous carbons was shown in the following: PF, EG and H3BO3 were mixed by stirring mechanically at room temperature. Then the mixtures were poured into molds and successively held at 90 °C for 6 h for pre-curing. The rigid body was then post-cured to 200 °C from 90 °C and held for 8 h. Finally, the cured samples were carbonized under nitrogen atmosphere at 900 °C for 0.5 h. Six samples were prepared, with mass content of H3BO3 varying from 0 to 5 wt%, shown in Table 1. And the resulting porous carbon were identified as B-0–B-5, accordingly. Each H3BO3 loading be performed in triplicate with the deviation on values represented in the data.
Table 1 Effect of H3BO3 on the properties of porous carbons
| Sample |
H3BO3 content (%) |
Apparent porosity (%) |
Average pore size (nm) |
Bulk density (g cm−3) |
Vtotal/cm3 g−1 |
| B-0 |
0 |
25.6 ± 1.1 |
15 ± 5 |
1.18 ± 0.08 |
0.21 ± 0.07 |
| B-1 |
0.5 |
30.3 ± 3.6 |
25 ± 18 |
1.08 ± 0.05 |
0.28 ± 0.09 |
| B-2 |
1.5 |
54.2 ± 1.9 |
642 ± 15 |
0.74 ± 0.01 |
0.77 ± 0.02 |
| B-3 |
2.5 |
45.7 ± 2.7 |
1552 ± 38 |
0.79 ± 0.03 |
0.57 ± 0.03 |
| B-4 |
3.5 |
42.5 ± 1.3 |
2363 ± 54 |
0.79 ± 0.05 |
0.53 ± 0.05 |
| B-5 |
5 |
33.8 ± 1.5 |
2754 ± 66 |
0.86 ± 0.03 |
0.39 ± 0.02 |
2.3 Characterizations
The apparent porosity, bulk density, average pore size and pore size distributions were measured by a mercury porosimetry (AutoPoreIV 9510, USA). The microstructure of the post-cured bodies and carbonized products were analyzed using a field-emission scanning electron microscopy (FE-SEM; SU-8220, Hitachi, Japan) equipped with a dispersive energy spectrum (EDS). The weight loss and pyrolysis behaviors of the resin mixtures during polymerization were examined using a thermogravimetric analyzer (TGA/SDTA85IE, Switzerland) under an inert atmosphere. Phase analysis of the carbonized products was conducted by X-ray diffraction (XRD; D/Max-2250V, Rigaku, Tokyo, Japan). Weight and volume changes of the samples after curing and pyrolysis were obtained by the change in weight and volume between pre-curing bodies and carbonized products. Fourier transform infrared spectrum (FT-IR) of the cured bodies were recorded in a range of 2000–400 cm−1 with a NICOLET Is10 (USA) FTIR by potassium bromide.
3. Results and discussion
3.1 Interactions between resin mixtures and H3BO3
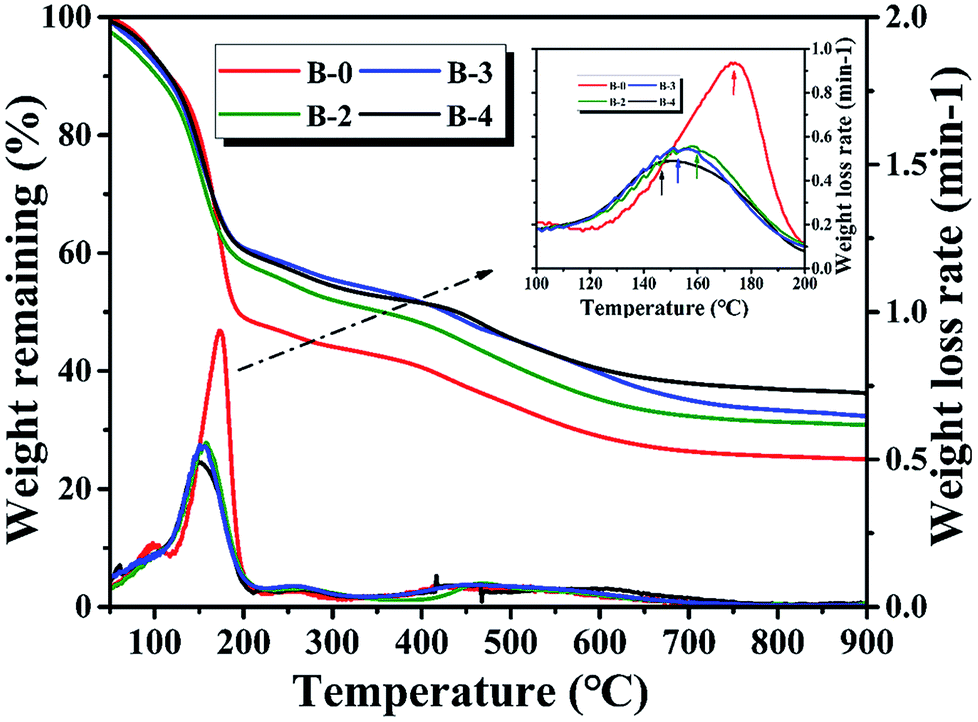
3.1.1. Thermogravimetric analysis. The TG curves of the resin mixtures with and without H3BO3 during carbonization are shown in Fig. 1. It is found that the weight loss rate of the resin mixture without H3BO3 during carbonization has three distinct peaks. The first and second peak at about 99 °C and 175 °C is due to the evaporation of H2O and continuous EG, respectively. The third peak at about 300–600 °C is mainly due to the evaporation of dispersed EG and pyrolysis of cured resins. When H3BO3 is added, there is a significant change in the first peak and the second peak. The first peak, appearing at about 60 °C, can be assigned to the reaction between hydroxymethyl phenol and H3BO3 to form some intermediates and water. As the H3BO3 content increases, the second peak shifts to a lower temperature point of 160 °C (B-2), 155 °C (B-3), and 147 °C (B-4), respectively. It is mainly due to the increase in the size of the continuous ethylene glycol phase, making EG easier to evaporate. It can be known from the TG curve that as the H3BO3 content increases, the remaining weight of the resin mixture at 900 °C gradually increases. These results reveal that the resin mixtures get higher thermal stability when H3BO3 is added.20,22
 |
| | Fig. 1 Influence of H3BO3 on weight loss curves and weight loss rate curves. | |
According to Xu,17 continuous and dispersed EG-rich phases were both formed during phase separation, and the continuous EG-rich phase was nearly removed during curing, while the dispersed one was removed during pyrolysis. The weight and volume change of samples with different content of H3BO3 after pyrolysis are shown in Fig. 2.
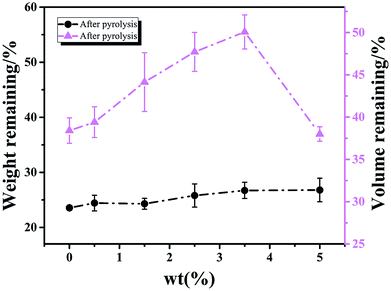 |
| | Fig. 2 The effect of H3BO3 on the weight and volume change of samples after curing and pyrolysis respectively. | |
It is clear that the remaining volume after carbonized with increasing the content of H3BO3, both show a trend of increasing first and then decreasing. It shows that the addition of H3BO3 leads to less volume shrinkage after pyrolysis when the H3BO3 addition is less than 3.5 wt%. The remaining weight after curing and remaining volume after carbonized begin to decrease when the H3BO3 addition is more than 3.5 wt%. That is mainly because of the higher H3BO3 content, the higher viscosity of the resin mixture (shown in Fig. 3). During the mechanical stirring of the mixed resin mixture, the bubbles can be easy to be generated inside the high-viscosity resin solution and difficult to remove. The bubbles could remain during the curing process and be more likely to generate large bubbles during carbonization.
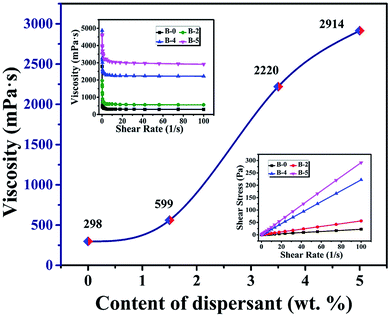 |
| | Fig. 3 The viscosity of the resin mixture with different H3BO3. | |
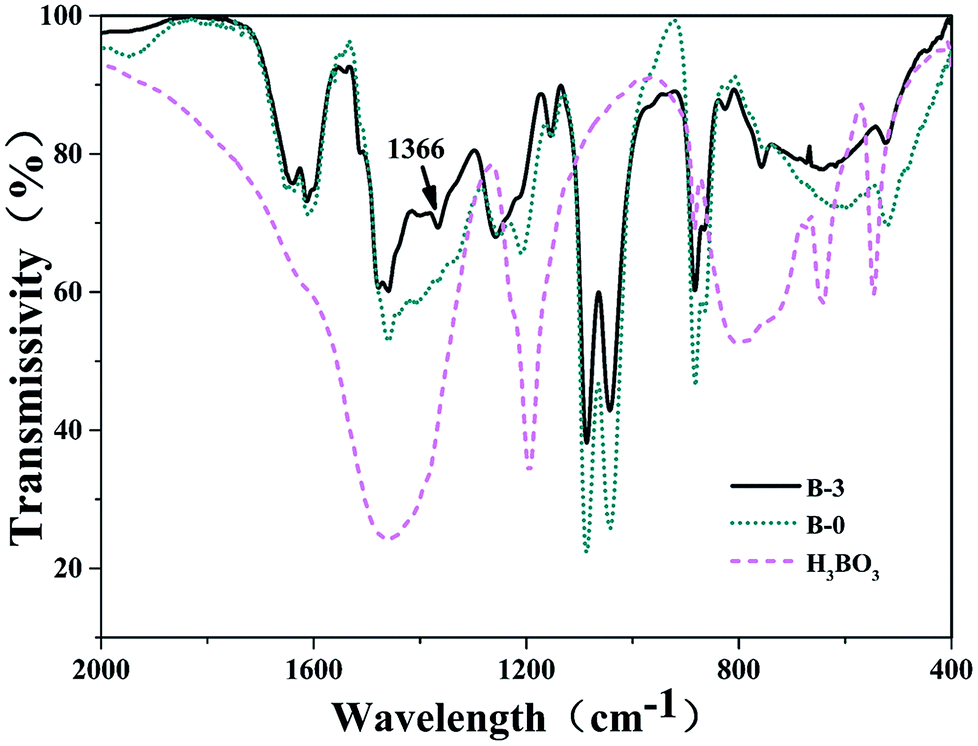
3.1.2. FT-IR spectra analysis. The FT-IR spectra of the resin mixtures with and without H3BO3 after curing are shown in Fig. 4. The absorption peaks at 1205 cm−1 and the multiple bands in the 880–756 cm−1 range were identified as resulting from C–O bonds of phenol structures and C–H flexural vibrations of the aromatic ring, respectively. The absorption peaks at 1270 cm−1 corresponded to the stretch vibrations of diphenyl ether linkages. Comparison of the spectra of samples with and without H3BO3 in Fig. 4 shows that there are two remarkable differences. An absorption peak appeared at about 1366 cm−1 after the addition of H3BO3, of which the absorption peak at 1366 cm−1 (ref. 23 and 24) attributed to the asymmetric B–O stretching vibrations. From the FTIR spectrum of the resin mixtures sample with H3BO3 (Fig. 4), the intensity of the C–O stretching of phenolic O–H at 1205 cm−1 decreases. The absorption peak near 1270 cm −1 does not change significantly before and after the addition of H3BO3 in Fig. 4, indicating H3BO3 can not reacted with phenylmethyl during curing of the resin mixtures.
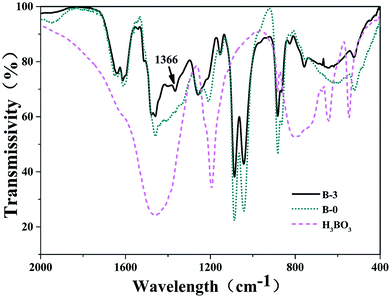 |
| | Fig. 4 FI-IR spectra of the cured bodies with different H3BO3. | |
On combining the above results, H3BO3 have participated in the curing reaction of the resin mixtures, and the phenylboronates are formed. The main process in which boric acid participates in the reaction is the reaction of phenolic hydroxyl groups with B–OH to form B–O–C bonds. The possible reaction process is shown in Fig. 5. This reaction process is beneficial to increase the degree of polymerization of the resin mixtures after curing and the length of the molecular chain of the resin monomer. Correspondingly, the size of the continuous EG phase produced during the polymerization phase separation becomes larger. That is expected to change the pore structure of resulting porous carbon.
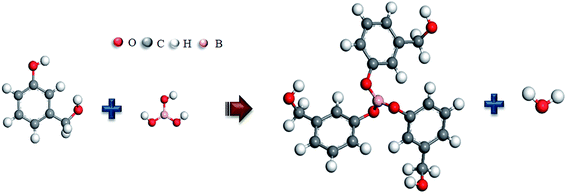 |
| | Fig. 5 The possible reaction processes. | |
3.2 Characterization of the porous carbons
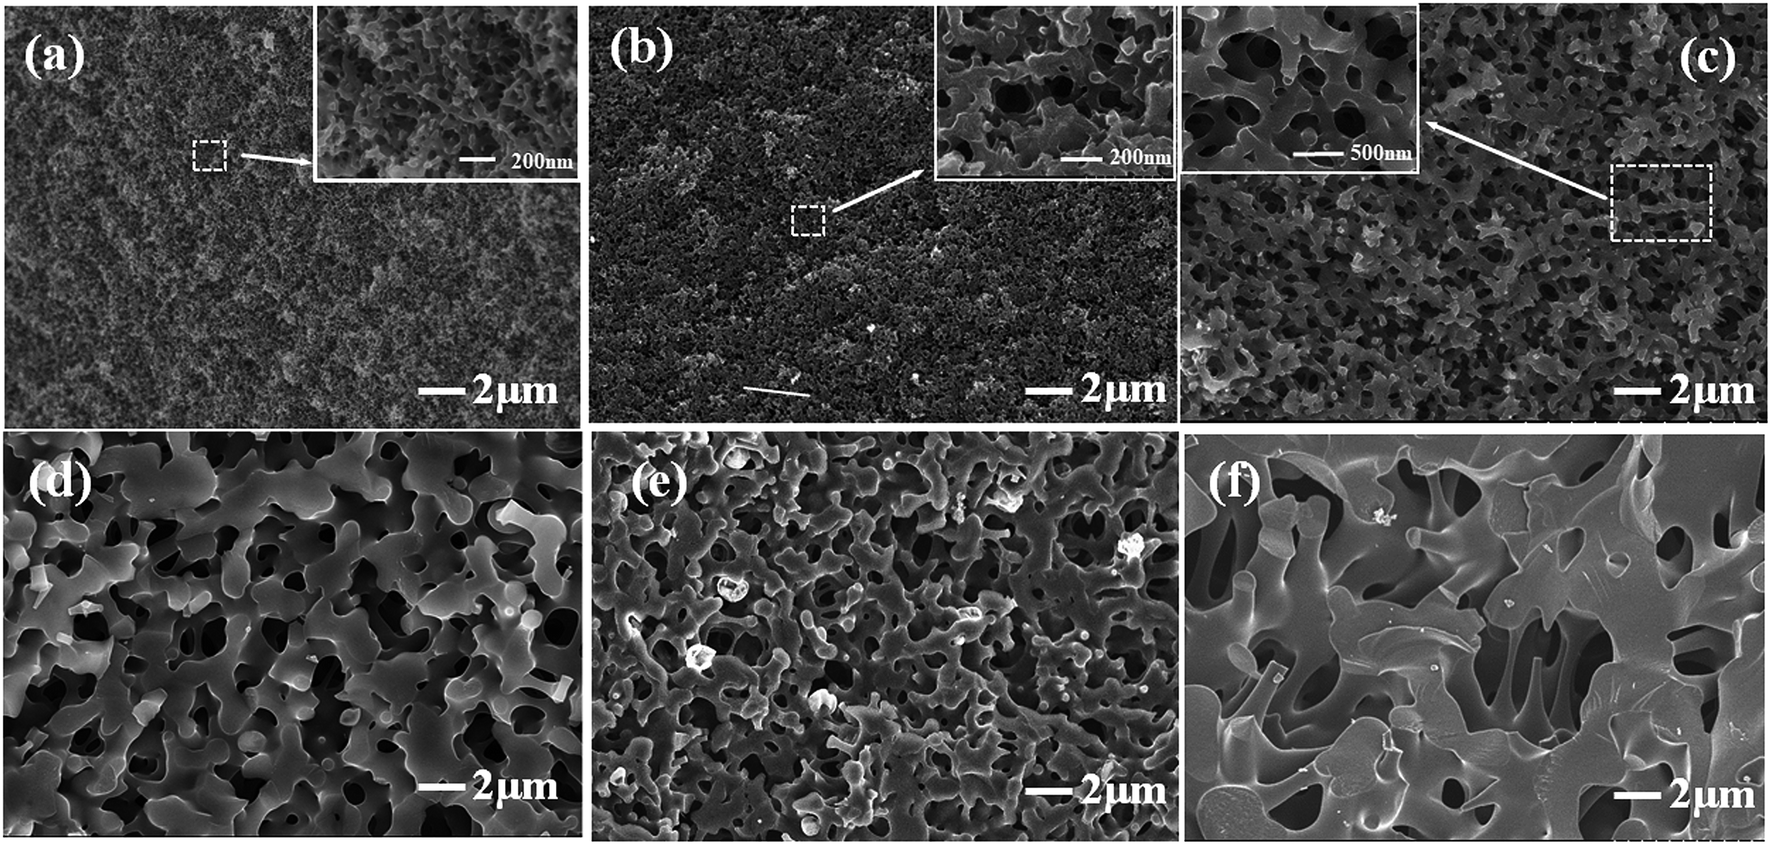
The influence of H3BO3 in resin mixtures on the pore structure of resulting porous carbon is examined using the samples with the weight fraction of H3BO3 range from 0.5% to 5%. Fig. 6 shows the SEM images of the microstructure of resulting porous carbon. It is evident that with the weight fraction of H3BO3 ranging from 0.5% to 5%, the porous carbon network with interconnected pores can be obtained after carbonization. The formation of the porous structure is due to the removal of the ethylene glycol-rich phase in the resin mixtures during carbonization. Fig. 6 also shows the pore structure of the resulting porous carbon has significant differences. It can be seen from the image (Fig. 6) that the carbonized products obtained from resin mixtures with more H3BO3 content had a bigger pore size and thicker carbon skeleton. It can also be proved by mercury porosimetry, as shown in Fig. 9 and Table 1. The phase composition of resulting porous carbon was confirmed by XRD and EDS, as shown in Fig. 7. The results of the chemical composition analysis in the carbonized products (B-3) by EDS show that it is mainly carbon and a small amount of oxygen. The XRD results indicate that the main crystalline phase of the carbonized product is amorphous carbon. The reason why B2O3 is not observed is mainly due to the low melting point of B2O3 (450 °C). The low melting point of B2O3 led to an unavoidable the volatilization of B2O3 at high temperatures.20 The relatively low melting point of the involved oxides and the presence of open pore space favor a continuous evolution of liquid or gaseous oxides out of the material.25
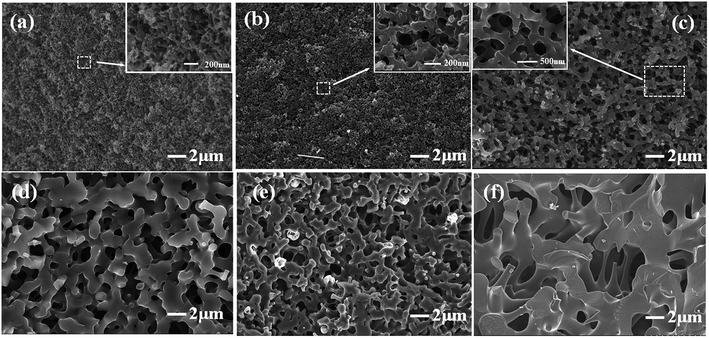 |
| | Fig. 6 Effect of H3BO3 on the morphologies of porous carbons. (a) B-0; (b) B-1; (c) B-2; (d) B-3; (e) B-4; (f) B-5. | |
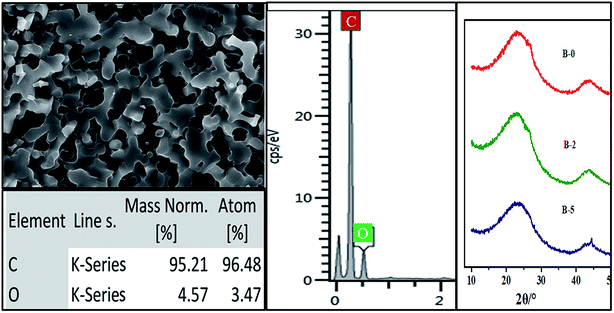 |
| | Fig. 7 The phase composition of resulting porous carbon of B-3. | |
The microstructure of the cured bodies of resin mixtures before pyrolysis is shown in Fig. 8. It is obvious that there is no significant morphology difference in the samples before/after pyrolysis. The main reason is that the morphological of carbonized products basically was inherited from that of cured bodies.17,21 The formation of pores is derived from the volatilization of the ethylene glycol-rich phase. Fig. 8 also shows that pores obtained from resin mixtures with higher content of H3BO3 have a bigger pore size and thicker carbon skeleton. These results reveal that, due to the complexation of boronic acids to diols, the size of the ethylene glycol-rich phase increase with the increasing content of H3BO3, which are consistent with the results of the thermogravimetric analysis.
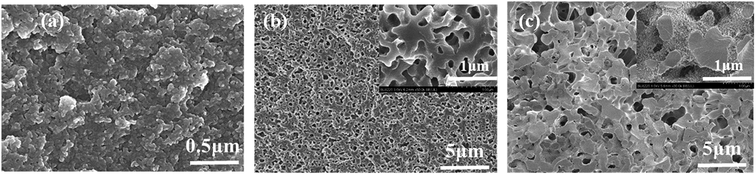 |
| | Fig. 8 The microstructure of the cured bodies of resin mixtures before pyrolysis. (a) B-0; (b) B-2; (c) B-3. | |
Table 1 lists the properties of resulting porous carbon obtained from resin mixtures with different content of H3BO3. The average pore size of B-0 sample is 15![[thin space (1/6-em)]](https://www.rsc.org/images/entities/char_2009.gif) ±5 nm. The reason of the pore formation can be explained as follows: the PF is completely miscible with ethylene glycol before curing. As the polycondensation reaction proceeds, the polymerized monomer gradually crosslinks into a bulk polymer, and the compatibility with ethylene glycol gradually decreases, which promotes phase separation. After curing and carbonization, the polymerized resin phase forms a carbon skeleton, and the ethylene glycol-rich phase volatilizes at a certain temperature to form pores in the carbon skeleton, as is shown in Fig. 9(a). The average pore size of resulting porous carbon increased from 15 ± 5 to 2754 ± 66 nm with the increase of H3BO3 content, which are consistent with the results of the SEM images. It can be obtained by FT-IR analysis of Fig. 4 that the addition of boric acid is advantageous for increasing the length of the monomer molecular chain of the resin mixture after curing. The increase in monomeric molecular chains provides the driving force generated by phase separation, facilitating the occurrence of phase separation, as is shown in Fig. 9(b). This facilitates the formation of a larger aperture. The pore size drastically changes between B-1 and B-2. It indicates that the increase of the molecular chain contributes significantly to the phase separation. With increasing content of H3BO3 from 0% to 1.5%, the apparent porosity of the resulting porous carbon increase from 25.6 ± 1.1% to 54.2 ± 1.9%, while their bulk density decrease from 1.18 ± 0.08 to 0.74 ± 0.01%. However, when the H3BO3 addition is more than 1.5 wt%, the apparent porosity after carbonized begins to decrease and the bulk density increase.
±5 nm. The reason of the pore formation can be explained as follows: the PF is completely miscible with ethylene glycol before curing. As the polycondensation reaction proceeds, the polymerized monomer gradually crosslinks into a bulk polymer, and the compatibility with ethylene glycol gradually decreases, which promotes phase separation. After curing and carbonization, the polymerized resin phase forms a carbon skeleton, and the ethylene glycol-rich phase volatilizes at a certain temperature to form pores in the carbon skeleton, as is shown in Fig. 9(a). The average pore size of resulting porous carbon increased from 15 ± 5 to 2754 ± 66 nm with the increase of H3BO3 content, which are consistent with the results of the SEM images. It can be obtained by FT-IR analysis of Fig. 4 that the addition of boric acid is advantageous for increasing the length of the monomer molecular chain of the resin mixture after curing. The increase in monomeric molecular chains provides the driving force generated by phase separation, facilitating the occurrence of phase separation, as is shown in Fig. 9(b). This facilitates the formation of a larger aperture. The pore size drastically changes between B-1 and B-2. It indicates that the increase of the molecular chain contributes significantly to the phase separation. With increasing content of H3BO3 from 0% to 1.5%, the apparent porosity of the resulting porous carbon increase from 25.6 ± 1.1% to 54.2 ± 1.9%, while their bulk density decrease from 1.18 ± 0.08 to 0.74 ± 0.01%. However, when the H3BO3 addition is more than 1.5 wt%, the apparent porosity after carbonized begins to decrease and the bulk density increase.
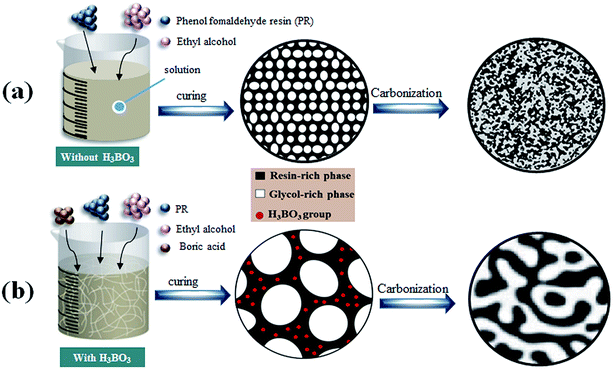 |
| | Fig. 9 The formation mechanism for the pore structure controlled carbons. | |
The pore size distribution results of porous carbon obtained from mercury porosimetry and N2 adsorption analysis are shown in Fig. 10. For samples without H3BO3 (B-0), the pore size distribution of resulting porous carbon was very narrow, with most of the pores distributing in the range from 10 to 30 nm. It is also found that the pore size distributions of porous carbons become broader with the addition of H3BO3, shown in Fig. 10(a). When the content of H3BO3 was 5 wt%, the pore size distribution of resulting porous carbon is in the range from 1500 to 3500 nm, and some abnormal oversized pores appear in the sample. That is mainly because the high viscosity of the resin mixture (shown in Fig. 3) can be more likely to generate large bubbles during curing. As can be seen from Fig. 10(b), the resulting porous carbon sample has a micropore structure of about 4 nm. The generation of micropore is attributed to the decomposition and devolution of boron species.
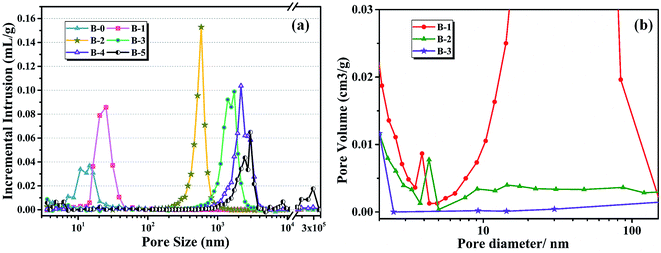 |
| | Fig. 10 Pore size distributions of different H3BO3 deduced from (a) mercury porosimetry, (b) N2 adsorption. | |
4. Conclusions
In conclusion, porous carbons with uniformly distributed pore structure are obtained by introducing H3BO3 to PR. The results show that the addition of H3BO3 in the resin mixtures can change the polymerization dynamics during curing of resin-glycol mixtures. Because of the complexation of boronic acids to diols, the size of the ethylene glycol-rich phase produced during the curing of the resin mixture increase with the increase of the content of H3BO3. Similarly, the pore size of porous carbon after cracking increases with the increase of H3BO3 content. The average pore size of resulting porous carbon increased from 15 ± 5 to 2754 ± 66 nm with the increase of H3BO3 content.
Conflicts of interest
There are no conflicts to declare.
Acknowledgements
This work was supported by Natural Science Foundation of Shanghai (No. 16ZR1440900), Shanghai Institute of Ceramics, Chinese Academy of Sciences and the State Key Laboratory of High-Performance Ceramics and Superfine Microstructures.
References
- C. Chen, E. B. Kennel, A. H. Stiller, P. G. Stansberry and J. W. Zondlo, Carbon foam derived from various precursors, Carbon, 2006, 44, 1535–1543 CrossRef CAS.
- S. Han, K. Sohn and T. Hyeon, Fabrication of new nanoporous carbons through silica templates and their application to the adsorption of bulky dyes, Chem. Mater., 2000, 12, 3337–3341 CrossRef CAS.
- M. Ojima, S. Hiwatashi, H. Araki, A. Fujii, M. Ozaki and K. Yoshino, Appl. Phys. Lett., 2006, 88, 053103e053106 CrossRef.
- T. A. Centeno, J. A. Fernandez and F. Stoeckli, Correlation between heats of immersion and limiting capacitances in porous carbons, Carbon, 2008, 46(7), 1025–1030 CrossRef CAS.
- B. J. Kim, Y. S. Lee and S. J. Park, Novel porous carbons synthesized from polymeric precursors for hydrogen storage, Int. J. Hydrogen Energy, 2008, 33(9), 2254–2259 CrossRef CAS.
- A. Merritt, R. Rajagopalan and H. C. Foley, High performance nanoporous carbon membranes for air separation, Carbon, 2007, 45(6), 1267–1278 CrossRef CAS.
- H. F. Yang, Q. H. Shi, X. Y. Liu, S. H. Xie, D. C. Jiang and F. Q. Zhang, et al., Synthesis of ordered mesoporous carbon monoliths with bicontinuous cubic pore structure of Ia3d symmetry, Chem. Commun., 2002, 2(23), 2842–2843 RSC.
- B. You, et al., Hydrogel-derived heteroatom-doped porous carbon networks for supercapacitor and electrocatalytic oxygen reduction, Carbon, 2016, 103, 9–15 CrossRef CAS.
- S. Han, et al., Metal-Phosphide-Containing Porous Carbons Derived from an Ionic-Polymer Framework and Applied as Highly Efficient Electrochemical Catalysts for Water Splitting, Adv. Funct. Mater., 2015, 25(25), 3899–3906 CrossRef CAS.
- E. E. Hucke, Methods of producing carbonaceous bodies and the products thereof, US Pat. 3859421, 1975.
- Z. Hu, M. P. Srinivasan and Y. Ni, Adv. Mater., 2000, 12, 62–65 CrossRef CAS.
- T. Y. Zhang, W. P. Walawender, L. T. Fan, M. Fan, D. Daugaard and R. C. Brown, Chem. Eng. J., 2004, 105(1–2), 53–59 CrossRef CAS.
- Y. Zhang, Z. Yuan and Y. Zhou, Effect of furfural alcohol/phenol-formaldehyde resin mass ratio on the properties of porous carbon, Mater. Lett., 2013, 109, 124–126 CrossRef CAS.
- Z. Yuan, Y. Zhang and Y. Zhou, Effect of curing catalyst content on the pore structure of porous carbon obtained from phenolic resin and furfuryl alcohol, Mater. Lett., 2013, 110, 218–220 CrossRef CAS.
- P. K. Chan and A. D. Rey, Macromolecules, 1996, 29(27), 8934–8941 CrossRef CAS.
- Y. X. Wang, S. H. Tan, D. L. Jiang and X. Y. Zhang, Preparation of porous carbon derived from mixtures of furfuryl resin and glycol with controlled pore size distribution, Carbon, 2003, 41(11), 2065–2072 CrossRef CAS.
- S. Xu, J. Li, G. Qiao, H. Wang and T. Lu, Pore structure control of mesoporous carbon monoliths derived from mixtures of phenolic resin and ethylene glycol, Carbon, 2009, 47(8), 2103–2111 CrossRef CAS.
- T. Vergunst, F. Kapteijn and J. A. Moulijn, Preparation of carbon-coated monolithic supports, Carbon, 2002, 40(11), 1891–1902 CrossRef CAS.
- H. Kosonen, S. Valkama, A. Nykanen, M. Toivanen, G. Brinke and J. Ruokolainen, et al., Functional porous structures based on the pyrolysis of cured templates of block copolymer and phenolic resin, Adv. Mater., 2006, 18(2), 201–205 CrossRef CAS.
- S. Wang, Y. Wang, B. Cheng, Y. Zhong and X. Jing, The thermal stability and pyrolysis mechanism of boron-containing phenolic resins: the effect of phenyl borates on the char formation, Appl. Surf. Sci., 2015, 331, 519–529 CrossRef CAS.
- Z. Yuan and Y. Zhang, Preparation and characterization of porous carbons obtained from mixtures of furfuryl alcohol and phenol-formaldehyde resin, Mater. Chem. Phys., 2014, 143, 707–712 CrossRef CAS.
- D. E. Garrett, Borates: Handbook of Deposits, Processing, Properties and Use, Academic Press, 1998 Search PubMed.
- J. A. Faniran and H. F. Shurvell, Infrared spectra of phenylboronic acid (normal and deuterated) and diphenyl phenylboronate, Can. J. Chem., 1968, 46(12), 2089–2095 CrossRef CAS.
- S. Wang, et al., High char yield of aryl boron-containing phenolic resins: the effect of phenylboronic acid on the thermal stability and carbonization of phenolic resins, Polym. Degrad. Stab., 2014, 99, 1–11 CrossRef CAS.
- Z. k. Chen, X. Xiong, G. d. Li and Y. l. Wang, Ablation behaviors of carbon/carbon composites with C-SiC-TaC multi-interlayers, Appl. Surf. Sci., 2009, 255, 9217–9223 CrossRef CAS.
|
| This journal is © The Royal Society of Chemistry 2019 |
Click here to see how this site uses Cookies. View our privacy policy here. 
 Open Access Article
 This Open Access Article is licensed under a Creative Commons Attribution-Non Commercial 3.0 Unported Licence
 ab,
Ronghua Suc,
Yunzhou Zhu*a and
Zhengren Huang*a
ab,
Ronghua Suc,
Yunzhou Zhu*a and
Zhengren Huang*a