
 Open Access Article
 This Open Access Article is licensed under a Creative Commons Attribution-Non Commercial 3.0 Unported Licence
Moving mechanisms of the three-phase contact line in a water–decane–silica system
Wenxiu Zheng,
Chengzhen Sun,
Boyao Wen and
Bofeng Bai *
*
State Key Laboratory of Multiphase Flow in Power Engineering, Xi'an Jiaotong University, Xi'an, Shaanxi 710049, China. E-mail: bfbai@mail.xjtu.edu.cn; Tel: +86-029-82665316
First published on 22nd January 2019
Abstract
The movement of the three-phase contact line with chain molecules in the liquid phase displays more complex mechanisms compared to those in the usual liquid–liquid–solid systems and even to the gas–liquid–solid systems controlled by the traditional single-molecule adsorption–desorption mechanisms. By introducing decane molecules with chain structures, we demonstrate from molecular dynamics insights that the moving mechanism of the contact line in a water–decane–silica system is totally different from traditional mechanisms. Three different wettability-related moving mechanisms including “Roll up”, “Piston” and “Shear” are revealed corresponding to the hydrophilic, intermediate and hydrophobic three-phase wettability, respectively. In the “Roll up” mechanism, the decane molecules are rolled up by the competitively adsorbed water molecules and then move forward under the driving force; when the “Piston” mechanism happens, the decane molecules are pushed by the piston-like water phase owing to the comparable adsorption interactions of the two liquids on the solid surface; in the “Shear” mechanism, the contact line is hard to drive due to the stronger decane–silica interactions but the decane molecules far away from the solid surface will move forward. Besides, the time-averaged velocity of the moving contact line is greatly related to the moving mechanisms. For the “Roll up” mechanism, the contact line velocity increases first and then reaches a steady value; for the “Piston” mechanism, the contact line velocity has a maximum value at the start-up stage and then decreases to a stable value; for the “Shear” mechanism, the contact line velocity fluctuates around zero due to the thermal fluctuation of the molecules. Additionally, the mean distance from Molecular Kinetics Theory increases with decreasing hydrophilicity and the displacement frequency in “Roll up” mechanism is 2 orders of magnitude higher than that in the “Piston” mechanism, further demonstrating the different moving mechanisms from a quantitative point of view.
Introduction
The moving contact line in a liquid–liquid–solid (LLS) system is a very common phenomenon, which has remained a subject of long-term concentration for researchers.1–4 For example, the detachment of droplets or liquid films from solid surfaces plays an important role in oil recovery, where the movement of the three-phase contact line occurs during the liquid–liquid displacement processes.5,6 The moving contact line in a LLS system is determined not only by the interactions among the liquid molecules but also by the interactions between the liquid molecules7 and the solid materials.8–11 Thus, the movement of the contact line is affected by the liquid properties, the solid properties and their surface structures.12,13 It is generally accepted that the moving contact line is controlled by the unbalanced force and the energy dissipation near the contact line.14,15 Molecular Kinetics Theory (MKT) is widely applied to describe the moving contact line.16,17 Although MKT shows good agreement with the experimental data for liquid–liquid displacement,18–20 it is still in doubt how the two liquids displace in the contact line region since the MKT parameters of the two-liquid systems are greatly influenced by the properties of the two liquids and need more physical explanations. Therefore, researchers have tried to establish a link between the one-liquid systems and the two-liquid systems, which could give a clearer understanding about the physical origins of the moving contact line.21–23 The source of this problem is the moving mechanism of the contact line understanding the displacing mode of the molecules near the contact line. The moving mechanism of the contact line in a gas–liquid–solid (GLS) system is almost clear since a gas–liquid interface is a low-density zone. In this case, the single-molecule adsorption–desorption mechanism makes the contact line move forward.24 Oppositely, for the LLS systems, the contact line zone is dense with a density comparable to those of the two liquids. Some researchers believe that the single-molecule adsorption–desorption mechanism is still valid and the molecules in the front need to leave empty sites for the latter molecules, and then the latter molecules move forward.23 However, some researchers have speculated that the single-molecule adsorption–desorption mechanism may not be competent in the case of LLS systems due to a significantly larger volume of unit flow than that expected from the single-molecule adsorption–desorption mechanism.21,22,25Chain molecules are widely encountered in the oil recovery and chemical industries, etc. Meanwhile, surfactants or polymers are commonly used in many industries, which also have long-chain structures. In a LLS system with chain molecules, the moving contact line is greatly affected by the adsorption properties of the chain molecules on the solid surfaces,26 which display orientation arrangement in the adsorption layers.27,28 The orientation arrangement is determined by the solid–liquid interactions and the chain structures of the liquid molecule. Researchers showed that the chain molecules tend to be parallel to the solid surfaces27 and the chain length has obvious effects on the contact line friction.26,28 For this case, the single-molecule adsorption–desorption mechanism may be invalid since the molecules on the surface are hard to jump forward. Besides, a chain molecule will have torsion during its move, which exerts local deformations at the nanoscale near the contact line;29 the local deformations will induce extra unbalanced forces due to the interfacial deformations, thereby affecting the moving contact line. In short, the moving mechanism of the contact line in a LLS system with chain molecules is very crucial for many industries. Until now, this issue has not been examined systematically, especially in the systems with different surface wettabilities.
To better understand the moving mechanism of the three-phase contact line, a molecular level investigation on the displacing processes of the two kinds of liquid molecules near the contact line zone is of crucial importance. Molecular dynamics (MD) simulation is an effective method capturing the movements of the atomic particles30,31 controlled by Newton's laws of motion.32,33 It can obtain useful information about the moving contact line34 at the molecular level. Therefore, we present a systematical study of the moving contact line in a water–decane–silica system from molecular insights by using the MD simulations. Different three-phase wettabilities are adopted and the adsorption properties of the liquid molecules are obtained by the statistical method. Several moving mechanisms are shown for the three-phase contact line, which are related to the three-phase wettability.
Simulation model
We perform the MD simulations in a three-phase system, where the two liquids are placed on a kind of silica surface (α-quartz, 28.4 nm × 6 nm), as shown in Fig. 1. The MD simulations are implemented by the Large-scale Atomic/Molecular Massively Parallel Simulator (LAMMPS) software. The molecules are confined in a simulation box through periodic boundary conditions in the directions parallel to the silica surface and reflective boundary conditions in the direction vertical to the silica surface. We employ water and a kind of chain alkane n-decane (C10) to be the two kinds of liquids. The simulation system contains 1560 C10 and 16![[thin space (1/6-em)]](https://www.rsc.org/images/entities/char_2009.gif) 245 H2O of transferable intermolecular potential with 3 points (TIP3P) model and the structures of the liquid molecules are shown in Fig. 1. For the silica surface, the non-bridging oxygen atoms which bonded to only one silicon atom are attached to the hydrogen atoms.35 In order to better analyze the characteristics of the three-phase contact line, the silica atoms are fixed in the simulations to avoid the weak vibrations of the surface from the collisions with C10 and H2O molecules. All simulation cases are initially run for 2 ns to allow the systems to reach the equilibrium in the canonical (NVT) ensemble. Then a wall (6 nm × 6.4 nm) is added in the left of the simulation box, as shown in Fig. 1. An external force F to every wall atom is added to drive the system. A simulation run for 5 ns is firstly presented. As the simulation periods for a system to achieve the steady state change with different adding forces, another 5 ns run is continued if the system does not reach the steady state. In the simulations, the time step is set to 1.0 fs and the moving process of the three-phase contact line is recorded with a period of 10000 timesteps. The system temperature is kept at 300 K in the NVT ensemble.
245 H2O of transferable intermolecular potential with 3 points (TIP3P) model and the structures of the liquid molecules are shown in Fig. 1. For the silica surface, the non-bridging oxygen atoms which bonded to only one silicon atom are attached to the hydrogen atoms.35 In order to better analyze the characteristics of the three-phase contact line, the silica atoms are fixed in the simulations to avoid the weak vibrations of the surface from the collisions with C10 and H2O molecules. All simulation cases are initially run for 2 ns to allow the systems to reach the equilibrium in the canonical (NVT) ensemble. Then a wall (6 nm × 6.4 nm) is added in the left of the simulation box, as shown in Fig. 1. An external force F to every wall atom is added to drive the system. A simulation run for 5 ns is firstly presented. As the simulation periods for a system to achieve the steady state change with different adding forces, another 5 ns run is continued if the system does not reach the steady state. In the simulations, the time step is set to 1.0 fs and the moving process of the three-phase contact line is recorded with a period of 10000 timesteps. The system temperature is kept at 300 K in the NVT ensemble.
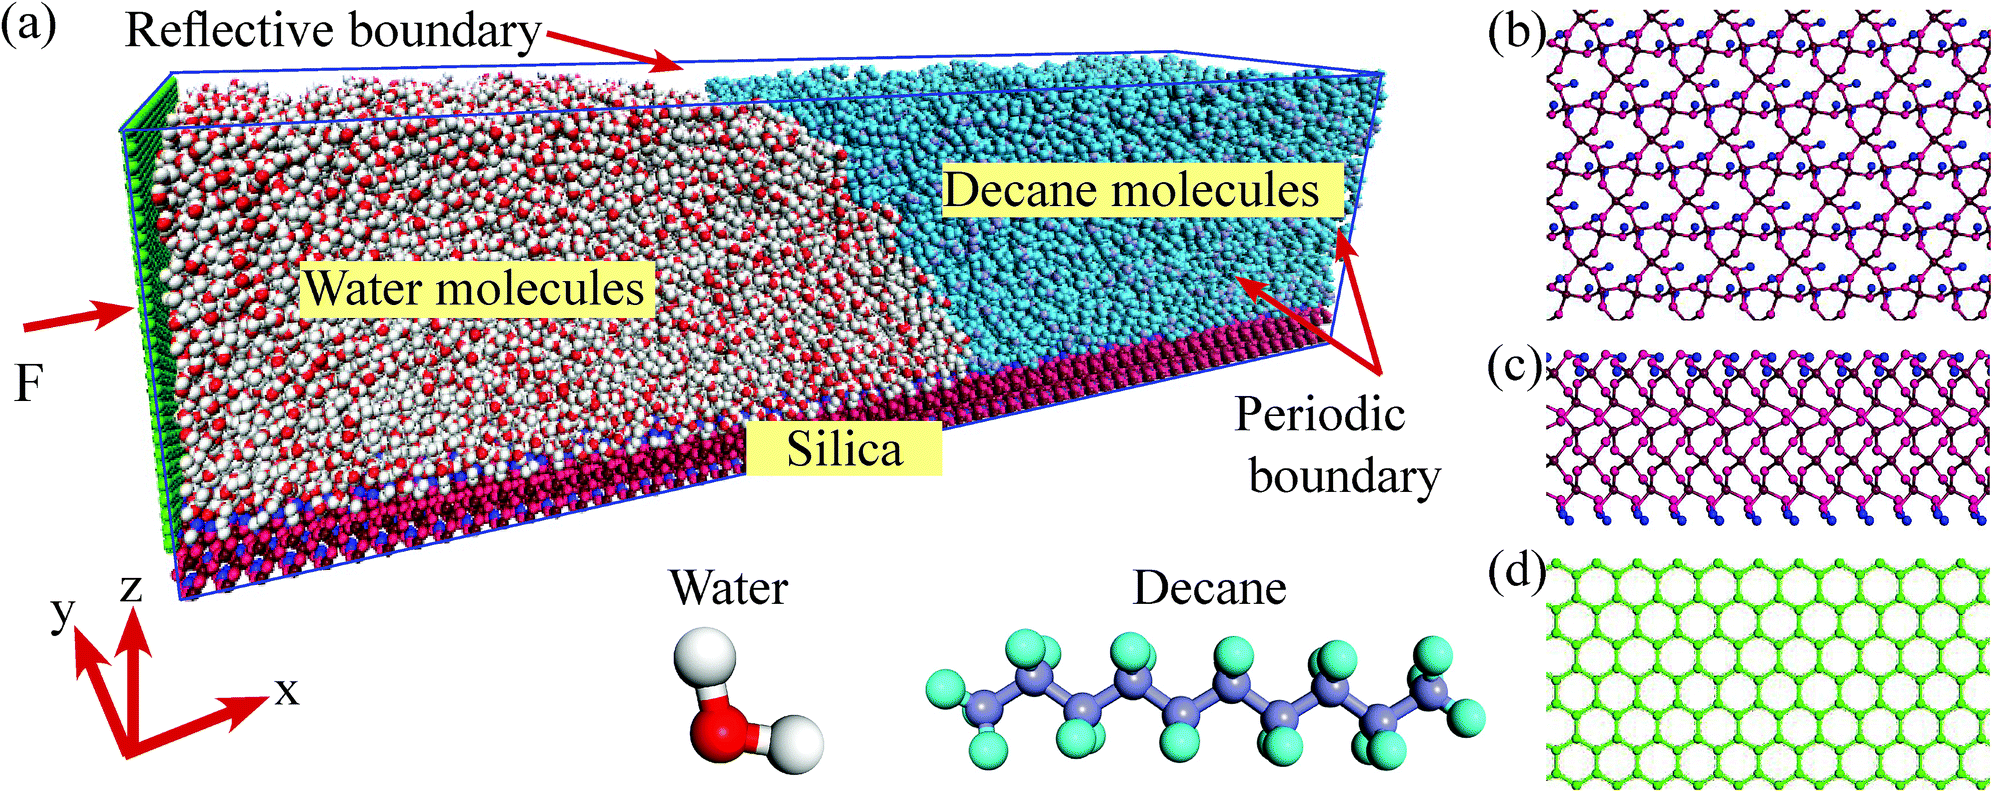 | ||
| Fig. 1 Molecular dynamics model. (a) Simulation system and the structures of the water and decane molecules. (b) Top view of the silica surface. (c) Side view of the silica surface. (d) Structure of added wall. | ||
To simulate the interactions among the atoms, several potential models are adopted. For the added wall, the adaptive intermolecular reactive empirical bond-order (AIREBO) potential model is applied, whose form and corresponding parameters can be found in the work by Stuart et al.36 For the liquid molecules and the silica atoms, Lennard–Jones (L–J) potential model coupling with the coulombic potential is employed. To improve the computational efficiency, only the neighboring particles within a certain cutoff radius (rcut) are included in the force calculation, since the distant particles have a negligible contribution. In this work, rcut is set to 1.0 nm, which is acceptable and widely used by many researchers.32 The long-range coulombic interactions are handled with the particle–particle particle-mesh (PPPM) method. To weaken the interactions between the added wall and the molecules near the contact line area, the length of the water side along x-direction is set to be long enough (14 nm). In this case, the van der Waal's interactions and the coulombic interactions (the charges of the added wall atoms are zero) between the wall atoms and the molecules near the contact line can be ignored.
The terms of the Lennard–Jones (L–J) potential (eqn (1)) and the coulombic potential (eqn (2)) can be described as follows:
 | (1) |
 | (2) |
The interactions between silica atoms and atoms in H2O and C10 molecules are modeled using the hybrid potential model. The L–J potential parameters between the crossing atoms are evaluated using the Lorentz–Berthelot mixing rule. The parameters involved in the hybrid potential model are listed in Table 1.37 It is noted that the bond information, including bond stretch and angle deformation, in H2O and C10 molecules are considered by the harmonic model (see the work by Harris et al.38). Additionally, the dihedral properties of C10 molecules are also considered by the optimized potentials for liquid simulations (OPLS) model. The charges of C10 atoms are calculated by DMol3 module of Materials Studio 7.0. The potential parameters have been verified by our group,30,31 in which the densities of the water and decane bulk phase, the decane–water interfacial thickness and the decane–water interfacial tension are calculated and show good agreements with the experimental works.
| Type | ε (eV) | σ (Å) | Charge (e) |
|---|---|---|---|
| a Superscript: 1 represents atoms in C10 molecules, 2 represents atoms in H2O molecules, 3 represents atoms in silica. | |||
| C–C | 2.864 × 10⁻³ | 3.5000 | — |
| H1–H1 | 1.302 × 10⁻³ | 2.5000 | — |
| O2–O2 | 6.611 × 10⁻³ | 3.1507 | −0.834 |
| H2–H2 | 1.999 × 10⁻³ | 0.4000 | 0.417 |
| Si–Si | 4.033 × 10⁻³ | 4.1500 | 1.1 |
| O3–Obulk3 | 2.342 × 10⁻³ | 3.4700 | −0.55 |
| O3–Osilanol3 | 5.290 × 10⁻³ | 3.4700 | −0.675 |
| H3–H3 | 0.651 × 10⁻³ | 1.0850 | 0.4 |
In addition, different three-phase wettabilities are considered by changing the energy parameter ε in eqn (1). For simplicity, we assume that the energy parameter ε in the principal interactions can be written as C·ε. The constant C will enable us to selectively increase or decrease the interactions between different types of atoms. For convenience, we assign the different types of interactions as SW and SO, which represent the water–solid interactions and the decane–solid interactions. Here we consider several cases as shown in Table 2.39 The equilibrium contact angles in Table 2 are obtained by linear fitting of the decane–water interface points.34 By averaging the water and decane interface points calculated by the density method,40 we can obtain the water–decane interface points.
| Case | CSW | CSO | Contact angle (°) |
|---|---|---|---|
| Case 1 | 1 | 1 | 45 |
| Case 2 | 0.8 | 1 | 50 |
| Case 3 | 0.6 | 1 | 60 |
| Case 4 | 0.4 | 1 | 65 |
| Case 5 | 0.3 | 1 | 75 |
| Case 6 | 0.2 | 1 | 90 |
| Case 7 | 0.2 | 1.1 | 95 |
| Case 8 | 0.2 | 1.2 | 110 |
| Case 9 | 0.2 | 1.5 | 120 |
| Case 10 | 0.2 | 2 | 133 |
Results and discussion
Adsorption property
Due to the interactions between the liquid molecules and the silica atoms, the liquid molecules can be adsorbed onto the silica surface to form a high-density zone.41 The three-phase contact line phenomenon occurs at where the liquid–vapor/liquid interface meets the solid surface.14,42–44 Therefore, it is very crucial to investigate the adsorption characteristics of the liquid molecules on the silica surfaces to deeply understand the moving behaviors of the molecules near the three-phase contact line. The molecular density distribution along z-direction is achieved by dividing the simulation regions into bins. Each Δz = 0.5 Å in size and the z coordinates are stored for the H2O and C10 molecules in the bins. Then we calculate the number density distribution based on eqn (3).| D = n(b)S | (3) |
Fig. 2 shows the number density distribution along the direction perpendicular to the solid surface for H2O and C10 molecules at several cases. As seen in Fig. 2(a), the H2O molecular density distribution is non-uniform and several high-density zones appear near the solid surfaces, meaning that the water molecules are indeed adsorbed on the solid surfaces. Away from the high-density zones, the molecular density distributes uniformly and the molecules behave like a normal liquid phase. There are three peaks at z = 11.5 Å, z = 13.5 Å and z = 16.5 Å (i.e. 0.2 nm, 0.4 nm and 0.7 nm from the O-surface), which show little difference compared to the work by Emami et al.37 The first peak is generated due to the surface hydroxyl groups, in which zone water molecules form hydrogen bond with hydroxyls on the surface.41 The second and third peaks occur as a result of the strong interactions between the solid surfaces and the water molecules near the solid surfaces. Additionally, we see that the adsorption intensities are positively related to the interactions between the water molecules and the solid surfaces. The stronger solid–water interactions (larger CSW) exhibit more intense peaks, which reveal stronger adsorption forces of the solid surfaces to the liquid molecules.
 | ||
| Fig. 2 Density distributions of the water and decane molecules on the solid surfaces. (a) Distribution of the water molecules. (b) Distribution of the decane molecules. | ||
For the C10 molecules, the appearing peaks demonstrate that several C10 layers are adsorbed on the solid surfaces (see Fig. 2(b)). For the bulk phase out of the layers, the population distribution oscillates weakly. We can also obtain the peaks for all the layers, where the solid surfaces have significant effects on the C10 molecules, presenting less C10 molecules adsorbed on the surfaces with weaker solid–liquid interactions (smaller CSO). These reflect the weaker adsorption forces of the solid surfaces to the C10 molecules. The reason of the density distribution is that C10 is a kind of chain molecule and this structure would affect the distribution of the molecules in a confined channel, especially in nanoscale channel.45 To understand more about the effects of solid surfaces on the C10 molecules, we define an angle α to analyze the orientation arrangement of the C10 molecules. The C atoms in a C10 molecule are signed from C1 to C10. For convenience and brevity, we use C1, C5, and C10 to determine the plane of C10. Angle α is obtained by averaging the angle between line C1C5 and silica surface and the angle between line C1C10 and silica surface. Owing to the strong solid–liquid interactions, the C10 molecules in the near-wall region adopt a predominately parallel orientation to the surface,46 as shown in the illustration in Fig. 2(b).
Tripping and critical force
Due to the external driving force F, the three-phase contact line may move during the displacing processes. However, it is found that several cases will occur with changing the driven force. When the driving force is not large enough to push the system, the three-phase contact line and the water–decane interface will be static. Oppositely, a too large driving force will cause continuously interfacial deformations of the water–decane interface, and the contact line will not reach to a steady velocity, we call this the instable case. A reasonable driving force will allow the contact line and water–decane interface to reach a stable state, in which cases the contact line can achieve a steady velocity. Fig. 3 shows the different cases with changing the three-phase wettability and the driving force F. Here we define the tripping force and the critical force as the minimum force to drive the contact line moving and the maximum force to keep the contact line moving stably, respectively. As we can see from Fig. 3, the tripping force and the critical force increase with decreasing the hydrophilicity. In order to better study the moving mechanism of the three-phase contact line, we analyze the stable cases under the forces between tripping force and critical force. It's worth noting that when the three-phase contact angle is larger than 110°, the strong decane–solid interactions will cause the approximately static case of the three-phase contact line. | ||
| Fig. 3 Different cases at different three-phase wettabilities and driving forces. | ||
Moving mechanisms
In order to further explain the moving mechanism of the three-phase contact line, we obtain the molecule morphology near the contact line in the systems with different three-phase wettabilities. Several periods which reflect different moving mechanisms are given in Fig. 4(a). The contact line positions along x-direction are signed and one typical displaced C10 molecule is highlighted, combining with the morphology of the water–decane interface near the solid surface. As we can see, when the three-phase contact angle is 46°, it seems that the C10 molecules are firstly rolled up by H2O molecules (several H2O molecules are highlighted by red color at 0 ps) and then run away from the solid surface. The C10 molecules repeat this process and are rolled up by the water molecules, which allow the contact line to move continuously. For this situation, after the C10 molecules are rolled up and move away from the solid surface, the interactions between the solid surface and the C10 molecules are weakened, thus it's easy for the C10 molecules to move forward with the deformation and the movement of the water–decane interface under the driving force. However, when the three-phase contact angle is 90°, the C10 molecules seem to be pushed by the piston-like water phase to move forward since there is no obvious roll up process. Importantly, the C10 molecules near the contact line will move forward near the solid surface, but they will appear deformations and move to change their local positions within the three-phase contact line area. Besides, for a more hydrophobic case whose three-phase contact angle is 120°, the contact line appears to have little displacement during the whole period. It's found that the C10 molecules within the contact line area only exhibit the local deformations. Nevertheless, the water–decane interface will be more and more oblique since the decane molecules far away from the solid surface will move forward and a wedge-structure is formed at the three-phase contact zone. | ||
| Fig. 4 Moving mechanisms of the contact line at different three-phase wettabilities. (a) Different moving modes of the displaced molecules, one typical C10 molecule is highlighted by yellow color. (b) The movement and deformation of the water–decane interfaces. | ||
As mentioned previously, the three-phase contact line phenomenon occurs where the liquid–vapor/liquid interface meets the solid surface. Hence, the movement and the deformation of the water–decane interface may have a relationship with the movement of the three-phase contact line. In order to deeply understand the moving processes of the three-phase contact line, the water–decane interfaces under different moving mechanisms are shown in Fig. 4(b). As we can see, for the “Roll up” mechanism, the deformation of the water–decane interface occurs at the same time when the three-phase contact line moves forward. When the “Piston” mechanism happens, large deformation of the water–decane interface is needed to obtain enough unbalanced Young stress, which makes the three-phase contact lime move suddenly. After this, the water–decane interface moves forward with fluctuations under the driving force. However, for the “Shear” mechanism, the water–decane interface moves with continuous deformation. As a result, a thin C10 film will remain on the solid surface. In conclusion, the deformations of the water–decane interfaces give us some insights that the variation trend of the contact line velocity over time is different under different moving mechanisms.
To clearly know the effects of the three-phase wettability on the different moving mechanisms, the phase diagram is given in Fig. 5. The diagram is obtained by considering a series of different three-phase wettabilities, from which we can see that the moving mechanism shows a strong dependence on the three-phase wettability. For a more hydrophilic surface, whose three-phase contact angle is less than 65°, the “Roll up” mechanism dominates the moving process of the three-phase contact line. In this case, the water molecules show a dominated role in the competitive adsorption near the solid surface because the water–solid interactions are stronger than the decane–solid interactions. In addition, for an intermediate wettability surface, whose three-phase contact angle is between 75° and 95°, the “Piston” mechanism occurs, in which case the water–solid interactions and the decane–solid interactions seem to be comparable. Hence, there is no obvious competitive adsorption near the three-phase contact line. For a hydrophobic surface with the three-phase contact angle larger than 110°, the “Shear” mechanism plays the main role, owing to the strong decane–solid interactions.
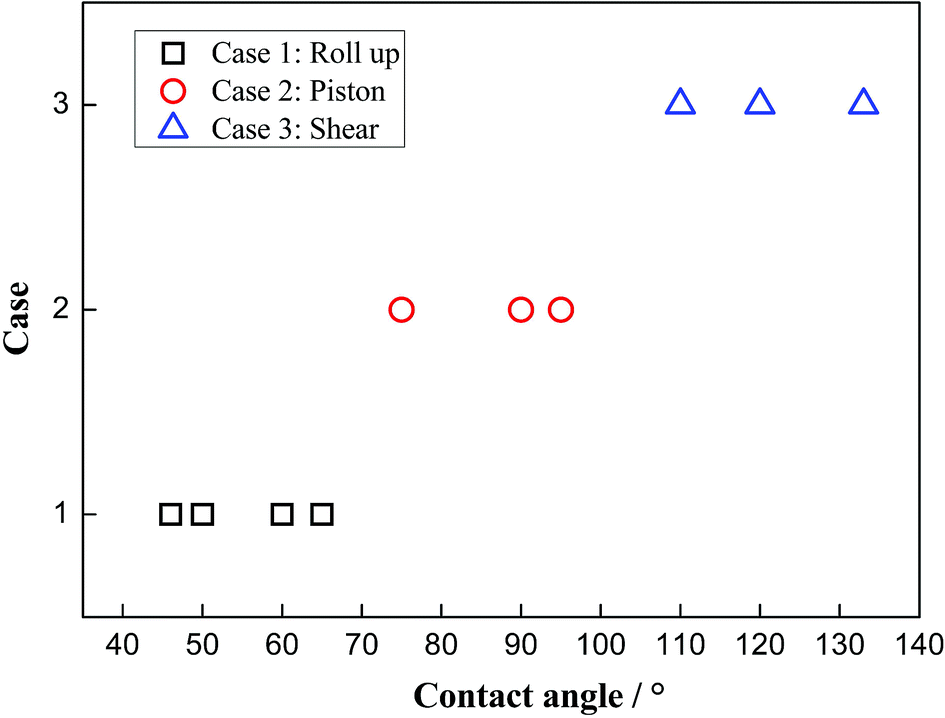 | ||
| Fig. 5 Phase diagram of the moving mechanisms with the changing of three-phase wettability. | ||
Time-averaged velocity
To deeply understand the different moving mechanisms, the velocities of the three-phase contact line during the driving processes are analyzed. By intersecting the fitting line of the water–decane interface points and the solid surfaces, the coordinates of the three-phase contact line at different times can be obtained, from which we can further obtain the displacements of the contact line, as shown in the inset of Fig. 6. Thus, the average velocity of the three-phase contact line can be obtained. The average velocity is used because the thermal fluctuation effects of the molecules are weaker. Here we give some typical cases in different moving mechanisms. When the three-phase contact line moves in the “Roll up” mechanism, the average velocity of the three-phase contact line increases firstly and then reaches to a steady value, as shown in Fig. 6(a). In this case, the competitive adsorption of the water and the decane molecules plays an important role, together with the interfacial deformation generated by the driving force. It is noted that for a relatively large driving force (F = 1.3 × 10⁻³ eV Å−1), the velocity of the three-phase contact line has a peak during the accelerating period, which reflects an inertia effect under a large driving force. When the “Piston” mechanism happens, the three-phase contact line has a maximum velocity at the start-up stage, which shows a significant inertia effect. Then the velocity decreases gradually and reaches to a steady value, as shown in Fig. 6(b). However, for the “Shear” mechanism, the three-phase contact line may move or jump back and forth, but will finally be zero, as shown in Fig. 6(c). This is mainly due to the strong interactions between the decane molecules and the solid surfaces. However, it is noted that the velocity is about zero in a “Shear” case and the thermal fluctuations of the liquid molecules will cause a large error in the calculation of the contact line velocity.47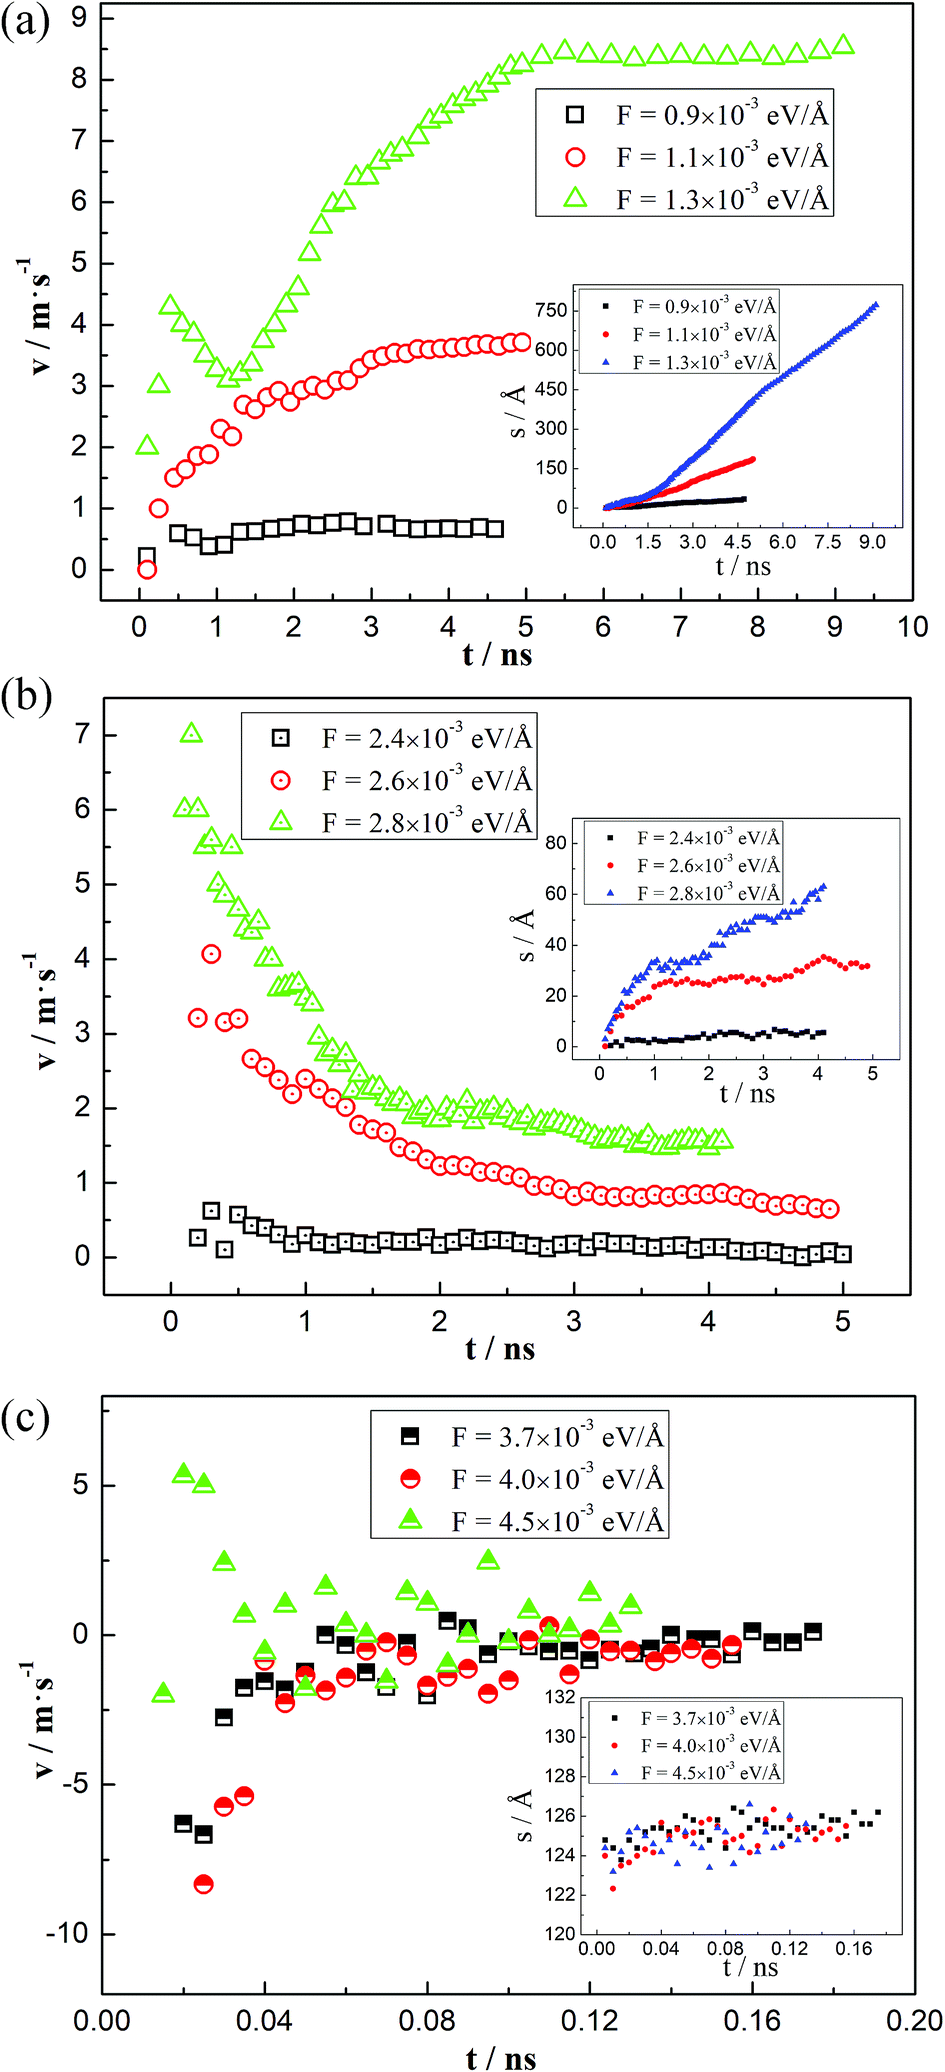 | ||
| Fig. 6 Time-averaged velocity of the contact line at different displacing mechanisms. (a) Roll up (46°): the contact line velocity increases firstly and gradually reaches a steady value. (b) Piston (90°): the contact line velocity is maximum at the start-up stage and then decreases until reaches to a steady value. (c) Shear (120°): large fluctuations occur but the final contact line velocity is about zero. Inseted figures show the displacements of the contact line over the simulation time. | ||
To further explain the phenomena, we analyze the driving force and the resistant force of the three-phase contact line. The driving force in our simulations is the unbalanced Young force generated by the external force. The resistant force has a relationship with the velocity of the three-phase contact line and the friction coefficient, which depends on the properties of the two liquids and the solid surfaces.23 Hence, for a given system, the velocity of the three-phase contact line is proportional to the unbalanced Young force, which can be obtained through the dynamic and the static contact angle.22,23 For the “Roll up” mechanism, the competitive adsorption between water and decane molecules makes the three-phase contact line easily move even though the unbalanced Young force is small at the initial stage. Therefore, the dynamic contact angle changes gradually with the deformation of the water–decane interface until it achieves a relatively steady state. Oppositely, the “Piston” mechanism needs a large deformation of the water–decane interface to obtain enough unbalanced Young force to drive the three-phase contact line to move. However, after the contact line starts to move, the unbalanced Young force decreases and fluctuates with the deformation of the water–decane interface, which will decrease the velocity of the three-phase contact line until it reaches to a steady value. Additionally, for the “Shear” mechanism, the strong interactions between the decane molecules and the solid surfaces cause the decane molecules hard to be driven. To generate enough unbalanced Young force, the continuous deformation of the water–decane interface happens, causing a wedge-structure in the contact line zone, and a decane film will finally remain on the surface.
MKT parameters
In order to further explain these physical phenomena from a quantitative perspective, we try to obtain the MKT parameters which reflect the physical mechanisms. The MKT derived by Blake and Haynes17 can describe the relationship between the contact line velocity v and the dynamic contact angle θd,21 which is given by eqn (4),
 | (4) |
In this work, a method which is used by Renate Fetzer et al.48 is adopted to obtain the two parameters. We plot the velocity v in logarithmic scale versus the cosine of the instantaneous contact angle, as shown in Fig. 7(a). Since some researchers found that the MKT will predict the moving contact line well at low capillary numbers,18–20 we try to use the low velocity region to get a better adaptation of the MKT.23 K0 and λ are directly obtained by reducing eqn (4) to a single exponential form for large arguments and fitting the data in Fig. 7(a) with a straight line (see the work by Renate Fetzer et al.48), as shown in Fig. 7(b), which display good agreement with other works at the same three-phase wettability.21,22,49 The parameter λ increases with decreasing the hydrophilicity and the value is of the same order of magnitude as other works. However, the K0 in the “Roll up” cases are approximately 2 orders of magnitude higher than those in the “Piston” cases, which further demonstrates the different moving mechanisms from a quantitative view of points. To understand the implications of K0, we give the usual form of K0 by the following equation,22,48
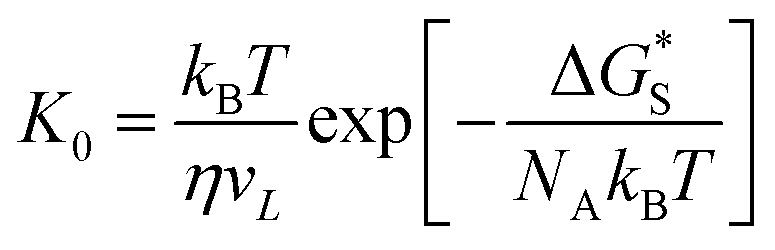 | (5) |
 is the activation free energy of the surface part. Usually,
  22 thus K0 can be written as
 | (6) |
 | ||
| Fig. 7 MKT parameters. (a) Velocity plotted in logarithmic scale versus cosθd. (b) Parameters λ and K0 of the MKT at different three-phase wettabilities and the comparison with other works. | ||
Conclusions
In this work, we study the moving mechanisms of the three-phase contact line in the water–decane–silica systems by using the MD simulations. In order to reveal the contact line moving mechanisms, a reasonable external driving force is employed to move the contact line with a stable state. Three different wettability-related moving mechanisms are revealed, including “Roll up”, “Piston” and “Shear” mechanisms. The hydrophilic surface tends to induce the “Roll up” mechanism, where the decane molecules are rolled up by the water molecules and then move forward under the driving force; the intermediate wettability surface shows the “Piston” mechanism, in which case the decane molecules are pushed by the piston-like water phases; the hydrophobic surface tends to induce the “Shear” mechanism, where the contact line is hard to be driven. For the “Roll up” mechanism, the water–solid interactions are stronger than the decane–solid interactions and thus the decane molecules are rolled up during the competitive adsorption processes. For the “Piston” mechanism, the water–solid interactions are comparable with the decane–solid interactions, and thus the decane molecules are pushed by the water molecules without obvious competitive adsorptions. For the “Shear” mechanism, the decane–solid interactions are stronger than the water–solid interactions, causing the decane molecules hard to be driven and form a wedge-structure at the three-phase contact zone. The time-averaged velocity of the contact line during the moving process shows different trends under different moving mechanisms. When the “Roll up” mechanism happens, the increasing process takes place until the contact line velocity reaches to a steady value. For the “Piston” mechanism, the contact line velocity has a maximum value at the start-up stage, which shows a significant inertia effect, then a following decrease of the velocity occurs until the velocity reaches to a steady value. However, the contact line velocity in a “Shear” mechanism is around zero and fluctuates significantly since the liquid molecules have strong thermal fluctuations. Furthermore, the MKT parameters also quantitatively demonstrate the different moving mechanisms. The mean distance λ increases with the decreasing hydrophilicity and displacement frequency K0 in the “Roll up” mechanism is 2 orders of magnitude higher than that in the “Piston” mechanism. Notably, the ultra-high volume of unit flow in the “Piston” mechanism further demonstrates the invalidation of the single-molecule adsorption–desorption mechanism in the water–decane–silica systems.In summary, water–decane–silica systems are adopted to reveal the moving mechanisms of the three-phase contact line with chain molecules. Different mechanisms may cause different energy dissipation at the moving contact line, which should be further studied. Although we reveal the mechanisms by only adopting the widely-existed decane molecules, the three mechanisms definitely exist for the other kinds of chain molecules because the local deformation and orientation arrangements of different chain molecules are similar. However, the length and branches of the chain molecules may have additional effects on the movement of the contact line in some quantitative parameters, such as velocity, critical force. Finally, it should be noted that the properties of the solid surfaces are very crucial for the moving mechanisms because they determine the relative contributions of the water–solid interactions and the decane–solid interactions.
Conflicts of interest
There are no conflicts to declare.Acknowledgements
This work was supported by the China National Funds for Distinguished Young Scientists program (No. 51425603) and project (No. 51876169).References
- Y. D. Shikhmurzaev, J. Fluid Mech., 1997, 334, 211–249 CrossRef CAS
.
- W. K. Chan and C. Yang, J. Micromech. Microeng., 2005, 15, 1722–1728 CrossRef CAS
- V. Kumar and J. R. Errington, J. Chem. Phys., 2013, 139, 159 Search PubMed
- P. K. Mondal, U. Ghosh, A. Bandopadhyay, D. Dasgupta and S. Chakraborty, Phys. Rev. E: Stat., Nonlinear, Soft Matter Phys., 2013, 88, 023022 CrossRef PubMed
- H. Yan and S. L. Yuan, J. Phys. Chem. C, 2016, 120, 2667–2674 CrossRef CAS
- P. A. Kralchevsky, K. D. Danov, V. L. Kolev, T. D. Gurkov, M. I. Temelska and G. Brenn, Ind. Eng. Chem. Res., 2014, 44, 1309–1321 CrossRef
- F. Jiménezángeles and A. Firoozabadi, J. Phys. Chem. C, 2016, 120, 11910–11917 CrossRef
- P. Randive, A. Dalal, K. C. Sahu, G. Biswas and P. P. Mukherjee, Phys. Rev. E: Stat., Nonlinear, Soft Matter Phys., 2015, 91, 053006 CrossRef PubMed
- Y. Zhang and S.-J. Park, J. Catal., 2018, 361, 238–247 CrossRef CAS
- Y. Zhang and S. J. Park, J. Mater. Chem. A, 2018, 6, 20304–20312 RSC
- Y. Zhang and S.-J. Park, Appl. Catal., B, 2019, 240, 92–101 CrossRef CAS
- N. T. Chamakos, M. E. Kavousanakis, A. G. Boudouvis and A. G. Papathanasiou, Phys. Fluids, 2016, 28, 122106–122548 Search PubMed
- M. Ramiasa, J. Ralston, R. Fetzer and R. Sedev, J. Phys. Chem. C, 2012, 116, 10934–10943 CrossRef CAS
- O. V. Voinov, Fluid Dyn., 1976, 11, 714–721 CrossRef
- E. B. Dussan V, J. Fluid Mech., 1976, 77, 665–684 CrossRef
- T. D. Blake and C. J. De, Adv. Colloid Interface Sci., 2002, 96, 21–36 CrossRef CAS PubMed
- T. D. Blake and J. M. Haynes, J. Colloid Interface Sci., 1969, 30, 421–423 CrossRef CAS
- P. A. Kralchevsky, K. D. Danov, V. L. Kolev, T. D. Gurkov, M. I. Temelska and G. Brenn, Ind. Eng. Chem. Res., 2005, 44, 1309–1321 CrossRef CAS
- X. Wang, A. V. Nguyen and J. D. Miller, Int. J. Miner. Process., 2006, 78, 122–130 CrossRef CAS
- V. L. Kolev, I. I. Kochijashky, K. D. Danov, P. A. Kralchevsky, G. Broze and A. Mehreteab, J. Colloid Interface Sci., 2003, 257, 357–363 CrossRef CAS PubMed
- S. Goossens, D. Seveno, R. Rioboo, A. Vaillant, J. Conti and J. De Coninck, Langmuir, 2011, 27, 9866–9872 CrossRef CAS PubMed
- M. Ramiasa, J. Ralston, R. Fetzer and R. Sedev, J. Phys. Chem. C, 2011, 115, 24975–24986 CrossRef CAS
- D. Seveno, T. D. Blake, S. Goossens and J. De Coninck, Langmuir, 2011, 27, 14958–14967 CrossRef CAS PubMed
- T. D. Blake, J. Colloid Interface Sci., 2006, 299, 1–13 CrossRef CAS PubMed
- R. Fetzer, M. Ramiasa and J. Ralston, Langmuir, 2009, 25, 8069–8074 CrossRef CAS PubMed
- Z. Tang, H. Li, D. W. Hess and V. Breedveld, Cellulose, 2016, 23, 1401–1413 CrossRef CAS
- R. G. Xu, Y. Xiang and Y. S. Leng, J. Chem. Phys., 2017, 147, 054705 CrossRef PubMed
- M. Voue, R. Rioboo, M. H. Adao, J. Conti, A. I. Bondar, D. A. Ivanov, T. D. Blake and J. De Coninck, Langmuir, 2007, 23, 4695–4699 CrossRef CAS PubMed
- E. Bertrand, T. D. Blake and J. De Coninck, Langmuir, 2005, 21, 6628–6635 CrossRef CAS PubMed
- B. Wen, C. Sun and B. Bai, Phys. Chem. Chem. Phys., 2018, 20, 22796–22804 RSC
- B. Wen, C. Sun, B. Bai, E. Y. Gatapova and O. A. Kabov, Phys. Chem. Chem. Phys., 2017, 19, 14606–14614 RSC
- C. Sun and B. Bai, Phys. Chem. Chem. Phys., 2017, 19, 3894–3902 RSC
- C. Sun and B. Bai, J. Phys. Chem. C, 2018, 122, 6178–6185 CrossRef CAS
- W. Zheng, C. Sun and B. Bai, Polymers, 2017, 9, 370 CrossRef
- A. Bródka and T. W. Zerda, J. Chem. Phys., 1996, 104, 6319–6326 CrossRef
- S. J. Stuart, A. B. Tutein and J. A. Harrison, J. Chem. Phys., 2000, 112, 6472–6486 CrossRef CAS
- F. S. Emami, V. Puddu, R. J. Berry, V. Varshney, S. V. Patwardhan, C. C. Perry and H. Heinz, Chem. Mater., 2016, 26, 2647–2658 CrossRef
- J. G. Harris and K. H. Yung, J. Phys. Chem., 1995, 99, 12021–12024 CrossRef CAS
- D. Saini, Y. Zheng and D. Rao, SPE Reservoir Eval. Eng., 2009, 12, 702–712 CrossRef CAS
- R. Raj, S. C. Maroo and E. N. Wang, Nano Lett., 2013, 13, 1509–1515 CrossRef CAS PubMed
- D. Argyris, N. R. Tummala, A. Striolo and D. R. Cole, J. Phys. Chem. C, 2008, 112, 13587–13599 CrossRef CAS
- J. G. Petrov and B. P. Radoev, Colloid Polym. Sci., 1981, 259, 753–760 CrossRef CAS
- P. G. D. Gennes, Rev. Mod. Phys., 1985, 57, 827–863 CrossRef
- F. Brochardwyart and P. G. D. Gennes, Adv. Colloid Interface Sci., 1992, 39, 1–11 CrossRef CAS
- S. Wang, F. Javadpour and Q. Feng, Fuel, 2016, 171, 74–86 CrossRef CAS
- S. Wang, Q. Feng, F. Javadpour, T. Xia and Z. Li, Int. J. Coal Geol., 2015, 147–148, 9–24 CrossRef CAS
- P. Johansson and B. Hess, Phys. Rev. Fluids, 2017, 3, 1–8 Search PubMed
- R. Fetzer and J. Ralston, J. Phys. Chem. C, 2009, 113, 8888–8894 CrossRef CAS
- H. Li, R. Sedev and J. Ralston, Phys. Chem. Chem. Phys., 2011, 13, 3952–3959 RSC
| This journal is © The Royal Society of Chemistry 2019 |