 Open Access Article
Sakura-based activated carbon preparation and its performance in supercapacitor applications
Fei Ma *a,
Shaolan Dinga,
Huijun Renb and
Yanhua Liua
aCollege of Bioresources Chemical and Materials Engineering, Shaanxi University of Science & Technology, Xi'an 710021, China. E-mail: mf3060303201@yeah.net
bSchool of Arts and Sciences of Shaanxi University of Science & Technology, Xi'an 710021, China
First published on 18th January 2019
Abstract
3D porous carbonaceous materials were prepared by combining pre-carbonization and KOH activation with sakura petals as raw materials. The prepared porous sakura carbon (SAC-4) exhibits a high specific surface area, a suitable pore size distribution, a low proportion of oxygen-rich groups and N functional groups, and a partially graphitized phase, which are very beneficial for the electrochemical performance of the material as a supercapacitor electrode. In the activation step, when the mass ratio of KOH to sakura carbon (SC) is 4, a supercapacitor is prepared. A maximal specific capacitance of 265.8 F g−1 is obtained when the current density is 0.2 A g−1. When the current density is 1 A g−1, after 2000 cycles in succession, the capacitance retention rate is excellent and the cycling stability can reach as high as 90.2%. The obtained results indicate that porous carbon prepared with sakura blossom as the raw material is an effective and environmentally friendly electrode material for energy storage.
1 Introduction
With the surge in fossil energy consumption and the intensification of environmental problems, the development and research of efficient, clean and sustainable new energy materials have become of increasing importance.1,2 Supercapacitors have been used in electric vehicles, portable devices and energy storage systems due to their higher power density and charge–discharge rates and lower maintenance costs.3 Among the supercapacitors, double-layer capacitors are one of the principal kinds, mainly based on the accumulation of ions between the electrodes and the electrolyte interface.4 For the electrode material of double-layer capacitors, porous carbon is considered as an ideal candidate due to its high specific surface area, better electrical conductivity and electrochemical stability.5,6At the same time, porous activated carbon comes from a wide range of sources, and the use of biomass materials as raw materials for activated carbon can reduce costs and have environmental advantages. The biomass components are mainly composed of C, H, O and N elements,7,8 and the presence of these O and N elements is very beneficial for increasing the wettability and pseudo-capacitance of the carbon materials.9,10 In addition, biomass has a natural porous network structure consisting of hundreds of interconnected bundled microtubules. Furthermore, hierarchical porous carbon can be created, which satisfies the conditions of different functional pores with different sizes required in supercapacitor applications. Among the different types of pores, mesopores/macropores can provide ion transport channels, which can significantly improve the rate performance, while micropores can contribute to a large specific surface area to help accumulate additional charges and obtain a high specific capacitance.11 The design of layered porous structures can be achieved by many approaches, such as physical activation12 or chemical activation,13 polymer blending carbonization,14 and the use of soft templates15 and hard templates associated with carbonization or activation.16,17 Chemical activation is an efficient method with a low cost that can be used to develop porous structures that can be prepared at lower temperatures within a shorter activation time. At present, biomass raw materials including soybean, nori, cabbage, candlenut flower, loofah, potatoes, egg shell, silkworms, and peanut shells have been used to synthesize bio-carbon and applied for the electrode materials of supercapacitors.18–26 Biomass carbon has exhibited good effects in supercapacitor applications, but the porous carbon in sakura petals has rarely been investigated.
Sakura is a woody plant of the Cerasus genus in the Rosaceae family, mainly distributed in temperate regions, especially in China, Japan and South Korea. Most sakura trees in China are used as garden ornamental plants, and the withered petals can only be burned or discarded, which causes a large number of sakura petals to be wasted and creates some pressure on the environment. The petals are flat in form and have a thickness of only 10–20 μm, and there are some fine folds forming channels that supply water on the petal surface.27 These characteristics make sakura petals advantageous as precursors for preparing porous carbon with a higher specific surface area.
In this study, sakura-based activated carbon with a porous structure was prepared by the methods of collection, drying, carbonization, KOH chemical activation, and acid/water washing. Electrodes were then fabricated and the electrochemical performance of the sakura-based activated carbon was tested by cyclic voltammetry (CV), constant current charge/discharge (GCD) and electrochemical impedance spectroscopy (EIS). The results show that the prepared sakura-based activated carbon exhibits a high specific surface area and a high specific capacitance. The maximum specific capacitance of the sakura-based activated carbon is 265.8 F g−1 when the current is 0.2 A g−1 in a three-electrode system. In addition, the sakura-based activated carbon electrodes have better cycling stability. These properties may make sakura-based activated carbon become a novel source of carbonaceous materials for high-performance supercapacitors.
2 Experimental methods
2.1 Materials and reagents
The sakura petals used to prepare the activated carbon in this study were collected on the campus of Shaanxi University of Science & Technology, China. Potassium hydroxide (KOH) was purchased from Titan Technology Co., Ltd. (Shanghai, China). Polytetrafluoroethylene (PTFE) was purchased from Lizhiyuan Co., Ltd. (Taiyuan, China). N-Methylpyrrolidone (NMP) was purchased from Lizhiyuan Co., Ltd. (Taiyuan, China). Acetylene black was purchased from Tianyi Co., Ltd. (Tianjin, China). Nickel foam was purchased from Honor Technology Co., Ltd. (Shanghai, China). All the chemical reagents were of analytical grade and could be used without any further purification.2.2 Preparation of the sakura-based activated carbon
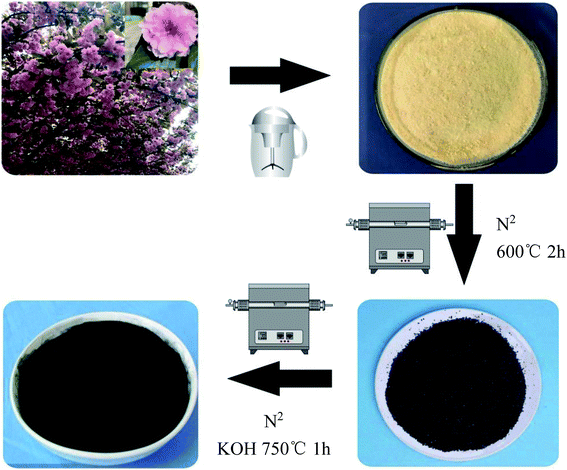
A brief description of the process for preparing the sakura-based activated carbon is shown in Fig. 1. The exact process is as follows. The flower stalks were removed from the collected sakura. The petals were crushed and then ultrasonically washed with absolute ethyl alcohol and deionized water for 10 minutes, respectively. After being dried in an oven at 60 °C, the powder was placed in a corundum ark and put into a tube furnace. In a nitrogen atmosphere, the temperature was increased to 600 °C for 2 h, at a heating rate of 5 °C min−1, and then it was naturally cooled to room temperature. The carbonized sakura powder and a potassium hydroxide solution were mixed and the powder was impregnated for 24 h at the mass ratios of 1![[thin space (1/6-em)]](https://www.rsc.org/images/entities/char_2009.gif) :
:![[thin space (1/6-em)]](https://www.rsc.org/images/entities/char_2009.gif) 3, 1
3, 1![[thin space (1/6-em)]](https://www.rsc.org/images/entities/char_2009.gif) :
:![[thin space (1/6-em)]](https://www.rsc.org/images/entities/char_2009.gif) 4 and 1
4 and 1![[thin space (1/6-em)]](https://www.rsc.org/images/entities/char_2009.gif) :
:![[thin space (1/6-em)]](https://www.rsc.org/images/entities/char_2009.gif) 5, dried in an oven at 80 °C, placed in a corundum ark and put into a tube furnace. The temperature was increased to 750 °C to activate the materials for 1 h, with a heating rate of 5 °C min−1, and the temperature was then naturally cooled to room temperature. Then, they were washed with 2 mol of hydrochloric acid, deionized water and absolute ethyl alcohol, dried in an oven at 80 °C, and ground into a powder in an agate mortar, which completed the preparation of the samples of the sakura-based activated carbon. The obtained sample was named as SAC-x (x stands for the impregnation ratio of KOH, where x = 3, 4, or 5). For comparison, carbonized sakura powder was incubated for 1 h without adding KOH at 750 °C, and then the obtained sample was named as SC.
5, dried in an oven at 80 °C, placed in a corundum ark and put into a tube furnace. The temperature was increased to 750 °C to activate the materials for 1 h, with a heating rate of 5 °C min−1, and the temperature was then naturally cooled to room temperature. Then, they were washed with 2 mol of hydrochloric acid, deionized water and absolute ethyl alcohol, dried in an oven at 80 °C, and ground into a powder in an agate mortar, which completed the preparation of the samples of the sakura-based activated carbon. The obtained sample was named as SAC-x (x stands for the impregnation ratio of KOH, where x = 3, 4, or 5). For comparison, carbonized sakura powder was incubated for 1 h without adding KOH at 750 °C, and then the obtained sample was named as SC.
2.3 Preparation of electrode plates
The sample, the adhesive (PTFE) and the conductive agent (acetylene black) were weighed according to the mass ratio of 8![[thin space (1/6-em)]](https://www.rsc.org/images/entities/char_2009.gif) :
:![[thin space (1/6-em)]](https://www.rsc.org/images/entities/char_2009.gif) 1
1![[thin space (1/6-em)]](https://www.rsc.org/images/entities/char_2009.gif) :
:![[thin space (1/6-em)]](https://www.rsc.org/images/entities/char_2009.gif) 1 and the solvent of NMP in moderation was added to the mixture to be ground for 20 min. After the slurry was prepared, it was uniformly coated onto a foamed nickel current collector treated with acetone, absolute ethanol and deionized water, and dried (the area of the foamed nickel sheet was 1 cm × 2 cm, in which the coated area was only 1 cm × 1 cm). After the coating was finished, it was placed in an oven and dried at 60 °C for 12 h. After being taken out, it was tablet-formed at 10 MPa on a tableting machine to complete the preparation of the electrode sheets (the mass of the active material was about 2.5 mg).
1 and the solvent of NMP in moderation was added to the mixture to be ground for 20 min. After the slurry was prepared, it was uniformly coated onto a foamed nickel current collector treated with acetone, absolute ethanol and deionized water, and dried (the area of the foamed nickel sheet was 1 cm × 2 cm, in which the coated area was only 1 cm × 1 cm). After the coating was finished, it was placed in an oven and dried at 60 °C for 12 h. After being taken out, it was tablet-formed at 10 MPa on a tableting machine to complete the preparation of the electrode sheets (the mass of the active material was about 2.5 mg).
2.4 Material characterization instruments
The morphology of the sample was observed using an S-4800 field emission scanning electron microscope (FE-SEM), made in Hitachi, Japan, with an accelerating voltage of 15 kV. A JEM-2100F high resolution transmission electron microscope (HRTEM) was used to characterize the microstructure of the product. A Nicolet 6700 Fourier transform infrared spectrometer was used to characterize the surface functional groups of the sample. The phases of the obtained sample were analyzed by an X-ray powder diffractometer of Type X-pert, whose wavelength was λ = 0.15416 nm, and the scanning angle was 10 to 80 degrees. Utilizing an ASAP-2460 automatic adsorption instrument manufactured by Micromeritics Company, USA, a liquid nitrogen adsorption–desorption experiment was performed on the samples at a liquid nitrogen temperature of 77 K. The specific surface area was calculated by the multi-point Brunauer–Emmett–Teller (BET) method and the pore size distribution was calculated according to Barrett–Joyner–Halenda (BJH) theory. The sample ingredients were analyzed by a PHI-1600 X-ray photoelectron spectrometer manufactured by PE Company, America.2.5 Electrochemical characterization
The electrochemical characterization test was done in a three-electrode system. The measurements of electrochemical impedance spectroscopy (EIS), cyclic voltammetry (CV) and constant current charge–discharge (GCD) were performed on a CHI 660E electrochemical workstation. The foamed nickel sheets coated with the electrode material were used as the working electrodes, a 2 cm × 2 cm platinum sheet electrode was used as a counter electrode, and a saturated calomel electrode (SCE) was used as a reference electrode. The reaction electrolyte was a 6 mol L−1 KOH solution. The EIS frequency range was from 100 kHz to 10 mHz at open circuit voltage. The alternating current amplitude was 5 mV, and the electrochemical window of the CV test was from −1 to 0 V. The scanning rates were 10, 20, 50, 100, and 200 mV s−1, respectively.3 Results and discussion
3.1 Morphology and microstructure
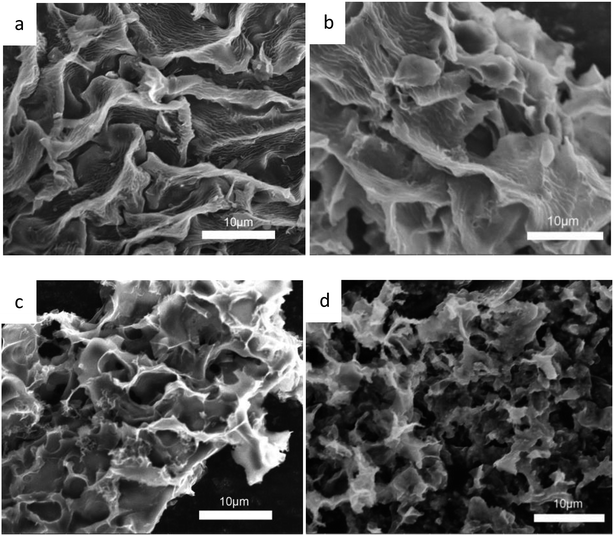
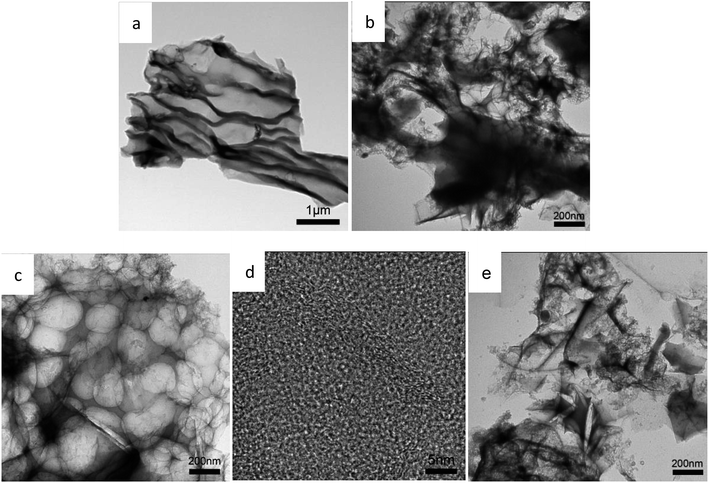
The morphology and the microstructure of the samples were characterized by SEM. As shown in Fig. 2, Fig. 2a is the activated sakura carbon without adding KOH, which has a wrinkled and rough morphology on the surface. This is mainly due to the surface shrinkage caused by the evaporation of water, volatile substances and decomposed gaseous substances during the high temperature carbonization as shown in Fig. 2a. As the mass ratio of KOH to the pre-carbonized precursor is increased from 3 to 5, it can be seen in Fig. 2b–d that the vascular-like stripes gradually disappear, replaced by a porous and rougher surface. Apparently, during alkali etching, there are hollowing effects that result in structures similar to 3D honeycombs. These structures are composed of interconnected macropores and carbon walls,28 which facilitates the rapid transmission of ions and optimizes the rate performance of the supercapacitors.29 At the same time, these large pores are open, providing a large number of interfaces for charge storage. When the KOH mass ratio is 5, the pore structure collapses, which is disadvantageous for the storage of charge.The TEM images in Fig. 3a–e reveal these changes more clearly, further demonstrating the porous structure obtained by activation treatment under high temperatures. By comparison, it can be seen that the alkali activation step produces more micropores, mesopores and even macropores, but excessive KOH can cause the pores to collapse. When the KOH ratio is only 4, higher specific surface areas and porosity are observed. This is advantageous as such specific surface areas and porosity promote the charge accumulation in the electric double layer capacitor.
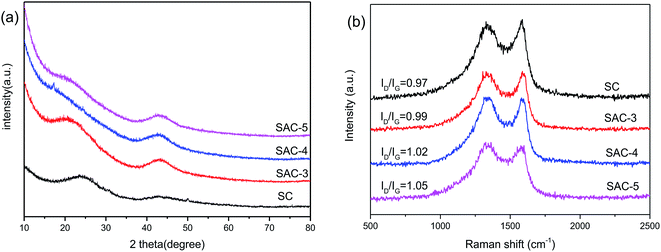
In addition, the structure of the sakura carbon is further studied using XRD patterns. In Fig. 4a, two broad peaks appear between 22° and 43.9° for all of the SAC-x materials, which are similar to the (002) and (100) characteristic peaks of graphite.30 Furthermore, it is clear that the peaks become wide and their intensities are decreased as x is increased, especially for the (002) diffraction peak. The results show that the KOH etching reduces the regularity of the SC structure due to the formation of pores or defects, which resembles the reported literature.31
The structure of the partially graphitized carbon was further confirmed by Raman spectroscopy.32–35 As shown in Fig. 4b, for all the samples, the two broad peaks at 1304 and 1590 cm−1 are the D band and G band, respectively. The D band reflects the defects and disorder of the carbon material, while the G band is related to the bond extension of the sp2 carbon atom pair.36,37 The degree of graphitization is reflected by the intensity ratio of ID/IG, and a lower ratio indicates a higher degree of graphitization. KOH activation can produce nanopores and defects in the carbon framework. Therefore, an increase in the amount of KOH should result in a lower degree of graphitization. In fact, the activated sample (SAC-x) shows a larger ID/IG value than SC. In addition, for SAC-3, SAC-4 and SAC-5, the ID/IG values are increased from 0.97 for SC to 0.99, 1.02 and 1.05, respectively. The increased defects can be used as active and adsorption sites so as to improve the performance and catalytic activity of the supercapacitors.
The surface chemical compositions of SC and SAC-x were analyzed by XPS, as shown in Fig. 5a. Both SC and SAC-x show three peaks with binding energies of 285, 400 and 532 eV, which are characteristic of the C1s, N1s and O1s orbits, indicating that there are C, N and O elements present in the samples. The content of C, N and O elements in the SC and SAC-x samples is shown in Table 1. With an increase in KOH ratio, the atomic content of N is decreased from 0.69% to 0.33%, and the content of O is decreased from 30.2% to 9.41%. The fine analyses of the C1s and N1s spectra in the SC and SAC-4 samples by means of the peak differentiating fitting method are shown in Fig. 5b. The corresponding electron binding energy and the corresponding functional groups in the C1s spectrum are C![[double bond, length as m-dash]](https://www.rsc.org/images/entities/char_e001.gif) C (284.6 eV), C–N (285.5 eV), C–OH (286.5 eV) and O–C
C (284.6 eV), C–N (285.5 eV), C–OH (286.5 eV) and O–C![[double bond, length as m-dash]](https://www.rsc.org/images/entities/char_e001.gif) O (289.3 eV),38 respectively. The N1s spectrum shows that pyridine-N-oxygen (402.7 eV), pyrrole/pyridone-N (400.2 eV) and pyridine nitrogen (398.3 eV) coexist in SAC-4.11 The presence of the oxygen-rich groups and the N-functional groups in a low proportion will provide the necessary hydrophilicity and additional capacitance for the supercapacitor. The oxygen functional groups in the aqueous electrolytes mainly occur in the following reactions:39–42
O (289.3 eV),38 respectively. The N1s spectrum shows that pyridine-N-oxygen (402.7 eV), pyrrole/pyridone-N (400.2 eV) and pyridine nitrogen (398.3 eV) coexist in SAC-4.11 The presence of the oxygen-rich groups and the N-functional groups in a low proportion will provide the necessary hydrophilicity and additional capacitance for the supercapacitor. The oxygen functional groups in the aqueous electrolytes mainly occur in the following reactions:39–42
![[double bond splayed left]](https://www.rsc.org/images/entities/char_e009.gif) C–OH ⇔ C C–OH ⇔ C![[double bond, length as m-dash]](https://www.rsc.org/images/entities/char_e001.gif) O + H+ + e− O + H+ + e−
| (1) |
| –COOH ⇔ COO + H+ + e− | (2) |
![[double bond splayed left]](https://www.rsc.org/images/entities/char_e009.gif) C C![[double bond, length as m-dash]](https://www.rsc.org/images/entities/char_e001.gif) O + e− ⇔ O + e− ⇔ ![[double bond splayed left]](https://www.rsc.org/images/entities/char_e009.gif) C–O– C–O–
| (3) |
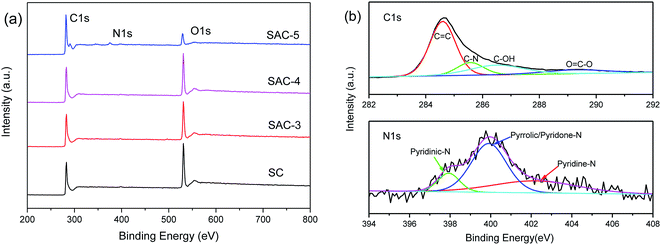 | ||
| Fig. 5 (a) XPS spectra of SC and SAC-x, and (b) C1s and N1s peak-differentiating-fitting in the XPS spectra of SAC-4. | ||
| Sample | C (%) | O (%) | N (%) |
|---|---|---|---|
| SC | 69.11 | 30.2 | 0.69 |
| SAC-3 | 72.38 | 27.19 | 0.43 |
| SAC-4 | 72.92 | 26.58 | 0.5 |
| SAC-5 | 90.26 | 9.41 | 0.33 |
N2 adsorption–desorption analysis was performed so as to study the porosity of the prepared materials. According to the classification by the International Union of Pure and Applied Chemistry (IUPAC), all of the SAC-x materials in Fig. 6a have a higher N2 adsorption capacity and show Type-I adsorption isotherm characteristics. When the relative pressure is P/P0 < 0.05, the volumetric adsorption is sharply increased, which indicates that there exist plenty of micropores.10 For the samples, accompanying the Type-H4 hysteresis loop (p/p0 = 0.45), a typical Type-IV isotherm can be observed, indicating that there exist micropores and mesopores.44 When the relative pressure is close to 1, the adsorption capacity is slightly increased, showing that the samples also contain a small quantity of macropores.45
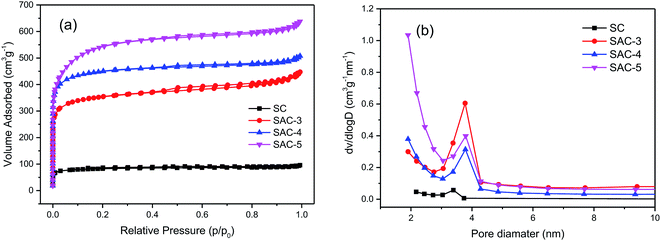 | ||
| Fig. 6 (a) N2 adsorption isotherms of SC and SAC-x, and (b) pore size distributions of SC and SAC-x. | ||
The pore characteristics of all the samples are summarized in Table 2. When the dose of KOH is increased from x = 3 to 5, the specific surface areas of SAC-3, SAC-4 and SAC-5 are increased from 1137.70 to 1433.76 to 1785.41 m2 g−1, respectively. From SAC-3 to SAC-4, the external surface areas are almost unchanged, and the micropore areas are increased from 817.33 to 1099.55 m2 g−1. When the KOH dose is increased to 5, the mesopore surface area is increased from 334.21 to 778.29 m2 g−1. The micropore area is slightly reduced (from 1099.55 to 1007.12 m2 g−1). This trend indicates that the primary micropores are produced mainly by inserting KOH or its corresponding metal K into the carbon layer and etching the carbon skeleton.46 With higher alkali doses, the corrosive materials not only produce more micropores, but also further etch the walls of the micropores, enlarge the pore size and reduce the proportion of microporous area,47 leading to such an irregular trend. It is obvious that when the optimal KOH dose is 4, the micropore area is maximal. The pore size distributions of the SC and SAC-x samples are obtained based on the theory of BJH. As shown in Fig. 6a, pores with a size of 0–2 nm are dominant among the porous structures of all the samples. This kind of microporosity can benefit charge storage to great extent, thereby enhancing the capacitance of the electrodes.48 Compared with the SAC-x sample, the unactivated SC shows a much smaller BET surface area (267.04 m2 g−1) and a relatively smaller porosity.
| Sample | BET SSA (m2 g−1) | Pore volume (cm3 g−1) | Average pore width (nm) | ||||
|---|---|---|---|---|---|---|---|
| Total | Micro | Meso | Total | Micro | Meso | ||
| SC | 267.04 | 202.16 | 64.88 | 0.15 | 0.10 | 0.05 | 4.7 |
| SAC-3 | 1137.70 | 817.33 | 320.37 | 0.69 | 0.41 | 0.28 | 4.6 |
| SAC-4 | 1433.76 | 1099.55 | 334.21 | 0.78 | 0.55 | 0.23 | 3.9 |
| SAC-5 | 1785.41 | 1007.12 | 778.29 | 0.84 | 0.51 | 0.33 | 3.3 |
3.2 Electrochemical performance
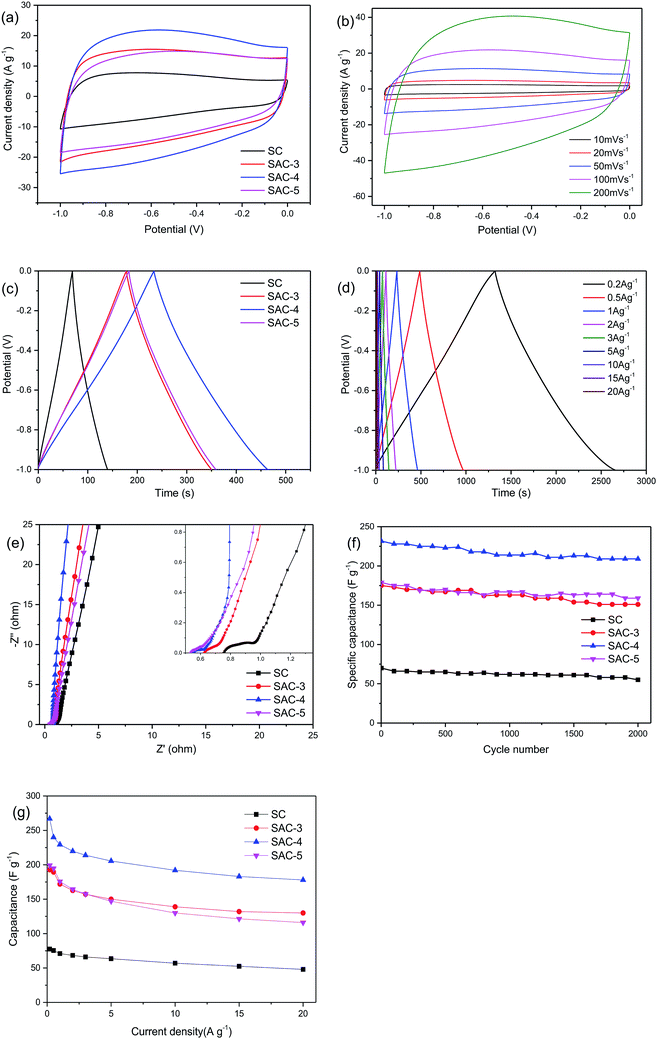
Due to the higher BET specific surface area and different types of pore structures, the electrochemical performance of SAC-x as a supercapacitor electrode is expected. In order to study the capacitance performance of sakura-based activated carbon, CV and constant current charge/discharge measurements were performed in the potential window of −1.0 to 0 V. Fig. 7a shows the CV curves of the electrode with a scan rate of 100 mV s−1. The curves present approximately rectangular shapes, showing double-layer capacitance behavior. As mentioned above, due to the presence of oxygen functional groups and a small amount of N element, the redox reaction causes a high voltage hump from −0.6 V to −0.2 V, which is similar to the reported literature.11 Moreover, it is clear that the CV curve area of SAC-4 is larger than those of the SC and other SAC-x samples, which means that SAC-4 has the highest capacitance. The CV curves (10–200 mV s−1) of SAC-4 at different scanning rates are shown in Fig. 7b and also maintain approximate rectangular shapes at 200 mV s−1. This is mainly ascribed to the SAC-4 pore structure and the larger micropore area, as well as the relatively short diffusion distance of the dielectric ions from the mesopores to the micropores.49The GCD curves of SC and SAC-x when the current density is 1 A g−1 are shown in Fig. 7c. The curves show isosceles triangle shapes, indicating the better capacitive behavior of the EDLC. The slight distortion may be caused by the pseudo-capacitance generated by the functional groups containing heteroatoms (N and O). The specific capacitance of the GCD curves can be calculated using eqn (4):
 | (4) |
| Material | SBET (m2 g−1) | Specific capacitance (F g−1) | Current density (Ag−1) | Electrolyte | Ref. |
|---|---|---|---|---|---|
| Soybean | 1749 | 243.2 | 0.5 | 6 M KOH | 18 |
| Nori | 638.6 | 220 | 0.1 | 6 M KOH | 19 |
| Perilla frutescens | 655 | 270 | 0.5 | 6 M KOH | 20 |
| Paulownia flower | 1471 | 297 | 1 | 1 M H2SO4 | 21 |
| Loofah | 2718 | 309.6 | 1 | 6 M KOH | 22 |
| Potato residue | 1052 | 255 | 0.5 | 2 M KOH | 23 |
| Human hair | 1306 | 340 | 1 | 6 M KOH | 24 |
| Silkworm | 2523 | 304 | 1 | 6 M KOH | 25 |
| Peanut shell | 1565 | 245 | 1 | 6 M KOH | 26 |
| Sakura | 1433.8 | 265.8 | 0.2 | 6 M KOH | This work |
The electrochemical impedance spectra of the electrode material are shown in Fig. 7e. As is well known, the Nyquist diagram mainly consists of three parts: a semicircle in the high frequency area, a straight line with a slope of 45° in the low frequency area, and a straight line with a slope of more than 45° in the extreme low frequency area. As shown in the partial enlargement in the inset of Fig. 7e, the intercept of the real axis represents the series resistance (Rs), which is the sum of the ionic resistance of the electrolyte, the resistance of the intrinsic active material, and the contact resistance between the electrode and the collector electrode.52,53 For the SC, SAC-3, SAC-4 and SAC-5 capacitors, the Rs values are 0.77, 0.62, 0.55 and 0.47 V, respectively. At the same time, SAC-4 exhibits a semicircle with a smaller diameter than the other semicircles. This semicircle is related to the Faraday process of the charge transfer at the electrode/electrolyte interface. A smaller semicircle means that the charge transfer is faster and the resistance is smaller. In addition, the straight line with a slope close to 1 for SAC-4 also indicates that ions have a faster transfer rate on the electrode surface.54,55 The cycling stability is another key parameter that determines the practical application of supercapacitors. The cycle lives of the four electrodes of SC and SAC-x were tested in 6 M KOH electrolyte when the current density was 1 A g−1. As shown in Fig. 7f, after 2000 consecutive charge–discharge cycles, the specific capacitance of the SAC-4 electrode was maintained as 209 F g−1, which corresponds to 90.2% of its initial value, indicating that the SAC-4 electrode has excellent cycling stability.
The specific capacitance of sakura carbon was calculated as shown in Fig. 7g. Because SC is not activated, it exhibits poor performance. After activation with KOH, the specific capacitance first increased and then decreased. It can be seen that excess KOH does not favor an increase of the specific capacitance. When the current density is 0.5 A g−1, the specific capacitances of SAC-3, SAC-4 and SAC-5 are 189.4 F g−1, 240 F g−1 and 194.8 F g−1, respectively. When the current density is increased to 20 A g−1, the initial specific capacitance retention rates of SAC-3, SAC-4 and SAC-5 are 68.6%, 74.1% and 59.5%, respectively. Such changes may be related to the changes in the porous structure and the reduction in the degree of graphitization.
4 Conclusions
A carbonaceous material with a porous structure is prepared by combining simple carbonization and KOH activation with sakura petals as raw materials, and the porous properties can be controlled by changing the dose of KOH. The functional groups on the surface of the prepared porous carbon were characterized using FT-IR spectroscopy, showing that functional groups containing more oxygen are introduced after the alkali activation. According to BET and BJH theories, the pore size distributions, the average pore diameters and the specific surface areas of the samples were calculated so as to determine that the specific surface area of SAC-4 is 1433.8 m2 g−1 and the average pore diameter is 3.9 nm. The SEM and TEM analyses further confirm that more micropores, mesopores and even macropores are produced in the alkali activation step. In a water-based three-electrode system, the sakura-derived activated carbon showed a specific capacitance of 265.8 F g−1 when the current density was 0.2 A g−1. After 2000 cycles, the initial specific capacitance is maintained as 90.2%. Therefore, it can be concluded that SAC-4 has great potential as an excellent electrode material for practical applications in the future.Conflicts of interest
There are no conflicts to declare.References
- Y. Liang, Y. Li, H. Wang and H. Dai, J. Am. Chem. Soc., 2013, 135, 2013–2036 CrossRef CAS PubMed.
- A. Divyashree, A. B. A. M. Shoriya, S. Yallappa, K. Chaitra, N. Kathyayini and H. Gurumurthy, J. Energy Chem., 2016, 25, 880–887 CrossRef.
- X. Han, M. Funk, F. Shen, Y. Chen, Y. Li, C. Campbell, J. Dai, X. Yang, J. Kim, Y. Liao, J. Connell, V. Barone, Z. Chen, Y. Lin and L. Hu, ACS Nano, 2014, 8, 8255–8265 CrossRef CAS PubMed.
- A. Ehsani, E. Kowsari, M. Dashti Najafi, R. Safari and H. Mohammad Shiri, J. Colloid Interface Sci., 2017, 503, 10–16 CrossRef CAS PubMed.
- E. Frackowiak and F. Béguin, Carbon, 2001, 39, 937–950 CrossRef CAS.
- Y. Zhang, S. Yu, G. Lou, Y. Shen, H. Chen, Z. Shen, S. Zhao, J. Zhang, S. Chai and Q. Zou, J. Mater. Sci., 2017, 52, 11201–11228 CrossRef CAS.
- D. Xie, X. H. Xia, W. J. Tang, Y. Zhong, Y. D. Wang, D. H. Wang, X. L. Wang and J. P. Tu, J. Mater. Chem. A, 2017, 16, 7578–7585 RSC.
- X. X. Gu, C. J. Tong, S. Rehman, L. M. Liu, Y. L. Hou and S. Q. Zhang, ACS Appl. Mater. Interfaces, 2016, 25, 15991–16001 CrossRef PubMed.
- D. P. Qiu, N. N. Guo, A. Gao, L. Zheng, W. J. Xu, M. Li, F. Wang and R. Yang, Electrochim. Acta, 2019, 294, 398–405 CrossRef CAS.
- J. Niu, J. J. Liang, R. Shao, M. Y. Liu, M. L. Dou, Z. L. Li, Y. Q. Huang and F. Wang, Nano Energy, 2017, 41, 285–292 CrossRef CAS.
- X. H. Wang, H. T. Zhou, E. Sheridan, J. C. Walmsley, D. D. Ren and D. Chen, Energy Environ. Sci., 2016, 9, 232–239 RSC.
- Z. Y. Sui, Q. H. Meng and J. T. Li, J. Mater. Chem. A, 2014, 2, 9891–9898 RSC.
- B. J. Zhu, K. X. Li, J. J. Liu, H. Liu, C. G. Sun, C. E. Snape and Z. X. Guo, J. Mater. Chem. A, 2014, 2, 5490–5498 RSC.
- A. H. Lu, H. J. Bongard, F. Schueth, A. Q. Wang, T. Zhang, W. P. Zhang, G. H. Wang, D. Qian, W. C. Li and G. P. Hao, J. Am. Chem. Soc., 2011, 29, 11378–11388 Search PubMed.
- J. Liu, N. P. Wickramaratne, S. Z. Qiao and M. Jaroniec, Nat. Mater., 2015, 14, 763–774 CrossRef CAS PubMed.
- S. J. Yang, M. Antonietti and N. Fechler, J. Am. Chem. Soc., 2015, 137, 8269–8273 CrossRef CAS PubMed.
- H. L. Fan and W. Z. Shen, ACS Sustainable Chem. Eng., 2016, 4, 1328–1337 CrossRef CAS.
- R. Karthika, Y. S. Houa, S. M. Chena, A. Elangovanb, M. Ganesanb and P. Muthukrishnanc, J. Ind. Eng. Chem., 2016, 37, 330–339 CrossRef.
- C. Wang and T. Liu, J. Alloys Compd., 2017, 696, 42–50 CrossRef CAS.
- B. Liu, Y. Liu, H. Chen, M. Yang and H. Li, J. Power Sources, 2017, 341, 309–317 CrossRef CAS.
- J. Chang, Z. Gao, X. Wang, D. Wu, F. Xu, X. Wang, Y. Guo and K. Jiang, Electrochim. Acta, 2015, 157, 290–298 CrossRef CAS.
- X. L. Su, J. R. Chen, G. P. Zheng, J. H. Yang, X. X. Guan, P. Liu and X. C. Zheng, Appl. Surf. Sci., 2018, 436, 327–336 CrossRef CAS.
- G. Ma, Q. Yang, K. Sun, H. Peng, F. Ran, X. Zhao and Z. Lei, Bioresour. Technol., 2015, 197, 137–142 CrossRef CAS PubMed.
- Z. Li, L. Zhang, B. S. Amirkhiz, X. Tan, Z. Xu, H. Wang, B. C. Olsen, C. M. B. Holt and D. Mitlin, Adv. Energy Mater., 2012, 2, 431–437 CrossRef CAS.
- C. Gong, X. Wang, D. Ma, H. Chen, S. Zhang and Z. Liao, Electrochim. Acta, 2016, 220, 331–339 CrossRef CAS.
- X. He, P. Ling, J. Qiu, M. Yu, X. Zhang, C. Yu and M. Zheng, J. Power Sources, 2013, 240, 109–113 CrossRef CAS.
- X. Yu, Y. Wang, L. Li, H. Li and Y. Shang, Sci. Rep., 2017, 7, 45378 CrossRef CAS PubMed.
- M. Y. Song, Y. Y. Zhou, X. Ren, J. F. Wan, Y. Y. Du, G. Wu and F. W. Ma, J. Colloid Interface Sci., 2019, 535, 276–286 CrossRef CAS PubMed.
- S. J. Song, F. W. Ma, G. Wu, D. Ma, W. D. Geng and J. F. Wan, J. Mater. Chem. A, 2015, 3, 18154–18162 RSC.
- Y. Teng, E. Liu, R. Ding, K. Liu, R. Liu, L. Wang, Z. Yang and H. Jiang, Electrochim. Acta, 2016, 194, 394–404 CrossRef CAS.
- K. Wang, N. Zhao, S. Lei, R. Yan, X. Tian, J. Wang, Y. Song, D. Xu, Q. Guo and L. Liu, Electrochim. Acta, 2015, 166, 1–11 CrossRef CAS.
- N. N. Guo, M. Li, Y. Wang, X. K. Sun, F. Wang and R. Yang, ACS Appl. Mater. Interfaces, 2016, 8, 33626–33634 CrossRef CAS PubMed.
- W. S. Chen, H. P. Yu, S. Y. Lee, T. Wei, J. Li and Z. J. Fan, Chem. Soc. Rev., 2018, 47, 2837–2872 RSC.
- N. N. Guo, M. Li, X. K. Sun, F. Wang and R. Yang, Green Chem., 2017, 19, 2595–2602 RSC.
- C. Chen, D. F. Yu, G. Y. Zhao, B. S. Du, W. Tang, L. Sun, Y. Sun, F. Besenbacher and M. Yu, Nano Energy, 2016, 27, 377–389 CrossRef CAS.
- W. Qian, F. Sun, Y. Xu, L. Qiu, C. Liu, S. Wang and F. Yan, Energy Environ. Sci., 2014, 7, 379–386 RSC.
- B. Liu, Y. Liu, H. Chen, M. Yang and H. Li, J. Power Sources, 2017, 341, 309–317 CrossRef CAS.
- C. Peng, X. B. Yan, R. T. Wang, J. W. Lang, Y. J. Ou and Q. J. Xue, Electrochim. Acta, 2013, 87, 401–408 CrossRef CAS.
- S. P. Wang, J. N. Zhang, P. Shang, Y. Y. Li, Z. M. Chen and Q. Xu, Chem. Commun., 2014, 50, 12091–12094 RSC.
- Y. J. Kim, Y. Abe and T. Yanagiura, Carbon, 2007, 45, 2116–2125 CrossRef CAS.
- S. T. Senthilkumar, B. Senthilkumar, S. Balaji, C. Sanjeeviraja and R. Kalai Selvan, Mater. Res. Bull., 2011, 46, 1320 CrossRef CAS.
- J. N. Zhang, X. L. Zhang, Y. C. Zhou, S. J. Guo, K. X. Wang, Z. Q. Liang and Q. Xu, ACS Sustainable Chem. Eng., 2014, 2, 1525–1533 CrossRef CAS.
- T. E. Rufford, D. Hulicova-Jurcakova, Z. Zhu and G. Q. Lu, Electrochem. Commun., 2008, 10, 1594–1597 CrossRef CAS.
- J. C. Groen, L. A. A. Peffer and J. Pérez-Ramírez, Microporous Mesoporous Mater., 2003, 60, 1–17 CrossRef CAS.
- Q. Wang, J. Yan, Y. Wang, T. Wei, M. Zhang, X. Jing and Z. Fan, Carbon, 2014, 67, 119–127 CrossRef CAS.
- K. Konno, Y. Ohba, K. Onoe and T. Yamaguchiet, Carbon, 2008, 46, 721 CrossRef.
- J. Chmiola, G. Yushin, Y. Gogotsi, C. Portet, P. Simon and P. L. Taberna, Science, 2006, 313, 1760–1763 CrossRef CAS PubMed.
- R. Wang, P. Wang, X. Yan, J. Lang, C. Peng and Q. Xue, ACS Appl. Mater. Interfaces, 2012, 4, 5800–5806 CrossRef CAS PubMed.
- D. Liu, W. Zhang, H. Lin, Y. Li, H. Lu and Y. Wang, J. Cleaner Prod., 2016, 112, 1190–1198 CrossRef CAS.
- A. K. Mondal, K. Kretschmer, Y. Zhao, H. Liu, H. Fan and G. Wang, Microporous Mesoporous Mater., 2017, 246, 72–80 CrossRef CAS.
- P. Cheng, S. Gao, P. Zang, X. Yang, Y. Bai, H. Xu, Z. Liu and Z. Lei, Carbon, 2015, 93, 315–324 CrossRef CAS.
- L. Sun, C. Tian, Y. Fu, Y. Yang, J. Yin, L. Wang and H. Fu, Chemistry, 2014, 20, 564–574 CrossRef CAS PubMed.
- D. Puthusseri, V. Aravindan, S. Madhavi and S. Ogale, Energy Environ. Sci., 2014, 7, 728–735 RSC.
- L. Chen, T. Ji, L. Mu and J. Zhu, Carbon, 2017, 111, 839–848 CrossRef CAS.
- Y. Li, G. Wang, T. Wei, Z. Fan and P. Yan, Nano Energy, 2016, 19, 165–175 CrossRef CAS.
| This journal is © The Royal Society of Chemistry 2019 |

