DOI:
10.1039/C8RA05874A
(Paper)
RSC Adv., 2019,
9, 2484-2492
Fragmented lignin-assisted synthesis of a hierarchical ZnO nanostructure for ammonia gas sensing†
Received
10th July 2018
, Accepted 18th December 2018
First published on 18th January 2019
Abstract
In the present study, we demonstrated the use of fragmented lignin in the synthesis of a hierarchical-type structure of ZnO nanorods. Lignin was isolated from bagasse by the microwave assisted method and its fragmentation was achieved in alkaline conditions along with hydrogen peroxide. Lignin and fragmented lignin were purified by crystallisation followed by column chromatography and characterized by UV-visible spectroscopy, Frontier infra-red spectroscopy (FTIR), 1H-NMR and high resolution mass spectroscopy (HRMS). Fragmented lignin was utilized as a template for the synthesis of ZnO nanorods, which were characterized by powder XRD, scanning electron microscopy (SEM), transmission electron microscopy (TEM), and UV-DRS for the determination of crystal structure, particle morphology and band gap. XRD of the ZnO samples revealed a hexagonal wurtzite structure. The morphology of ZnO without fragmented lignin showed agglomerated nanoparticles and with fragmented lignin, a self-assembled hierarchical nanostructure due to nanorods of 30 nm diameter and 200–500 nm length was observed. The fragmented lignin showed a pronounced effect on the particle size and morphology of ZnO nanoparticles. We measured the response of the hierarchical ZnO nanostructure (50 ppm) for sensing NH3 in terms of change in voltage across known resistance. We observed the response and recovery upon introduction of the analyte ammonia gas at 175 °C.
1. Introduction
Lignin is a biopolymer found in the cell wall of plants. It is an amorphic three-dimensional substance with a high molecular weight.1 It is difficult to determine the molecular weight of lignin because it is a highly polydisperse material. Phenylpropane is the basic unit in the three-dimensional network of a lignin polymer. It is one of the main components of the lignocellulosic biomass of plants.2 Biomass is a natural source of lignin.3 In industries, most bio-based chemicals are produced from aliphatic and cycloaliphatic materials, which are derived from cellulose, starch, or triglycerides. However, the key chemicals are the aromatic compounds and they are derived from petroleum components. Lignocelluloses constitute 70% of the total plant biomass present on the earth with a yearly production of 200.10 tons. Lignin is nontoxic and economical.4 Lignocellulosic feedstock includes straw, switch grass, hybrid poplar, corn stover, agricultural residues, forestry residues, paper and municipal wastes.5
Lignocellulosic materials are another nominally valuable source of aromatic compounds. The structure of lignin is based on phenylpropene units; however, the presence of lignin as lignocellulose is a major impediment for fermentation. There are three general methods to fractionate biomass. The first method involves extracting lignin at a high pressure and high temperature with dioxane and 1% alkali, which is then separated out as a cellulose-rich pulp. In the presence of dioxane and 1% alkali, the core of lignin structure cannot be changed.6 The second method involves depolymerisation of the lignocellulose structure and the third method includes the dissolution of cellulose followed by re-precipitation of lignin using ionic solvents. The ionic solvent 1-ethyl-3-methylimidazolium xylenesulfonate produced 93% extraction yield and the weight of the acetylated product was found to be 2220 g mol−1.7 With alkali and peracetic acid, it simultaneously undergoes saccharification and fermentation, which gives two types of lignins: alkali lignin and PAA lignin.8 Extraction of lignin with alkali gives a product with high oxygen content, which is a natural source of antioxidants.9 Using another ionic solvent 1-butyl-3-methylimidazolium chloride gives 10.51% of lignin from 54.62% of original lignin of plant biomass.10 Nonoxidised lignin shows higher absorbance at 280 nm than oxidised lignin.11 Microwave-assisted extraction of lignin gives a highly depolymerised product, which primarily consists of syringyl components.12 Lignin shows antimicrobial activity against Gram-positive bacteria and yeast but not against Gram-negative bacteria.13 The enzyme laccase can depolymerise lignin, which results in six-fold increase in the solubility of kraft lignin than that observed without laccase.14 Petroleum phenol is obtained by the depolymerisation of lignin in the presence of a Cu-doped porous metal oxide catalyst.15 Mn3+ chloride catalyst with peroxide increases the de-polymerisation of lignin to an oxidative product, which is an oligomer with a high molecular weight (1297.466 m/z).16 Lignin has been used as a reinforcing agent for polyolefins and a low-cost antioxidant for polymers; also, at a high temperature, it increases the functions of asphalt binder.17,18 Carbon-supported Ni and Ru catalysts in the presence or absence of an acid fractionate lignin into its monomers.19 Due to the three-dimensional structure of pure lignin, it can easily aggregate and shows less solubility in neutral solutions.20 The composite of quantized alkali lignin with the zinc nitrate salt QAL/ZnO synthesized by the hydrothermal method resulted in materials with excellent UV absorption property.21 Lignosulphonate acid and 3,4-ethylenedioxythiophene formed a pickeringemulsion, which exhibited conductivity of 7.70 × 10⁻⁴ S cm−1.22 A lignin amine complex can assist the formation of petal-shaped morphology in ZnO.23 Out of the other semiconducting materials, zinc oxide exhibits a wide direct band gap of 3.37 eV and high exciton energy of 60 meV; it consists of a mixture of covalent and ionic chemical bonds. Based on this, the thermal and chemical properties of ZnO were also examined to establish its potential as a gas sensor. In this study, lignin was isolated from bagasse under microwave irradiation in an aqueous alkaline solution containing hydrogen peroxide. The major product obtained was fragmented lignin, which was characterized by UV-visible spectroscopy, Frontier infra-red (FTIR), nuclear magnetic spectroscopy (1H-NMR), and high resolution mass spectroscopy (HRMS). Furthermore, it was utilized as a template for the synthesis of nano-ZnO. Such biologically synthesised ZnO showed a wide variety of nanostructures with different morphologies; the large surface area of the nanostructure exhibited unique semiconducting property. ZnO has low toxicity and can be easily biodegraded; also, it is soluble in both acids and strong bases. ZnO has a wurtzite crystal structure, in which Zn2+ and O2− ions are arranged in a layer-by-layer manner along the vertical axis. Since there is an absence of central symmetry, it demonstrates piezoelectric properties and is considered an n-type semiconductor having a wide band gap energy of 3.37 eV, high electron mobility of charges, high isoelectric point (9.5) and 60 mV exciton binding energy.24 Therefore, the quantization of the electron energy level of ZnO nanoparticles depends on the size and homogeneity of particles. Hence, it is used for a wide range of applications such as gas sensing technology. The material used for this technology is based on nanocomposite metal oxides because they have the abilities to adsorb and capture different types of polluted and explosive gases due to their chemical and physical properties.25 Resistive gas sensors constructed based on semiconducting metal oxides provide a solid state gas sensing technology with several advantages such as simple configuration, easy fabrication, cost effectiveness and MES (microelectronic mechanical system).26 In this technology, the sensing component is supported by an inert substrate and is connected to two metallic electrodes. The resistor type sensor measures the change in the electrical resistance when there is an interaction between the sensing material and the analyte gas. A typical interaction involved in this technology is the transfer of electrons from the analyte gas to the sensing materials. Surface conduction-based sensors are more effective than bulk conduction-based sensors because they work at low and medium temperatures. Many approaches were employed to improve the ZnO gas sensing performance using different methods to synthesize ZnO with various morphologies and compositions.27 The necessary conditions for gas sensing materials include rapid response with high sensitivity at low temperature, morphology, large surface area, junction between crystals, oxygen storage capacity and mesoporous nanostructure. The traditional method for the synthesis of ZnO nanoparticles involves a high-temperature solid state reaction method. In this method, all the properties of materials cannot be controlled and it is also time consuming. Therefore, ZnO nanoparticles can be prepared by different methods on a large scale such as sol–gel, chemical co-precipitation, hydrothermal reaction and spinning. In the current study, ZnO synthesis achieved by using the co-precipitation method is economical and eco-friendly and gives modified properties with good yield in less time.
In view of the above discussion, we designed the isolation method of lignin from bagasse under microwave irradiation in the presence of an alkaline solution and H2O2 at optimum pH. The isolation followed by fragmentation with H2O2 resulted in a fragmented product of lignin having five major fragments with the highest molecular weight being 534 m/z. All the above-mentioned polymeric materials were characterized by UV-visible spectroscopy (UV-Visible Perkin Elmer Lambda-950), FTIR, 1H-NMR and HRMS. This fragmented lignin was used as a template for the synthesis of ZnO nanorods, which were characterized by UV-visible spectroscopy, XRD (75 technique, XRD-Bruker Advance D8), SEM, TEM, BET (the Micrometrics 2720; Chemisoft TPX) and PL spectra. The biosynthesized ZnO showed high gas (ammonia) sensitivity at 175 °C and at 50 ppm.
2. Experimental section
2.1. Chemicals
In the present study, hydrogen peroxide (lobachem), zinc acetate (lobachem), sodium hydroxide (lobachem) were used. Sugarcane bagasse was obtained from a local sugar mill and washed with 0.1 N HCl followed by distilled water to remove the dust particles and acid soluble cellulose. It was dried in air and crushed to obtain 100 mesh size.
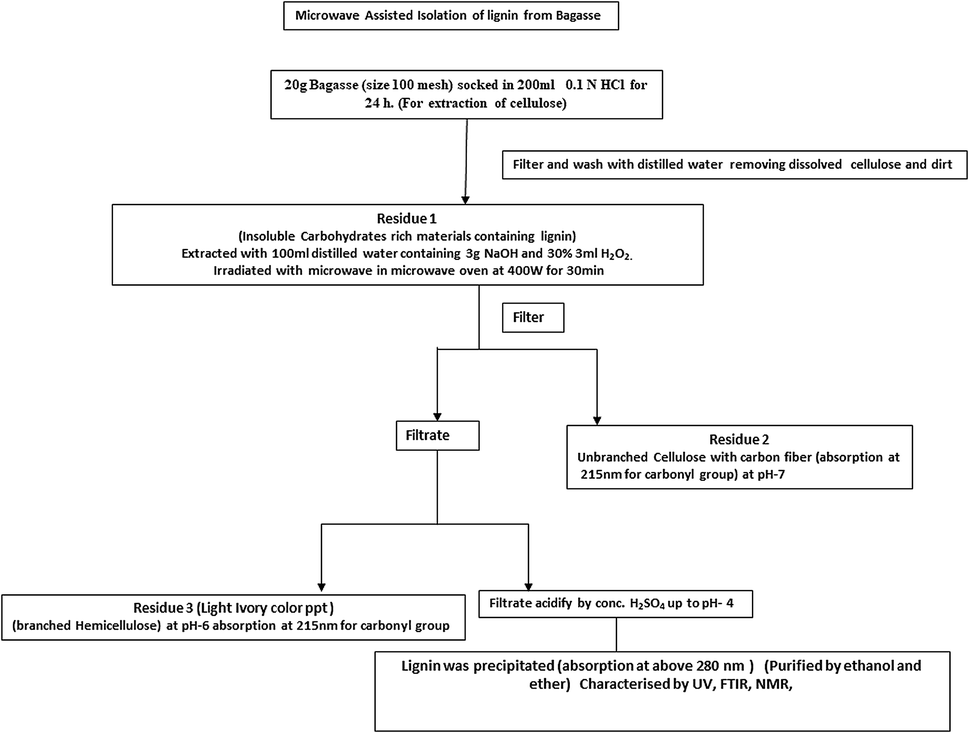
2.2. Microwave-assisted isolation of lignin from bagasse
A domestic microwave oven (Samsung microwave oven; 700 W and 2450 MHz frequency) was used for the isolation of lignin from bagasse. Twenty gm of bagasse was soaked in 200 mL 0.1 N HCl for 24 h to remove the acid-soluble cellulose; this is residue 1. Further, residue 1 was added in an aqueous solution of 3 g NaOH and 1% H2O2. Then, it was irradiated in the microwave oven at 400 W for 30 min. It was filtered again to remove the carbon fibres, followed by acidifying at a different pH to separate out the cellulose and lignin, as given in Fig. 1.
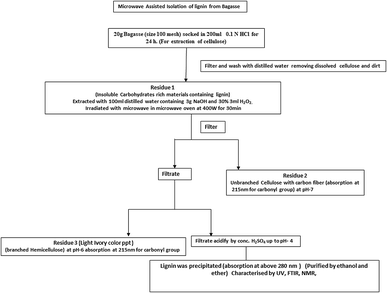 |
| | Fig. 1 Flow diagram of the isolation process of lignin from bagasse under microwave. | |
2.3. Fragmentation of lignin
For fragmentation of lignin, 5 g of purified and air-dried lignin was dissolved in 50 mL 0.1 M aqueous sodium hydroxide solution at pH −12. It was stirred for 30 min at 40–50 °C. Then, 100 mL 1% H2O2 solution was added drop-wise to the above solution over the period of 1 hour. The resultant solution was filtered, cooled and acidified with conc. H2SO4, which resulted in the formation of an ivory-coloured precipitate at pH 4.5. This was purified by column chromatography (15 cm column height, stationary phase silica gel 60–120 mesh, mobile phase 30% ethyl acetate and 70% n-hexane) and characterized by UV-visible spectroscopy, FTIR, 1H-NMR and HRMS.
2.4. Synthesis of ZnO with fragmented lignin and without fragmented lignin
First, 0.1 g fragmented lignin and 0.1 M 100 mL aqueous sodium hydroxide were sonicated for 30 min to obtain a homogenous solution. Then, after sonication of the solution, it was heated and stirred from 80 to 90 °C and 2 g zinc acetate was added in the same solution. After period of 1 h, a white-coloured precipitate was obtained, which was filtered and washed with distilled water and absolute ethanol to remove sodium hydroxide and fragmented lignin. Then, it was dried in an oven at 90 °C for 1 hour. The same method was followed for the synthesis of ZnO without fragmented lignin.
2.5. Gas sensing by ZnO
To study the sensing property of ZnO against ammonia gas, a zinc oxide thick film was prepared by the doctor blade method; then, it was calcined at 400 °C for 30 min. The sensing was studied at 175 °C with an applied resistance of 400 kΩ; a linear and reversible response was shown by the ZnO film. The response of the ZnO film to NH3 in the air was determined in terms of change in resistance,28 as shown in Fig. 2.
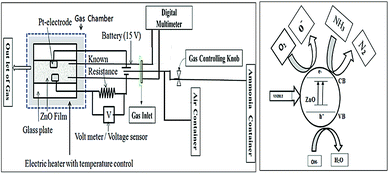 |
| | Fig. 2 Gas sensing mechanism. | |
3. Results and discussion
3.1. Characterisation
Before characterisation of lignin, fragmented lignin was again re-crystallized and washed with 0.01 N HCl followed by distilled water and subsequently dried in an oven. The same crystallized product was used further for characterization.
3.2. UV-visible absorption characteristics
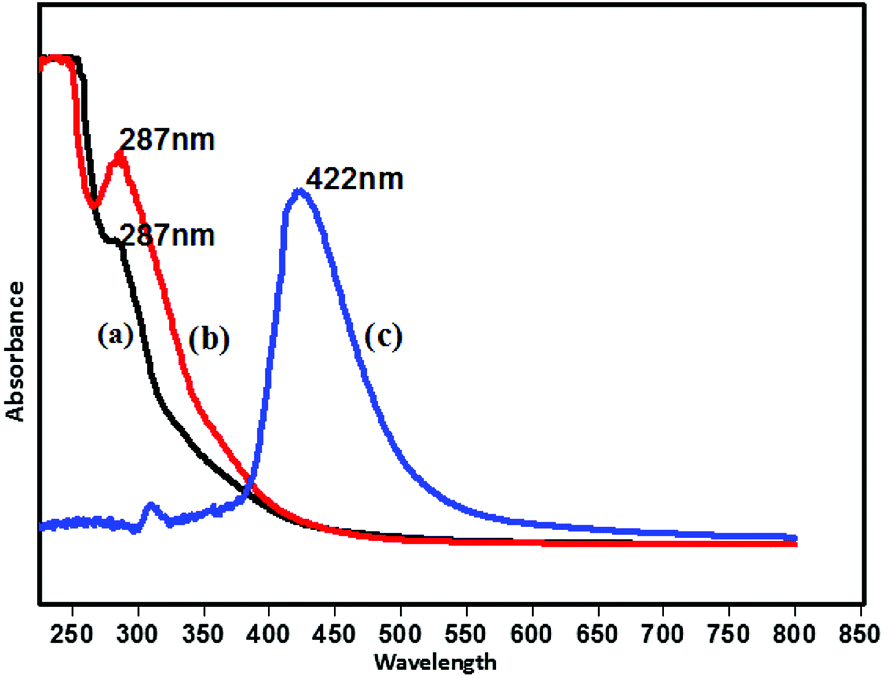
The UV-visible spectra of isolated lignin, fragmented lignin and standard lignin (Sigma-Aldrich) are given in Fig. 3. Isolated lignin and standard lignin samples showed the same absorption maxima (287 nm), which can be attributed to the presence of extended conjugation and different substituents on the benzene ring. The absorption observed in the UV region indicated that the molecules have high energy and short wavelength. The fragmented product showed a completely different nature as compared to lignin. The spectrum of fragmented lignin showed an absorption maximum at 422 nm, which corresponded to hydroxycinnamic acid.29
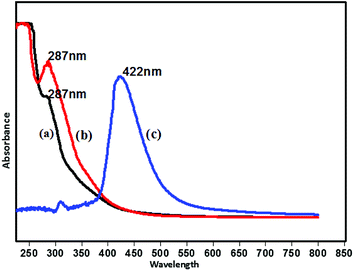 |
| | Fig. 3 UV-visible spectra: (a) standard lignin, (b) isolated lignin, (c) fragmented lignin. | |
The peak at 422 nm in the UV-visible spectrum of fragmented lignin could account for the n → π* transition. This transition may include unconjugated chromophores such as the oxygen atoms of phenolic groups, esters and ethers.
3.3. FTIR characteristics
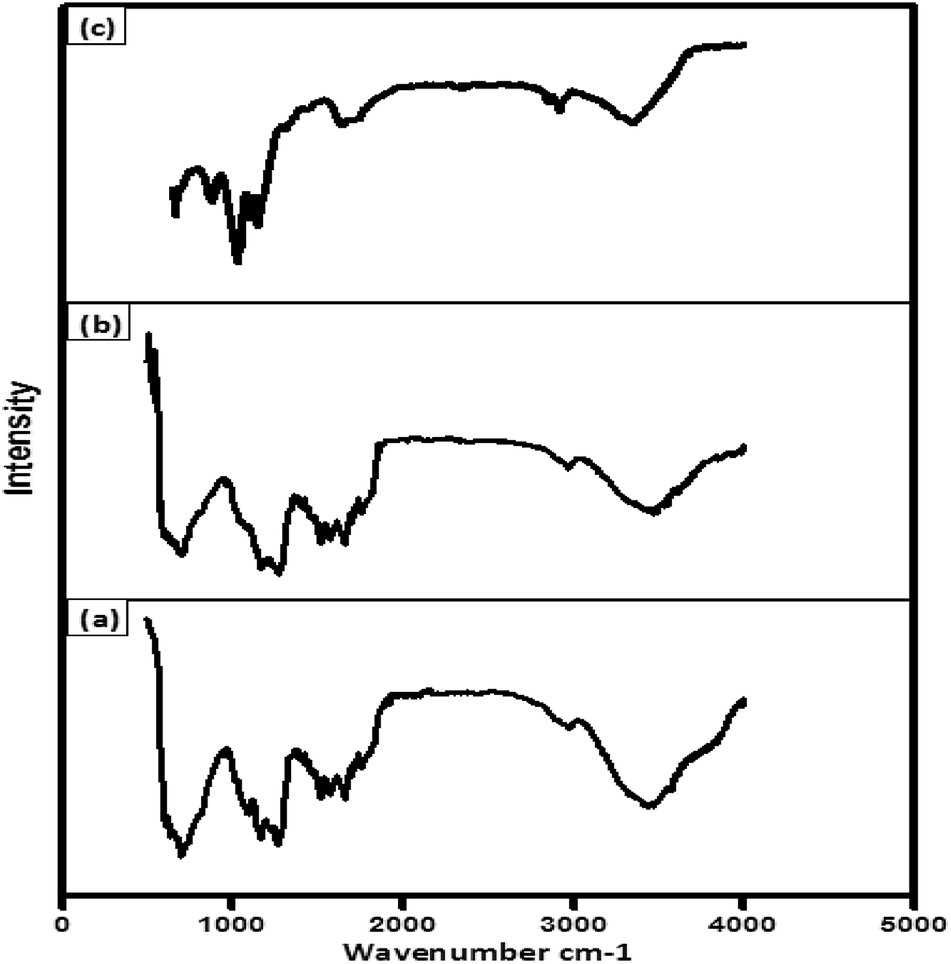
The FTIR spectra of isolated lignin and fragmented lignin are depicted in Fig. 4a and b. The spectrum of isolated lignin was in good agreement with the band positions of standard lignin. The FTIR bands of isolated lignin indicated that the core structure of the lignin polymer remained intact during the isolation process. The major bands in the FTIR spectra of lignin could be ascribed to the presence of different functional groups in the structure. The broad band at 3452 cm−1 could be attributed to a hydroxyl group with intra-molecular hydrogen bonding.30 The band at 1519–1673 cm−1 corresponded to the aromatic ring structure in lignin.31 A fingerprint region was observed due to the vibrations of methylene groups and hydroxyl groups at 1272 cm−1 and 1154 cm−1 due to the unsymmetrical stretching of the ether group (C–O–C). The stretching at 697 cm−1 could be assigned to the presence of an aromatic ring skeleton in lignin.32
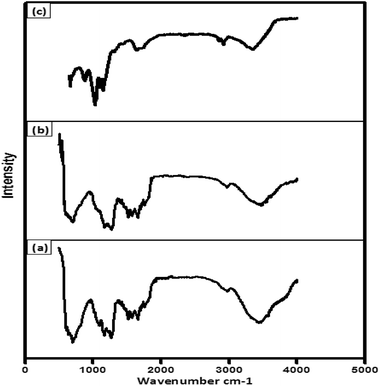 |
| | Fig. 4 FTIR: (a) standard lignin, (b) isolated lignin, (c) fragmented lignin. | |
The FTIR spectrum of fragmented lignin given in Fig. 4c shows major absorption bands in the region from 800 cm−1 to 4000 cm−1. The band at 3354 cm−1 can be attributed to the presence of –OH groups in the structure and the band at 1629–1761 cm−1 can be assigned to the presence of aromatic compounds or diketonic stretching. The band at 1029 cm−1 represents the C–O group, whereas the band at 1150 cm−1 can be assigned to C–O–C stretching.33–38 The band at 890 cm−1 can be assigned to the presence of a para-substituted aromatic ring in fragmented lignin.
3.4. 1H-NMR
For 1H-NMR analysis, 30–40 mg of lignin sample and standard were dissolved in 2 cm3 of DMSO-d6 solvent and their spectra were recorded at room temperature. During analysis, both the sample and standard showed nearly equal δ values: 1.2δ for the methylene proton present on carbon atom and from 2.3 to 2.5δ for the α proton on carbonyl group. Additionally, lignin has a methoxy group directly attached to the benzene ring with 3.7δ value and a vinylic proton with values from 5.5 to 5.7δ. The aromatic proton exhibited values in the range of 6.8–6.9δ; 8.7δ and 7.4δ were observed for the protons of p-coumaric acid structures.39
3.5. HRMS of fragmented lignin
HRMS afforded information about the fragments of lignin, which were formed during the fragmentation process, as shown in Fig. 5. From the observed m/z ratios in HRMS, some of the fragments can be assigned as follows.
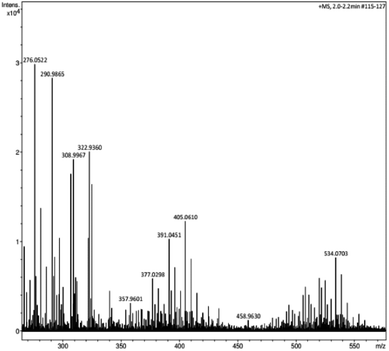 |
| | Fig. 5 High resolution mass spectroscopy of fragmented lignin. | |
Using high-resolution mass spectroscopy, we detected five major fragments of lignin having different structural arrangements:
(1) m/z = 276 represents 4-(4-(hydroxymethyl)-3-methoxyphenoxy)-2-methoxyphenol, (2) m/z = 290 suggests the β-ethereal linkage of phenolic structures, (3) m/z = 322 corresponds to sinapic acid (3-(4-hydroxy-3,5-dimethyl phenyl)), (4) m/z = 405 denotes dimeric fragments, and (5) m/z = 534 indicates the β-O-4 dimer with attachment to different carbon atoms or –CH2 groups present in the molecule.40,41
ZnO is a well-known photocatalyst. The particle morphology and crystallite and grain sizes of these catalysts can play an important role in their photocatalytic activity. Thus, herein, we synthesized ZnO nanoparticles in the presence and absence of fragmented lignin. The results showed that fragmented lignin has a pronounced effect on the morphology and particle size of ZnO nanoparticles.
4. Characterization of ZnO
4.1. Structural study
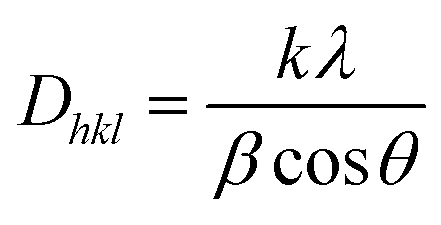
The purity of crystalline phase and composition of the nanoparticles obtained by biosynthesis using fragmented lignin from bagasse were analysed by XRD (Fig. 6). The Debye–Scherrer equation used for the calculation of the mean particle diameter of the nanoparticles is as follows:
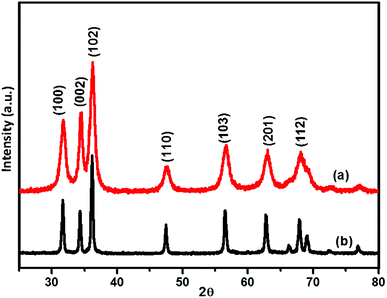 |
| | Fig. 6 XRD of (a) ZnO with fragmented lignin and (b) ZnO without fragmented lignin. | |
Here, K is the shape constant, λ is the wavelength of the X-ray, and β1/2 and θ are the half width of the peak and half of the Bragg angle, respectively. The major peaks in the XRD patterns of ZnO synthesized with and without fragmented lignin did not show any difference in peak positions but an appreciable difference in peak intensities was observed. The observed peaks at 2θ = 31.61°, 34.32°, 36.14°, 47.37°, 56.48°, 62.71° and 68.28° corresponded to the (100), (002), (102), (110), (103), (201), and (112) planes, which are characteristics of the hexagonal crystalline structure of ZnO (JCPDS file 36-1451 of ZnO). Sharp and intense peaks in the XRD results of both ZnO samples synthesized with lignin and without lignin indicated high crystallinity and polycrystalline nature of ZnO nanoparticles. Moreover, no extra peaks other than those corresponding to the hexagonal crystalline phase of ZnO were found in the XRD results, demonstrating the purity of both ZnO samples. ZnO synthesized in the presence of lignin fragments showed an intense peak, which belonged to the (200) plane; it was higher than that observed for the (100) plane, which suggested that this ZnO has weak preferential growth along the c-axis. The lattice parameters were calculated for both types of ZnO samples. The lattice parameters for ZnO with fragmented lignin, ZnO without fragmented lignin and ZnO JCPDS 36-1451 were as follows: a = 3.2509, 3.2642, and 3.249 Å; c = 5.2036, 5.2326, and 5.206 Å; c/a = 1.6000, 1.6020, and 1.602 Å. The crystal volumes were 47.62, 47.11, and 47.62 cm3; the X-ray density (g cm−3) values were 5.2066, 5.1760, and 5.206. The observed lattice parameter matches with JCPDS file 36-1451. The crystallite sizes from 30 to 70 nm and from 32 to 50 nm. As no characteristic peak for impurity was found, the synthesised ZnO sample can be considered to have good crystalline nature. With the similarity in the unit cell parameters of both types of ZnO samples with fragmented lignin and without fragmented lignin, the major difference was observed in the peak widths. ZnO synthesized with fragmented lignin showed broader XRD peaks compared to ZnO synthesized without fragmented lignin. The broadening of peaks in XRD was a consequence of decrease in crystallite size. The crystallite sizes of ZnO were calculated as 22.4 nm when synthesized with fragmented lignin and 34.2 nm without fragmented lignin.
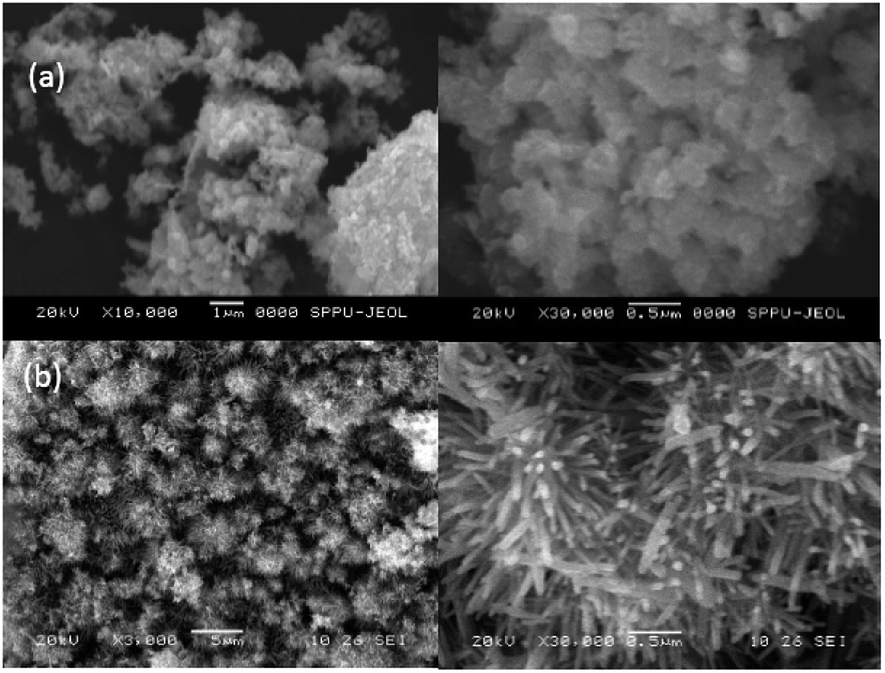
4.2. Particle morphology
The ZnO microstructures were studied by SEM imaging. The SEM images of ZnO synthesized without and with fragmented lignin are shown in Fig. 7a and b, respectively. The elongated rod-shaped morphology with a hierarchical-type structure was observed, which indicated that the presence of lignin fragments in the reaction media may inhibit three-dimensional growth but promote one-dimensional growth of ZnO grains. Such a process resulted in the formation of rod-shaped ZnO nanoparticles. The nanorods of ZnO with small particles of size 80–100 nm were observed under high magnification of the SEM image (Fig. 7b). The SEM images of ZnO synthesized without fragmented lignin (Fig. 7a) show agglomeration with no special morphology. Lignin and ultimately lignin fragments contain a large number of polar functional groups such as –OH, –OCH3, ![[double bond splayed left]](https://www.rsc.org/images/entities/char_e009.gif) C
C![[double bond, length as m-dash]](https://www.rsc.org/images/entities/char_e001.gif) C
C![[double bond splayed right]](https://www.rsc.org/images/entities/char_e00a.gif) and C–O–C. These functional groups might play an important role in the formation of ZnO nanorods. Due to the presence of these functional groups, lignin fragments can act as complexing, capping, and stabilizing agents for Zn2+ ions. The polymeric nature of lignin fragments can create a protective and functionalized surrounding for the metal ions, which might play a structure-directing role in the formation of rod-shaped ZnO nanoparticles.
and C–O–C. These functional groups might play an important role in the formation of ZnO nanorods. Due to the presence of these functional groups, lignin fragments can act as complexing, capping, and stabilizing agents for Zn2+ ions. The polymeric nature of lignin fragments can create a protective and functionalized surrounding for the metal ions, which might play a structure-directing role in the formation of rod-shaped ZnO nanoparticles.
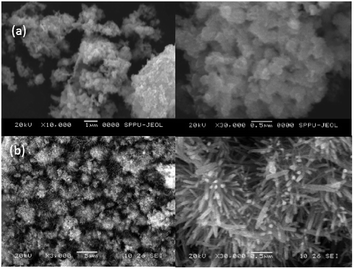 |
| | Fig. 7 SEM photographs of ZnO: (a) SEM of ZnO without fragmented lignin; (b) SEM of ZnO with fragmented lignin. | |
4.3. Transmission electron microscopy (TEM)
The microstructures of polycrystalline ZnO were examined by TEM, as shown in Fig. 8. The morphology of ZnO particles exhibited axial nanorods with diameter of 30 nm, which was very close to the crystallite size calculated by the Debye–Scherrer equation. The interplaner spacing was 0.2798 nm, which corresponded to the (100) plane of ZnO.
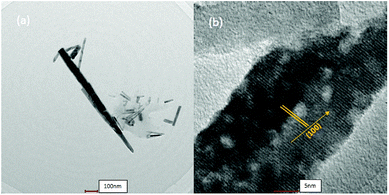 |
| | Fig. 8 TEM of ZnO nanorods. | |
4.4. Optical studies
The band gap energy of ZnO synthesized with and without fragmented lignin was investigated using Tau's relation. The difference in the band gaps of ZnO synthesised with and without lignin fragments is given in Fig. 9. The ZnO nanorods formed in the presence of lignin fragments showed decrease in band gap at 3.04 eV, whereas ZnO obtained without lignin fragment exhibited band gap of 3.2 eV. The ZnO nanorods showed a red shift in the band gap, which might be due to the presence of more oxygen defects formed due to ether linkage and phenolic groups.23
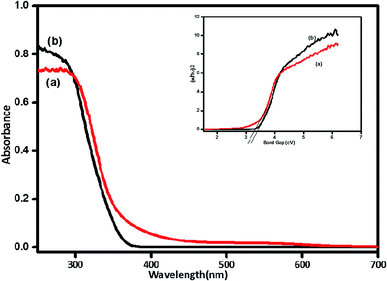 |
| | Fig. 9 UV-visible spectra and UVDRS of (a) ZnO with fragmented lignin and (b) ZnO without fragmented lignin. | |
4.5. Specific surface area
We determined the bulk density and BET surface area of ZnO synthesized by both methods. ZnO obtained using fragmented lignin showed a higher BET surface area due to smaller grain size. Initially, for surface area measurements, samples were calcined at 200 °C to further remove moisture and then processed for nitrogen adsorption measurements, as shown in Table 1.
Table 1 Specific surface area
| |
Bulk density g cm−3 |
BET surface area m2 g−1 |
| ZnO-with fragmented lignin |
1.81 |
132 |
| ZnO-without fragmented lignin |
1.75 |
115 |
5. Formation mechanism of zinc oxide nanostructure
In the alkaline solution of fragmented lignin, zinc acetate was added slowly with constant stirring at 80–90 °C for 1 h. Initially, zinc acetate formed zinc hydroxide, which is amphoteric in nature; this indicates that the hydroxide of zinc is soluble in alkaline solution as well as in acidic solution. When zinc hydroxide was formed, intermolecular hydrogen bonding existed between zinc hydroxide and fragmented lignin because zinc is more electropositive than the carbon of fragmented lignin. After prolonged reaction beyond 1 h at 80–90 °C, precipitation of ZnO occurred. The detailed schematic mechanism is provided in the ESI-1.† The fragmented lignin might act as a growth directing agent. Initially, nuclei of ZnO were formed, and they further grew one dimensionally to form nanorods of ZnO. These nanorods further self-assembled and formed hierarchical nanostructures.
6. Gas sensing by ZnO
In the present study, the NH3 sensing property of ZnO was recorded as the change in resistance at 175 °C, where ZnO showed reversibility in NH3 sensing. The resistance increased as the concentration of ammonia gas increased, which is the typical property of n-type semiconductors.42 The gas sensing property was studied at different temperatures from 125 to 225 °C; herein, we found that the best working temperature was 175 °C (ESI-2†).
Fig. 10(a) represents the gas sensing behavior of ZnO synthesized with fragmented lignin. This was investigated by exposing the material to different concentrations of ammonia gas at 175 °C. Initially, the response of ZnO material increased as the ammonia gas concentration increased up to a maximum at 50 ppm and then, the response remained constant. This showed that all the pores and active sites of the material are completely engaged by the ammonia molecules at 50 ppm concentration. At low (5 ppm) concentrations, the response and recovery required very long time; this may due to the slow speed of gas, resulting in a slow diffusion process, as shown in the inset of Fig. 10a. Furthermore, the response and recovery of ammonia gas from 25 ppm to 75 ppm were very high. Fig. 10b shows the repeatability of the ZnO material at 50 ppm of ammonia gas with five recovery cycles at 175 °C, demonstrating a very good and continuous response. To determine the selectivity of the sensor, the material should be exposed to different types of gases. Therefore, the gas sensing response of ZnO material was tested with ammonia, acetone and toluene at 50 ppm and 175 °C, as shown in Fig. 10c. The sensor exhibited high responses of about 71.11, 58.75, 56.19. The response and recovery of ammonia gas were much better than those observed for acetone and toluene. The smaller molecular weight and size of ammonia may enable a fast adsorption and desorption process of gas sensing. Since the long-term stability study is more important for practical applications, the sensing property at constant temperature and concentration was studied at 2 day intervals for 30 days. At the end of 15 days, no change was observed. However, after 15 days, there was slight decrease in response and recovery due to the slow desorption of ammonia gas. There was no change in the XRD peak positions before and after exposure to gas, which indicated that no doping was observed after 30 days of experiment (ESI-3†). ZnO synthesized without fragmented lignin showed longer response and recovery times than ZnO with fragmented lignin. The five cycles of gas sensing response and recovery by ZnO without fragmented lignin are presented in ESI-4.† The agglomerated and bulky crystals of ZnO without fragmented lignin were responsible for the low number of active centers available for adsorption and desorption processes. These observations indicated that ZnO synthesized in the presence of fragmented lignin showed a higher gas sensing response than that synthesized without fragmented lignin. This can be ascribed to the hierarchical structure of ZnO, which provides more surface area and helps trap more gas molecules.
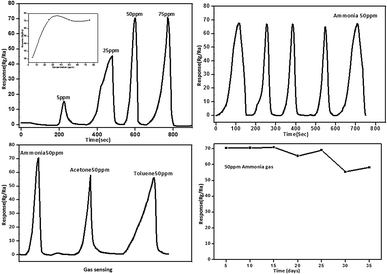 |
| | Fig. 10 Graph of gas sensing response: (a and b) ZnO with fragmented lignin, (c) response of ZnO film prepared with fragmented lignin to ammonia, acetone and toluene at 175 °C and 50 ppm concentration, (d) the response stability curve of ZnO film to 50 ppm ammonia at 175 °C. | |
Table 2 shows that when ammonia gas is injected, an immediate response is observed within 2 s, which continues upto 42 s for ZnO with fragmented lignin. For ZnO without fragmented lignin, the initial response time is 10 s; then, it shows a maximum value upto 57 s. Difference in the times for the recovery of the gas is observed because ZnO obtained by biosynthesis has a highly porous structure and rod-shaped morphology with hierarchical arrangement, which facilitates high adsorption and high desorption at a low temperature. The porous nanorods provide a large surface area with more reactive sites for the target ammonia gas. In addition, the flower-like structure provides channels for gas diffusion as compared to other ZnO morphologies. Hence, the flower-like structure with high porosity and large surface area is significant in shortening the response and recovery times and boosting the sensitivity of ammonia gas sensors.43–47 The hierarchical nanostructure of the nanorods also helps easy transportation of electrons to the surface, which is also responsible for a fast response. In summary, fragmented lignin-mediated ZnO has a hierarchical structure and good ammonia sensing performance. Previously, the ammonia gas sensing property has been studied at different concentrations of ammonia such as 1000 ppm, 200 ppm and 105 ppm at high temperatures with response and recovery times of 180 s and 800 s, as given in Table 3.
Table 2 Response time and recovery time
| |
Average five cycle response time at 175 °C (s) |
Average five cycle recovery time at 175 °C (s) |
| ZnO without fragmented lignin |
57 |
122 |
| ZnO with fragmented lignin |
48 |
24 |
Table 3 Reported data of ZnO nanorods for gas sensing
| Best working temperature |
Concentration |
Response (Rg/Ra) |
Reference |
| 300 °C |
1000 ppm |
80 (ammonia) |
48 |
| 573 °C |
1000 ppm |
80.6 (ammonia) |
49 |
| 250 °C |
200 ppm |
10 (acetone) |
50 |
| 175 °C |
50 ppm |
71.11 (ammonia) |
This work |
| 58.75 (acetone) |
| 56.19 (toluene) |
7. Conclusions
A facile and economical process for fragmentation of lignin has been developed. Bagasse, a low-cost material, is used for the fragmentation process. Without any drastic conditions for the fragmentation reaction, we obtained the fragmented lignin. During fragmentation, five different fragments of lignin were obtained. This fragmented lignin was further used as a stabilizing agent for the synthesis of ZnO nanostructures. In the presence of fragmented lignin, nanorods of ZnO with porous structures were obtained. Furthermore, the nanorods self-assembled and formed a hierarchical nanostructure. Such ZnO exhibited higher gas sensing (NH3) property at 50 ppm than ZnO obtained without fragmented lignin.
Conflicts of interest
There are no conflicts to declare.
Acknowledgements
Dr M. G. Chaskar would like to thank Prof. Ramakrishna More A. S. C College, Akurdi, Pune-44 and STAR-DBT for providing research facilities. We also thank C-MET, Pune.
References
- Y. R. Guo, F. D. Yu, G. Z. Fang and Q. J. Pan, J. Alloys Compd., 2013, 552, 70 CrossRef CAS.
- P. F. H. Harmsen, W. J. J. Huijgen, L. M. B. Lopez and R. R. C. Bakker, Biosynergy Report, 2010, vol. 11 Search PubMed.
- J. Ragauskas, C. K. Williams, B. H. Davison, G. Britovsek, J. Cairney, C. A. Eckert, W. J. Frederick, J. P. Hallett, D. J. Leak, C. L. Liotta, J. R. Mielenz, R. Murphy, R. Templer and T. Tschaplinski, Science, 2006, 311, 487 CrossRef PubMed.
- G. S. Martins, E. A. Vara and J. C. Duarte, Ind. Crops Prod., 2008, 27, 191 Search PubMed.
- A. P. Zhang, C. F. Liu and R. C. Sun, Ind. Crops Prod., 2010, 31, 358 CrossRef.
- S. S. Y. Tan, D. R. M. Farlane, J. Ufal, L. A. Edye and W. O. S. Doherty, Green Chem., 2009, 11, 445 RSC.
- A. F. Patti, J. M. Pringle and J. L. Scott, Green Chem., 2009, 11, 340 Search PubMed.
- X. Zhao, R. Wua and D. Liu, Biomass Bioenergy, 2011, 35, 2875 CrossRef.
- R. Kaurl and S. K. Uppall, Colloid Polym. Sci., 2015, 7, 8 Search PubMed.
- R. C. Sun, J. Agric. Food Chem., 2011, 59, 8692 Search PubMed.
- P. Maziero, M. L. Wu, L. Chuan-Fu, D. O. Net, D. Machado, T. Batist, C. C. S. Cavalheriric, M. G. Neumann, A. F. Craievich, G. J. D. M. Rocha, I. Polikarpov and A. R. Goncalves, Ind. Crops Prod., 2012, 35, 64 CrossRef.
- A. T. Zabaleta, Lignin extraction, purification, and depolymerization study, PhD thesis, 2012, p. 234.
- X. Donga, M. Donga, Y. Lua, A. Turleya, T. Jin and C. Wu, Ind. Crops Prod., 2011, 34, 1630 Search PubMed.
- J. Ragauskas, S. Xie, Q. Sun, Y. Pu and F. Lin, ACS Sustainable Chem. Eng., 2016, 311, 8 Search PubMed.
- B. H. Zeng, G. Duan, Y. Li, S. Yang, X. Xu and W. Cai, Adv. Funct. Mater., 2010, 20, 564 Search PubMed.
- S. D. Springer, J. He, M. Chui, R. D. Little, M. Foston and A. Butler, ACS Sustainable Chem. Eng., 2016, 4(6), 3215 Search PubMed.
- F. Chen, W. Liu, S. Ismail, S. Shahabadi and J. X. X. Lu, ACS Sustainable Chem. Eng., 2016, 419, 5110 Search PubMed.
- S. Xie, Q. Li, P. Karki, F. Zhou and J. S. Yuan, ACS Sustainable Chem. Eng., 2017, 5(4), 2812 Search PubMed.
- E. M. Anderson, R. Katahira, M. Reed, M. G. Resh, E. M. Karp, G. T. Beckham and Y. R. Leshkov, ACS Sustainable Chem. Eng., 2016, 4(12), 6944 Search PubMed.
- Y. Qian, X. Qiu, X. Zhong, D. Zhang, Y. Deng, D. Yang and S. Zhu, Ind. Eng. Chem. Res., 2015, 52(48), 12029 Search PubMed.
- H. Wang, X. Qiu, W. Liu, F. Fu and D. Yang, Ind. Eng. Chem. Res., 2017, 56(39), 11139 Search PubMed.
- Y. Qian, T. Wang, X. Qiu, D. Zhao, D. Liu and Y. Deng, ACS Sustainable Chem. Eng., 2016, 4(12), 7198 Search PubMed.
- T. T. Miaol, D. X. Susl, Y. R. Guo, C. Li, Y. L. Ma, G. Z. Fang and Q. J. Pan, Nanoscale Res. Lett., 2013, 431, 5 Search PubMed.
- T. Senthil and S. Anandhan, J. Colloid Interface Sci., 2014, 432, 285 CrossRef CAS PubMed.
- J. Liu, M. Dai, T. Wang, P. Sun, X. Liang, G. Lu, K. Shimanoe and N. Yamazoe, ACS Appl. Mater. Interfaces, 2016, 8, 669 Search PubMed.
- R. Ramamoorthy, P. K. Dutta and S. A. Akbar, J. Mater. Sci., 2003, 38, 4272 CrossRef.
- K. T. Alali, T. Liu, J. Liu, Q. Liu, Z. Li, H. Zhang, K. Aljebawi and J. Wang, RSC Adv., 2016, 6, 101636 RSC.
- T. A. Nguyen, S. Park, J. B. Kim, T. K. Kim, G. H. Seong, J. Choo and Y. S. Kim, Sens. Actuators, B, 2011, 160, 550 CrossRef.
- A. I. Vogel, A. R. Tatchell, B. S. Furnis, A. J. Hannaford and P. W. G. Smith, Vogel's Textbook of Practical Organic Chemistry, ISBN-81-7758-957-1, 5th edn, p. 1427 Search PubMed.
- M. S. Jahan, Z. Liu, H. Wang, A. Saeed and Y. NI, Cellul. Chem. Technol., 2012, 46, 263 Search PubMed.
- O. Derkacheve and D. Sukhov, Macromol. Symp., 2008, 265, 64 Search PubMed.
- Z. Li and Y. Ge, J. Am. Chem. Soc., 2011, 22, 1868 Search PubMed.
- P. Buone, A. Duval, P. Verge, L. Averous and Y. Habibil, ACS Sustainable Chem. Eng., 2016, 12, 28 Search PubMed.
- E. R. E. V. Hage, M. M. Mulder and J. J. Boon, J. Anal. Appl. Pyrolysis, 1993, 25, 155 Search PubMed.
- O. Faix and C. Grunwald, Holzforschung, 1992, 46, 426 CrossRef.
- M. Tien and K. Kirk, Proc. Natl. Acad. Sci. U.S.A., 1984, 81, 2283 CrossRef.
- A. Richel, C. Vanderghem, M. Simon, B. Wathelet and M. Paquot, Anal. Chem. Insights, 2012, 7, 83 Search PubMed.
- L. Moghaddam, Z. Zhang, R. M. Wellard, J. P. Bartley, L. M. O. Hara and W. O. S. Doherty, Biomass Bioenergy, 2014, 1–15, 10 Search PubMed.
- R. Singh, S. Singh, K. D. Trimukhe, K. V. Pandare, K. B. Bastawade, D. V. Gokhale and A. J. Varma, Carbohydr. Polym., 2005, 62, 60 CrossRef.
- S. Xu and Z. L. Wang, Nano Res., 2011, 4, 1013 CrossRef CAS.
- G. Korotcenkov, Sens. Actuators, B, 2005, 107, 209 CrossRef CAS.
- S. Kannan, L. Rieth and F. Solzbacher, Sens. Actuators, B, 2010, 149, 9 CrossRef.
- S. R. Morrison, in The Chemical Physics, 1977 Search PubMed.
- X. Wang, W. Liu, J. Liu, F. Wang, J. Kong and S. Qiu, et al., ACS Appl. Mater. Interfaces, 2012, 4, 824 Search PubMed.
- E. Fazio, M. Hjiri, R. Dhahri, L. Elmi and G. Sabatino, J. Solid State Chem., 2015, 226, 198 CrossRef.
- M. Poloju, N. Jayababu and M. V. R. Reddy, Mater. Sci. Eng., B, 2018, 227, 65 CrossRef.
- A. Nambi, G. Kriashan, G. K. Mani, P. Shankar, B. Vutukuri and J. B. Balaguru, Chem. Sens., 2015, 5, 9 Search PubMed.
- T. Y. Chen, H.-I. Chen, C.-S. Hsu, C.-C. Hiang, J.-S. Wu, P. C. Chou and W. C. Liu, IEEE Electron Device Lett., 2012, 33, 614 Search PubMed.
- T. Y. Chen, H. I. Chen, C. S. Hsu, C. C. Huang, J. S. Wu, P. C. Chou and W. C. Liu, Sens. Actuators, B, 2015, 221, 491–498 CrossRef CAS.
- X. Wang, X. W. Sun, Y. Yang, H. Huang, Y. C. Lee, O. K. Tan and L. Vayssieres, Nanotechnology, 2006, 17, 4995 CrossRef.
Footnote |
| † Electronic supplementary information (ESI) available. See DOI: 10.1039/c8ra05874a |
|
| This journal is © The Royal Society of Chemistry 2019 |
Click here to see how this site uses Cookies. View our privacy policy here. 
 Open Access Article
 This Open Access Article is licensed under a Creative Commons Attribution-Non Commercial 3.0 Unported Licence
 c,
Yogesh A. Sethic,
Bharat B. Kale
c,
Yogesh A. Sethic,
Bharat B. Kale