 Open Access Article
Investigation on the chirality mechanism of chiral carbon quantum dots derived from tryptophan†
Yingying Weiab,
Lin Chenbc,
Junli Wangbc,
Xuguang Liu *ab,
Yongzhen Yang
 *bc and
Shiping Yubd
aCollege of Materials Science and Engineering, Taiyuan University of Technology, Taiyuan 030024, China. E-mail: Liuxuguang@tyut.edu.cn
bKey Laboratory of Interface Science and Engineering in Advanced Materials, Taiyuan University of Technology, Ministry of Education, Taiyuan 030024, China. E-mail: yyztyut@126.com
cResearch Center of Advanced Materials Science and Technology, Taiyuan University of Technology, Taiyuan 030024, China
dInterventional Treatment Department, Second Hospital of Shanxi Medical University, Taiyuan 030001, China
First published on 25th January 2019
Abstract
Chiral carbon quantum dots (CQDs) with chirality, fluorescence and biocompatibility were synthesized by a one-step method with L-/D-tryptophan (L-/D-Trp), as both carbon source and chiral source. Levogyration-/dextrorotation-CQDs (L-/D-CQDs) were characterized by transmission electron microscopy, Fourier transform infrared spectrometry, ultraviolet-visible absorption, excitation and emission spectrometry and circular dichroism (CD) spectrometry. Results show that L-CQDs and D-CQDs present similar spherical morphology, functional groups and optical properties. The CD signal, around 220, 240 and 290 nm are opposite and symmetric, which conclusively demonstrates that L-CQDs and D-CQDs are enantiomers. Besides the CD signal around 220 nm from the inheritance of L-/D-Trp, two new chiral signals around 240 and 290 nm were induced by chiral environment.
1. Introduction
Chirality is one of the most fascinating and ubiquitous phenomena in nature, not only in amino acids and DNA, but also in supramolecular and nanoscopic structures. It plays a pivotal role in many fields including chemistry, biology, pharmacology and medicine.1 Chirality is also an important factor in the application of chiral recognition,2 chiral detection, asymmetric catalysis and chiral separation. A chiral molecule has two mirror-images which are not superimposable in three dimensions. The two forms of chiral molecules are classified as enantiomers. To date, chirality at the molecular level is well understood. However, the chirality at nanometer scale is still in the initial stage. Therefore, introducing chirality into nanomaterials has become one of the hot spots in current chiral research. Developing new chiral nanoparticles opens up a new avenue for developing nanomaterials, and it is of great interest not only for nanotechnology, but also for other fields including chemistry, biochemistry, pharmacology and medicine.1,3Chiral quantum dots (QDs), as a class of nanomaterials with chiral and fluorescence properties, have been widely concerned by researchers in the field of biology in the past few years. However, their application in biological environment was limited because of the lack of chiral ligands for preparing chiral QDs, and high cost and toxicity. Carbon quantum dots (CQDs), a new class of carbon nanoparticles with size less than 10 nm,4,5 have fluorescence properties similar to QDs, but do not contain toxic metal elements, and have outstanding advantages such as easy functionalization, low cost, very low toxicity and favorable biocompatibility.5–8
Recently, research on chiral CQDs has attracted great attention and achieved some good achievements. The researches on chiral CQDs indicated that levogyration-CQDs (L-CQDs) and dextrorotation-CQDs (D-CQDs) present different biological effects. For instance, L-CQDs show chirality-dependent enhancement in cellular glycolysis, whereas D-CQDs have no similar effect, suggesting that chiral CQDs are selective in energy metabolism of cells;3 D-CQDs are able to enhance photosynthesis better and accumulate more carbohydrate in mung bean plants, which can be potentially used as fertilizer for agricultural applications;9 L-CQDs dramatically remodel amyloid beta-42 (Aβ42) secondary structure and fibril morphologies, as well as inhibit Aβ42 cytotoxicity and membrane interactions.10 In a word, the biological effect is closely related to chiral characteristics of materials, and chiral CQDs especially have promising application in biology.
Up to now, the synthesis of chiral CQDs can be divided into two categories, including one-step and two-step approach. In 2016, Suzuki et al. firstly reported the generation of chirality on graphene quantum dots (GQDs).11 GQDs were synthesized and L-/D-cysteine (L-/D-cys) moieties were subsequently covalent attached to their edges. In two-step approach, CQDs were prepared firstly, and then modified by chiral ligand to obtain chiral CQDs. This process is relatively complicated and the conditions are severe. Nevertheless, in one-step method, chiral CQDs were obtained using carbon source and chiral ligand in a system, and it is a new challenge to synthesize chiral CQDs with simultaneous functionalization, doping or capping with other chiral molecules. Through unremitting efforts, researchers have developed a one-step method to directly prepare chiral CQDs. By taking citric acid as carbon source and L-/D-cys as chiral source,9,12 or L-/D-cys,13 L-/D-lysine10 and other chiral amino acids as raw materials to synthesize chiral CQDs, chiral inheritance or chiral induction from amino acids was realized onto CQDs.14 However, the chirality origin of these chiral CQDs still remains unclear.
In view of this, in order to clarify the chirality mechanism of chiral CQDs prepared by amino acids, chiral CQDs were synthesized by a one-step hydrothermal method using L-/D-tryptophan (L-/D-Trp), a widely available and low-cost natural resource, as both carbon source and chiral source, and the chirality origin in CQD structure was revealed.
2. Experimental
2.1 Raw materials
L-Trp and levogyration-alanine (L-Ala) were provided by Tianjin Guangfu Fine Chemical Research Institute. D-Trp, dextrorotation-alanine (D-Ala) and indole were obtained from Shanghai McLean Biochemical Technology Co. Ltd. NaOH flakes were purchased from Tianjin Mainland Chemical Reagent Factory, which were used without any further purification. Cellulose dialysis bags with 1000 Da molecular mass were purchased from Shanghai Yuanye Biotechnology Co. Ltd.2.2 Synthesis of L-/D-CQDs
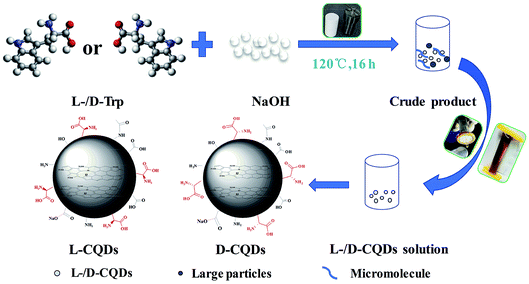
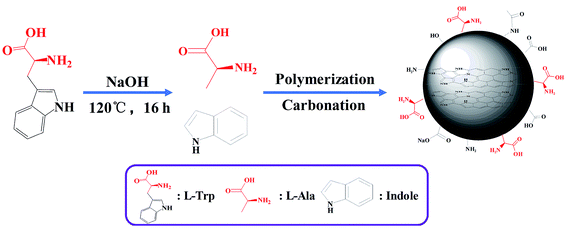
At first, 0.5 g of L-/D-Trp and 0.09 g of NaOH were sufficiently dissolved in 15 mL of water under ultrasonication for 5 min. Then, the above-mentioned solution was transferred to a 100 mL Teflon-sealed autoclave and heated at 120 °C for 16 h. The resultant solution, which was brown and transparent, was filtered to remove larger carbon nanoparticles by syringe filter (pore size: 0.22 μm). After that, purification was conducted through a dialysis bag (molecular weight cut off 1000 Da) for four days to remove unreacted raw materials as well as low molecular weight by-products. The dialysis fluid was dried in freeze dryer to obtain the products. Fig. 1 shows schematic for the synthesis of L-/D-CQDs by one-step hydrothermal method.2.3 Chirality origin analysis
L-/D-Trp can be decomposed into indole and L-/D-Ala under hydrothermal, high pressure and alkaline condition, L-/D-Ala and indole were involved in the reaction. L-/D-Ala creates a chiral environment to induce achiral chromophores distortion. Therefore, in order to further study the chiral origin of L-/D-CQDs, three parallel experiments were designed. Meanwhile, to unify the quality of the raw materials among the contrast experiments, the three groups of raw materials for contrast experiments were: first group (0.28 g of indole), second group (0.22 g of L-/D-Ala) and third group (0.28 g of indole + 0.22 g of L-/D-Ala). The reaction procedures were the same as Section 2.2.2.4 Characterization
Transmission electron microscopy (TEM) and high-resolution TEM images (HRTEM) were taken on a JEOL JEM-2100 microscope with an accelerating voltage of 60 kV. Fourier transform infrared (FT-IR) spectra were recorded in the form of KBr pellets with a BRUKER TENSOR 27 spectrometer. X-ray photoelectron spectroscopy (XPS) measurements were conducted on a Kratos AXIS ULTRA DLD X-ray photoelectron spectrometer with mono X-ray source Al Kα excitation (1486.6 eV). The excitation and emission spectra of L-/D-CQDs aqueous solution were collected on a Horiba Fluoromax-4 luminescence spectrometer using Xe lamp as excitation source. The circular dichroism spectra (CD) and ultraviolet-visible (UV-vis) absorption spectra of samples aqueous solution were obtained on a JASCO J-1500 spectropolarimeter.3. Results and discussion
3.1 Morphology and structure of the L-/D-CQDs
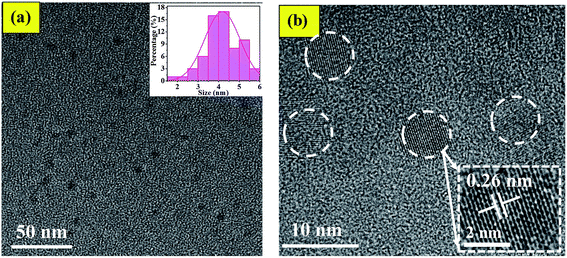
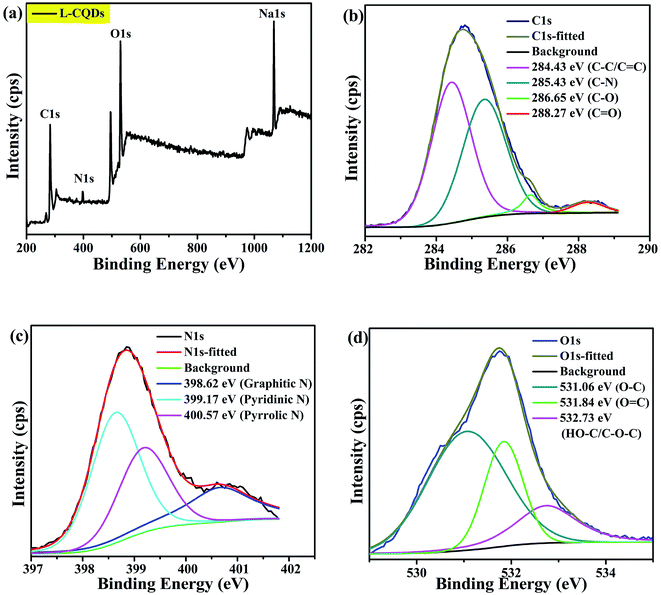
By comparing the characterization results of L-CQDs and D-CQDs, it is found that their morphology and structure are similar. Therefore the text mainly includes the information for L-CQDs, while the TEM and XPS spectra about D-CQDs are shown in the ESI.† As shown in Fig. 2(a), as-prepared L-CQDs are well dispersed spherical nanoparticles morphology with average size of 4.0 nm in diameter. The HRTEM image shows L-CQDs possess lattice spacing of 0.26 nm, which corresponds to the (100) facets of graphite (Fig. 2(b)).15 As for D-CQDs, as shown in Fig. S1,† the size distribution range is similar to that of L-CQDs. The average particle size is about 3.0 nm slightly smaller than that of L-CQDs. As shown in Fig. S1(b),† the D-CQDs particles also have a lattice fringe of 0.26 nm.The chemical structure of the obtained L-CQDs or D-CQDs was probed using XPS. The full-scan XPS spectrum of L-CQDs is depicted in Fig. 3(a), where O1s, C1s, N1s and Na1s peaks demonstrate that L-CQDs are principally composed of carbon, oxygen, nitrogen and sodium, which is consistent with the raw material. NaOH is involved in the reaction and may form sodium carboxylate.16 For L-CQDs, the expanded image of the C1s peak confirms the presence of C–C/C![[double bond, length as m-dash]](https://www.rsc.org/images/entities/char_e001.gif) C (284.43 eV), C–N (sp3, 285.43 eV), C–O (sp3, 286.65 eV), and C
C (284.43 eV), C–N (sp3, 285.43 eV), C–O (sp3, 286.65 eV), and C![[double bond, length as m-dash]](https://www.rsc.org/images/entities/char_e001.gif) O (sp2, 288.27 eV) bonds (Fig. 3(b)).17–19 The N1s spectra present three peaks at 398.62, 399.17 and 400.57 eV, which are related to graphitic N, pyridinic N and pyrrolic N, respectively (Fig. 3(c)).18,20–22 The O1s spectra exhibit three peaks at 531.06, 531.84 and 532.73 eV, which are partly assigned to O–C, O
O (sp2, 288.27 eV) bonds (Fig. 3(b)).17–19 The N1s spectra present three peaks at 398.62, 399.17 and 400.57 eV, which are related to graphitic N, pyridinic N and pyrrolic N, respectively (Fig. 3(c)).18,20–22 The O1s spectra exhibit three peaks at 531.06, 531.84 and 532.73 eV, which are partly assigned to O–C, O![[double bond, length as m-dash]](https://www.rsc.org/images/entities/char_e001.gif) C, and HO–C/C–O–C groups, respectively (Fig. 3(d)).23,24 These results demonstrate that as-prepared L-CQDs contain lots of functional groups on their surface. The chemical compositions of D-CQDs are similar to those of L-CQDs, as shown in Fig. S2.†
C, and HO–C/C–O–C groups, respectively (Fig. 3(d)).23,24 These results demonstrate that as-prepared L-CQDs contain lots of functional groups on their surface. The chemical compositions of D-CQDs are similar to those of L-CQDs, as shown in Fig. S2.†
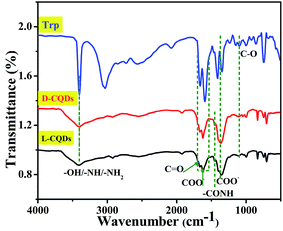
To further analyze the surface functional groups of L-CQDs and D-CQDs, their FT-IR spectra were compared with the raw material L-/D-Trp, as shown in Fig. 4. The broad band at 3402 cm−1 is attributed to –OH/–NH/–NH2 vibration of carboxylic acid and amine groups.25–27 Compared with that for L-/D-Trp, this band becomes wider, which may be induced by the association among hydrogen bonds. A small hump at 1662 cm−1 is assigned to C![[double bond, length as m-dash]](https://www.rsc.org/images/entities/char_e001.gif) O stretching vibrations.6,27 The bands at 1600 cm−1 and 1400 cm−1 correspond to the asymmetric and symmetric stretching vibrations of COO– respectively.6,28 The bands at 1244 cm−1 and 1110 cm−1 represent the stretching of –C
O stretching vibrations.6,27 The bands at 1600 cm−1 and 1400 cm−1 correspond to the asymmetric and symmetric stretching vibrations of COO– respectively.6,28 The bands at 1244 cm−1 and 1110 cm−1 represent the stretching of –C![[double bond, length as m-dash]](https://www.rsc.org/images/entities/char_e001.gif) ONH and C–O, respectively.26,27 The presence of –CONH indicates the dehydration polymerization during the hydrothermal process. These results are in good accordance with XPS data. From the above data, there clearly exist that the oxygen- and nitrogen-containing functional groups on the surface of L-CQDs and D-CQDs.
ONH and C–O, respectively.26,27 The presence of –CONH indicates the dehydration polymerization during the hydrothermal process. These results are in good accordance with XPS data. From the above data, there clearly exist that the oxygen- and nitrogen-containing functional groups on the surface of L-CQDs and D-CQDs.
3.2 Optical properties of L-/D-CQDs
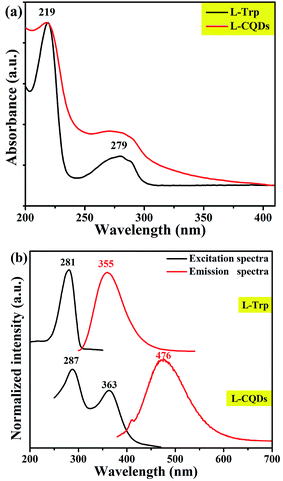
Like most of CQDs, L-/D-CQDs also exhibit fluorescence properties. As shown in Fig. 5(a) and S3, there is no prominent difference in the UV-vis spectra of L-/D-CQDs and precursors. It can be clearly seen from the UV-vis spectra of L-Trp and L-CQDs (Fig. 5) that L-CQDs have two obvious absorption peaks at 219 and 279 nm, similar to raw material L-Trp. The strong absorption peak at 219 nm is attributed to π–π* transition of C![[double bond, length as m-dash]](https://www.rsc.org/images/entities/char_e001.gif) C,29,30 while the weak absorption peak at 279 nm is ascribed to n–π* transition of C
C,29,30 while the weak absorption peak at 279 nm is ascribed to n–π* transition of C![[double bond, length as m-dash]](https://www.rsc.org/images/entities/char_e001.gif) O,30,31 and the latter part of absorption can generate fluorescence.5
O,30,31 and the latter part of absorption can generate fluorescence.5
The excitation and emission spectra of L-CQDs and D-CQDs are shown in Fig. 5(b) and S3(b), respectively. Compared with L-Trp, L-CQDs have two excitation peaks, which are located at 287 and 363 nm, and the maximum emission peak red-shifts from 355 to 476 nm. Likewise, compared with D-Trp, D-CQDs have two excitation peaks, which are located at 290 and 363 nm, and the maximum emission peak red-shifts from 361 to 476 nm (Fig. S3(b)†).
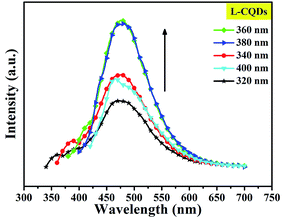
To further study the optical properties of L- or D-CQDs, a series of emission spectra were obtained with different excitation wavelengths ranging from 320 to 400 nm with the increments of 20 nm, as shown in Fig. 6 and S4. With the increase of excitation wavelength, the intensity of emission peak first increases and then decreases. And when the excitation wavelength is 360 nm, the emission intensity reaches the maximum value, while the peak position of emission hardly changes, indicating L-CQDs exhibit excitation-independent nature, possibly resulting from a distribution of the same or similar emissive sites.18 The result of D-CQDs is consistent with that of L-CQDs, as shown in Fig. S4.†
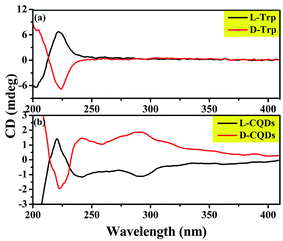
The above analysis indicates that the product prepared by L-/D-Trp through hydrothermal reaction is zero-dimensional carbon nanoparticles with the size of less than 10 nm and has fluorescence characteristics, that is, CQDs. More importantly, the chirality of the synthesized CQDs needs to be determined. Therefore, the chirality of the synthesized CQDs was analyzed by CD spectra. As shown in Fig. 7(a) and (b), CD spectra of L-/D-Trp and L-/D-CQDs show that the CD signals of L-Trp and D-Trp are symmetrical near 220 nm, while the CD signals of L-CQDs and D-CQDs are symmetrical near 220, 240 and 290 nm, and both CQDs and Trp exhibit enantiomeric isomerism, which proves that L-CQDs and D-CQDs are enantiomers.12 Obviously, the CD signal near 220 nm is generated by the intrinsic chiral chromophore, which inherits the chirality of L-/D-Trp.12,13 The CD signals near 240 and 290 nm are generated by the influence of chiral environment,32 in which the CD signal near 240 nm is derived from the π–π* conjugation of the sp2-hybridized carbon network in L-/D-CQDs,13,33 while the CD signal near 290 nm is attributed to π–π* transition between indole.34
3.3 Synthetic mechanism of L-/D-CQDs
Generally, the synthesis process of CQDs by hydrothermal method mainly includes dehydration, polymerization and carbonization.35 Therefore, the synthesis of L-/D-CQDs goes through these processes. Indole and L-/D-Ala are produced because L-/D-Trp is decomposed with water under hydrothermal, high pressure and alkaline condition. From above HRTEM, XPS and FT-IR characterizations, it can be seen that CQDs contain sp2-hybridized aromatic ring structure in their core and oxygen- and nitrogen-containing functional groups on their surface. Therefore, it is inferred that the produced indoles are mainly involved in the formation of carbon core. L-/D-Ala is undergone intramolecular or intermolecular dehydration and polymerization, and then carbonized to form CQDs. Fig. 8 depicts the synthesis mechanism of L-CQDs, and the similar mechanism for D-CQDs is given in Fig. S5.† The synthesis mechanism is discussed in detail in following parts.In this work, chiral CQDs were prepared by one-step hydrothermal method with chiral L-/D-Trp and non-chiral reagent water as feedstock. Compared with current synthesis method of chiral CQDs, it is simple because no further surface functionalization is needed. Moreover, the chirality of CQDs is mainly generated from chiral L-/D-Trp, and retained at the quantum level. L-CQDs were synthesized from L-Trp and D-CQDs from D-Trp.36 This process can be called asymmetric synthesis process, which is also known as chiral synthesis. According to the CD spectra of L-/D-CQDs, they present two additional CD signals near 240 and 290 nm compared with L-/D-Trp. The previous research of chiral CQDs has revealed that apart from preservation of chirality from Trp, chirality can also be induced by chiral environment for the distortion of achiral chromophores.32 Therefore, it is assumed that CD signals around 240 and 290 nm are induced by chiral environment.
In order to verify this assumption and the deposition of L-/D-Trp under hydrothermal conditions, this work designed three parallel experiments were designed, as described in Section 2.3. UV-vis and CD spectra of the products were measured, as shown in Fig. 9. By comparison, it is found that the three products have a weak absorption peak at relatively long wavelengths. When indole is used as feedstock, a strong absorption peak appears at a relatively short wavelength, which is similar to the UV-vis spectra of L-/D-CQDs (Fig. S3†), indicating that indole does participate in the reaction.
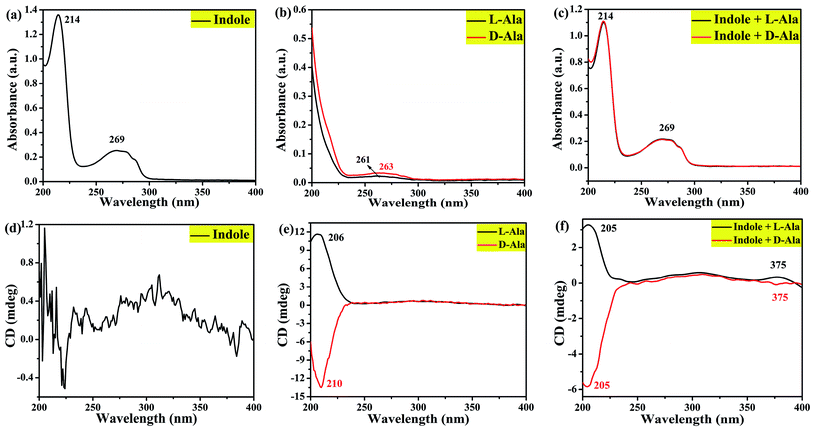 | ||
| Fig. 9 UV-vis absorption ((a), (b) and (c)) and circular dichroism spectra ((d), (e) and (f)) of the hydrothermal products from reactants indole, L-/D-Ala, and indole + L-/D-Ala, respectively. | ||
Fig. 9(d–f) are CD spectra of three groups of products. As confirmed by Fig. 9(d), when only indole takes part in reaction, the product has no chirality because the raw material itself has no chirality. However, as shown in Fig. 9(e), when only L-/D-Ala is reactant, a chiral environment is created on the product. A comparison between Fig. 9(e) and (f) indicates that, in addition to the chirality (around 205 nm) of the product from L-/D-Ala, another chiral signal at 375 nm appears, obviously as a result of the distortion of achiral chromophores and the generation of chirality in a chiral environment.32 Because the products are prepared by L-/D-Ala and indole, which is different from the synthesis of L-/D-CQDs by L-/D-Trp, a new chiral signal is deviated from 290 to 375 nm (Fig. 7). At the same time, the induction effect of chiral environment is further explained, that is in the synthesis process of L-/D-CQDs, CD signal near 290 nm is induced by chiral environment.34
4. Conclusion
Chiral CQDs with fluorescence property were obtained by one-step hydrothermal method and their chirality mechanism was discussed. L-CQDs and D-CQDs exhibit similar morphology, structure and optical properties. Results show that the size distribution of L-/D-CQDs around is 1.0–6.0 nm. Their aqueous solution emits blue-green light under UV illumination at 365 nm and exhibits excitation-independent photoluminescence. The CD signals of L-CQDs and D-CQDs are symmetrical and opposite near 220, 240 and 290 nm, which proves that L-CQDs and D-CQDs are enantiomers. Obviously, L-/D-CQDs not only inherits the chirality of raw material L-/D-Trp on the surface of CQDs, but also adds two CD signals near 240 and 290 nm. The CD signal near 240 nm is derived from the π–π* conjugation of the sp2-hybridized carbon network in L-/D-CQDs, while the CD signal near 290 nm is attributed to π–π* transition between indole. The chiral origin of chiral CQDs is understood, which not only guides the preparation of chiral CQDs, but also predicts the chiral site in CQDs. The resultant chiral CQDs may find application in chiral recognition, chiral detection and other fields.Conflicts of interest
There are no conflicts to declare.Acknowledgements
This work was supported by the National Key Research and Development Program of China (2017YFB0603104), the National Natural Science Foundation of China (51803148, U1710117, U1610255, U1607120), the Shanxi Provincial Key Research and Development Program (201703D321015-1), the Shanxi Provincial Key Innovative Research Team in Science and Technology (201605D131045-10) and the Shanxi Provincial Postgraduate Education Innovation Project (2018SY016).References
- F. P. Milton, J. Govan, M. V. Mukhina and Y. K. Gun'ko, Nanoscale Horiz., 2016, 1, 14–26 RSC.
- M. P. Moloney, Y. K. Gun'ko and J. M. Kelly, Chem. Commun., 2007, 3900–3902 RSC.
- F. Li, Y. Y. Li, X. Yang, X. X. Han, Y. Jiao, T. T. Wei, D. Y. Yang, H. P. Xu and G. J. Nie, Angew. Chem., 2018, 57, 2377–2382 CrossRef CAS PubMed.
- Y. B. Song, S. J. Zhu, S. T. Zhang, Y. Fu, L. Wang, X. H. Zhao and B. Yang, J. Mater. Chem. C, 2015, 3, 5976–5984 RSC.
- R. Z. Zhang and W. Chen, Biosens. Bioelectron., 2014, 55, 83–90 CrossRef CAS PubMed.
- Y. X. Hou, Q. J. Lu, J. H. Deng, H. T. Li and Y. Y. Zhang, Anal. Chim. Acta, 2015, 866, 69–74 CrossRef CAS PubMed.
- Q. Q. Fang, Y. Q. Dong, Y. M. Chen, C. H. Lu, Y. W. Chi, H. H. Yang and T. Yu, Carbon, 2017, 118, 319–326 CrossRef CAS.
- Z. Tian, X. T. Zhang, D. Li, D. Zhou, P. T. Jing, D. Z. Shen, S. N. Qu, R. Zboril and A. L. Rogach, Adv. Opt. Mater., 2017, 5, 1700416 CrossRef.
- M. L. Zhang, L. L. Hu, H. B. Wang, Y. X. Song, Y. Liu, H. Li, M. W. Shao, H. Huang and Z. H. Kang, Nanoscale, 2018, 10, 12734–12742 RSC.
- R. Malishev, E. Arad, S. K. Bhunia, S. Shaham-Niv, S. Kolusheva, E. Gazit and R. Jelinek, Chem. Commun., 2018, 54, 7762–7765 RSC.
- N. Suzuki, Y. Wang, P. Elvati, Z. B. Qu, K. Kim, S. Jiang, E. Baumeister, J. Lee, B. Yeom, J. H. Bahng, J. Lee, A. Violi and N. A. Kotov, ACS Nano, 2016, 10, 1744–1755 CrossRef CAS PubMed.
- Y. L. Zhang, L. L. Hu, Y. Sun, C. Zhu, R. S. Li, N. Y. Liu, H. Huang, Y. Liu, C. Z. Huang and Z. H. Kang, RSC Adv., 2016, 6, 59956–59960 RSC.
- L. L. Hu, Y. Sun, Y. J. Zhou, L. Bai, Y. L. Zhang, M. M. Han, H. Huang, Y. Liu and Z. H. Kang, Inorg. Chem. Front., 2017, 4, 946–953 RSC.
- W. Ma, L. G. Xu, A. F. de Moura, X. L. Wu, H. Kuang, C. L. Xu and N. A. Kotov, Chem. Rev., 2017, 117, 8041–8093 CrossRef CAS PubMed.
- Y. F. Ding, J. X. Zheng, J. L. Wang, Y. Z. Yang and X. G. Liu, J. Mater. Chem. C 10.1039/C8TC04887H.
- D. Qu, M. Zheng, L. G. Zhang, H. F. Zhao, Z. G. Xie, X. B. Jing, R. E. Haddad, H. Y. Fan and Z. C. Sun, Sci. Rep., 2014, 4, 5294 CrossRef CAS PubMed.
- M. Xu, S. Xu, Z. Yang, M. Shu, G. He, D. Huang, L. Zhang, L. Li, D. Cui and Y. Zhang, Nanoscale, 2015, 7, 15915 RSC.
- Y. Q. Dong, H. C. Pang, H. B. Yang, C. X. Guo, J. W. Shao, Y. W. Chi, C. M. Li and T. Yu, Angew. Chem., 2013, 52, 7800–7804 CrossRef CAS PubMed.
- J. L. Wang, F. Zhang, Y. L. Wang, Y. Z. Yang and X. G. Liu, Carbon, 2018, 126, 426–436 CrossRef CAS.
- S. Y. Lu, X. H. Zhao, S. J. Zhu, Y. B. Song and B. Yang, Nanoscale, 2014, 6, 13939–13944 RSC.
- Q. Wang, C. L. Zhang, G. X. Shen, H. Y. Liu, H. L. Fu and D. X. Cui, J. Nanobiotechnol., 2014, 12, 58 CrossRef PubMed.
- L. B. Tang, R. B. Ji, X. M. Li, G. X. Bai, C. P. Liu, J. H. Hao, J. Y. Lin, H. X. Jiang, K. S. Teng, Z. B. Yang and S. P. Lau, ACS Nano, 2014, 8, 6312–6320 CrossRef CAS PubMed.
- Y. Xu, M. Wu, Y. Liu, X. Z. Feng, X. B. Yin, X. W. He and Y. K. Zhang, Chemistry, 2013, 19, 2276–2283 CrossRef CAS PubMed.
- F. Zhang, X. T. Feng, Y. Zhang, L. P. Yan, Y. Z. Yang and X. G. Liu, Nanoscale, 2016, 8, 8618–8632 RSC.
- N. Dhenadhayalan, K. C. Lin, R. Suresh and P. Ramamurthy, J. Phys. Chem. C, 2016, 120, 1252–1261 CrossRef CAS.
- X. Cui, L. Zhu, J. Wu, Y. Hou, P. Y. Wang, Z. N. Wang and M. Yang, Biosens. Bioelectron., 2015, 63, 506–512 CrossRef CAS PubMed.
- H. B. Xu, S. H. Zhou, L. L. Xiao, H. H. Wang, S. Z. Li and Q. H. Yuan, J. Mater. Chem. C, 2015, 3, 291–297 RSC.
- W. B. Lu, X. Y. Qin, S. Liu, G. H. Chang, Y. W. Zhang, Y. L. Luo, A. M. Asiri, A. O. Al-Youbi and X. P. Sun, Anal. Chem., 2012, 84, 5351–5357 CrossRef CAS PubMed.
- M. Hassan, E. Haque, K. R. Reddy, A. I. Minett, J. Chen and V. G. Gomes, Nanoscale, 2014, 6, 11988–11994 RSC.
- X. T. Zheng, A. Ananthanarayanan, K. Q. Luo and P. Chen, Small, 2015, 11, 1620–1636 CrossRef CAS PubMed.
- C. M. Luk, L. B. Tang, W. F. Zhang, S. F. Yu, K. S. Teng and S. P. Lau, J. Mater. Chem., 2012, 22, 22378 RSC.
- D. Tedesco and C. Bertucci, J. Pharm. Biomed. Anal., 2015, 113, 34–42 CrossRef CAS PubMed.
- Q. Xin, Q. Liu, L. L. Geng, Q. J. Fang and J. R. Gong, Adv. Healthcare Mater., 2017, 6, 1601011 CrossRef PubMed.
- S. M. Kelly and N. C. Price, Curr. Protein Pept. Sci., 2000, 1, 349–384 CrossRef CAS PubMed.
- J. Hou, W. Wang, T. Y. Zhou, B. Wang, H. Y. Li and L. Ding, Nanoscale, 2016, 8, 11185–11193 RSC.
- M. J. Deka and D. Chowdhury, RSC Adv., 2017, 7, 53057–53063 RSC.
Footnote |
| † Electronic supplementary information (ESI) available. See DOI: 10.1039/c8ra09649j |
| This journal is © The Royal Society of Chemistry 2019 |

