 Open Access Article
Synergetic effect over flame-made manganese doped CuO–CeO2 nanocatalyst for enhanced CO oxidation performance†
Feng Zhao ab,
Shuangde Li
 a,
Xiaofeng Wua,
Renliang Yuea,
Weiman Liab and
Yunfa Chen*ac
aState Key Laboratory of Multi-phase Complex Systems, Institute of Process Engineering, Chinese Academy of Sciences, Beijing 100190, P. R. China. E-mail: chenyf@ipe.ac.cn
bUniversity of Chinese Academy of Sciences, Beijing 100049, P. R. China
cCenter for Excellence in Regional Atmospheric Environment, Institute of Urban Environment, Chinese Academy of Sciences, Xiamen 361021, P. R. China
First published on 18th January 2019
Abstract
CuO–CeO2 nanocatalysts with different amounts of Mn dopping (Mn/Cu molar ratios of 0.5![[thin space (1/6-em)]](https://www.rsc.org/images/entities/char_2009.gif) :
:![[thin space (1/6-em)]](https://www.rsc.org/images/entities/char_2009.gif) 5, 1
5, 1![[thin space (1/6-em)]](https://www.rsc.org/images/entities/char_2009.gif) :
:![[thin space (1/6-em)]](https://www.rsc.org/images/entities/char_2009.gif) 5 and 1.5
5 and 1.5![[thin space (1/6-em)]](https://www.rsc.org/images/entities/char_2009.gif) :
:![[thin space (1/6-em)]](https://www.rsc.org/images/entities/char_2009.gif) 5) were synthesized by flame spray pyrolysis (FSP) method and tested in the catalytic oxidation of CO. The physicochemical properties of the synthesised samples were characterized systematically, including using X-ray diffraction (XRD), Raman spectroscopy, field-emission scanning electron microscopy (FESEM), Brunauer–Emmett–Teller (BET), X-ray photoelectron spectroscopy (XPS), oxygen-temperature programmed desorption (O2-TPD), hydrogen-temperature programmed reduction (H2-TPR) and in situ diffuse reflectance infrared Fourier transform spectroscopy (in situ DRIFTS). The results showed that the 1Mn–Cu–Ce sample (Mn/Cu molar ratio of 1
5) were synthesized by flame spray pyrolysis (FSP) method and tested in the catalytic oxidation of CO. The physicochemical properties of the synthesised samples were characterized systematically, including using X-ray diffraction (XRD), Raman spectroscopy, field-emission scanning electron microscopy (FESEM), Brunauer–Emmett–Teller (BET), X-ray photoelectron spectroscopy (XPS), oxygen-temperature programmed desorption (O2-TPD), hydrogen-temperature programmed reduction (H2-TPR) and in situ diffuse reflectance infrared Fourier transform spectroscopy (in situ DRIFTS). The results showed that the 1Mn–Cu–Ce sample (Mn/Cu molar ratio of 1![[thin space (1/6-em)]](https://www.rsc.org/images/entities/char_2009.gif) :
:![[thin space (1/6-em)]](https://www.rsc.org/images/entities/char_2009.gif) 5) exhibited superior catalytic activity for CO oxidation, with the temperature of 90% CO oxidation at 131 °C at a high space velocity (SV = 60
5) exhibited superior catalytic activity for CO oxidation, with the temperature of 90% CO oxidation at 131 °C at a high space velocity (SV = 60![[thin space (1/6-em)]](https://www.rsc.org/images/entities/char_2009.gif) 000 mL g−1 h−1), which was 56 °C lower than that of the Cu–Ce sample. In addition, the 1Mn–Cu–Ce sample displays excellent stability with prolonged time on CO stream and the resistance to water vapor. The significantly enhanced activity was correlated with strong synergetic effect, leading to fine textual properties, abundant chemically adsorbed oxygen and high lattice oxygen mobility, which further induced more Cu+ species and less formation of carbon intermediates during the CO oxidation process detected by in situ DRIFTS analysis. This work will provide in-depth understanding of the synergetic effect on CO oxidation performances over Mn doped CuO–CeO2 composite catalysts through FSP method.
000 mL g−1 h−1), which was 56 °C lower than that of the Cu–Ce sample. In addition, the 1Mn–Cu–Ce sample displays excellent stability with prolonged time on CO stream and the resistance to water vapor. The significantly enhanced activity was correlated with strong synergetic effect, leading to fine textual properties, abundant chemically adsorbed oxygen and high lattice oxygen mobility, which further induced more Cu+ species and less formation of carbon intermediates during the CO oxidation process detected by in situ DRIFTS analysis. This work will provide in-depth understanding of the synergetic effect on CO oxidation performances over Mn doped CuO–CeO2 composite catalysts through FSP method.
1. Introduction
The increasing stringent environmental regulations demand the elimination of CO from automobiles. CeO2 based oxides are extensively used as the support materials for current automotive three way catalysts due to their outstanding redox ability and oxygen storage/release capacity.1 Recently, much attention has been given to the study of composite non-noble metal catalysts due to their low price and easily tunable activities, which are considered to be potential candidates for substituting noble metals.2,3 Particularly, CuO/CeO2 systems were widely studied and became promising and effective for CO oxidation.4,5 The CO oxidation reaction mechanism starts with CO chemisorption at the CuO–CeO2 interface and formation of Cu+–CO carbonyls. It has been proposed that chemisorbed CO is oxidized to CO2 following a Mars van Krevelen mechanism. The adsorbed CO reacts with lattice oxygen to form the carbon intermediates (e.g. bidentate carbonate, unidentate carbonate and inorganic carboxylate). Consequent desorption of the reaction intermediates generates CO2 and oxygen vacancies. Finally, the gas phase oxygen is activated on the CeO2 surface to replenish the oxygen vacancies.6 The Cu+–CO carbonyls is related to the CO oxidation rate, and desorption of the carbon intermediates over CuO/CeO2 catalysts is the slowest step for CO oxidation below a threshold temperature.7 Moreover, the accumulation of carbon intermediates on CuO/CeO2 catalysts blocks active sites, hinders oxygen activation and transport to decrease the catalytic activity.8 The synergistic effect of CuO on CeO2 is believed to determinate the enhanced catalytic activity in CO oxidation reactions, which is associated with electron transfer between the coupled redox cycles Cu+/Cu2+ and Ce3+/Ce4+,2 the increased number of oxygen vacancies and the higher reducibility at the nanointerface sites of CuOx–CeO2.9In order to further increase the catalytic performance of CuO–CeO2 system for CO oxidation, comparing with mono-dopant of copper, codoping transition metals into CeO2 framework were considered as an effective way.10,11 Among the frequently investigated transition metals, manganese was of particular interest. The addition of Mn to the CeO2 lattice significantly improved the surface area, and increased the concentration of structural oxygen vacancies as well as the reducibility of the redox pair Ce4+/Ce3+.6,11 Li et al.12 reported that dopping of Mn into CuO–CeO2 catalyst was favor in the formation of more solid solution with larger surface area and the enhanced redox properties of the catalysts, which improved the selective oxidation of CO in hydrogen-rich streams. Guo et al.13 found CuO–MnO2 supported in CeO2 synthesized by the co-impregnation method exhibited excellent CO oxidation performance amongst Al2O3, CeO2, TiO2 and Y2O3, due to the strong synergistic effects of active component and ceria support. Guo et al.14 reported CuO–CeO2 catalysts with Mn dopping by hydrothermal method, the catalyst calcined at 500 °C displayed the highest catalytic activity with the enhanced the interaction between CuOx/MnOx species and CeO2 for selective oxidation of CO in hydrogen-rich gas. As mentioned above, recent researches mainly payed attention to the correction of physicochemical properties of doped CeO2 catalysts with their activity. However, there were rarely literatures reported for the influence of Mn dopped CuO–CeO2 catalysts on the intermediates of the CO oxidation reaction, especially on the modifications of the carbon intermediates with adverse effect for the CO catalytic oxidation on CuO–CeO2 catalysts system.
Furthermore, it is well known that the creations of solid solution, the display of synergistic interaction, Cu+ species and oxygen vacancies, which enhanced the catalytic activity of CuO/CeO2 and related mixed oxides, were strongly subject to the preparation methods. For example, MnOx–CuO–CeO2 catalysts prepared with the hydrothermal method had higher activity than those synthesized with co-precipitation, impregnation and sol–gel methods, which was attributed to the stronger synergistic interaction between active components and ceria, the existence of a large number of Cu+ species and Mn4+ species as well as oxygen vacancies.15 Flame spray pyrolysis (FSP) was a single-step gas phase synthesis method which was suitable for preparing composite metal oxides. In the flame, metal precursors experienced high temperature, oxygen-rich environment and rapid quench, which were favor of resulting in strong interaction among metal oxides and maintenance of vacancies and metastable structure.16,17
Consequently, the present work has been undertaken for the above background. Mn was chosen to modify structural, surface and redox properties of CuO–CeO2 catalyst via FSP method to enhance the CO oxidation activity. The nanocatalysts were characterized by XRD, Raman, BET, FESEM, XPS, O2-TPD and H2-TPR analysis methods to investigate the influences of the synergetic effect among various oxides on the catalytic performance. Moreover, the modifications of the Mn doped CuO/CeO2 catalyst for the intermediates of the CO catalytic oxidation were revealed by in situ DRIFTS.
2. Experiment
2.1 Catalysts preparation
A flame spray pyrolysis reactor18 was used to prepare Mn–Cu–Ce oxides nanoparticles with different Mn![[thin space (1/6-em)]](https://www.rsc.org/images/entities/char_2009.gif) :
:![[thin space (1/6-em)]](https://www.rsc.org/images/entities/char_2009.gif) Cu molar ratios (0
Cu molar ratios (0![[thin space (1/6-em)]](https://www.rsc.org/images/entities/char_2009.gif) :
:![[thin space (1/6-em)]](https://www.rsc.org/images/entities/char_2009.gif) 5, 0.5
5, 0.5![[thin space (1/6-em)]](https://www.rsc.org/images/entities/char_2009.gif) :
:![[thin space (1/6-em)]](https://www.rsc.org/images/entities/char_2009.gif) 5, 1
5, 1![[thin space (1/6-em)]](https://www.rsc.org/images/entities/char_2009.gif) :
:![[thin space (1/6-em)]](https://www.rsc.org/images/entities/char_2009.gif) 5 and 1.5
5 and 1.5![[thin space (1/6-em)]](https://www.rsc.org/images/entities/char_2009.gif) :
:![[thin space (1/6-em)]](https://www.rsc.org/images/entities/char_2009.gif) 5). Precursor solutions were prepared by mixing manganese acetate (Mn(CH3COO)2, Fuchen, >99%), cupric acetate anhydrous (Cu(CH3COO)2, Aladdin, >98%) and cerium acetate (Ce(CH3COO)3·xH2O, Mackin, 99.9%) into 200 mL propionic acid (C3H6O2, Sinopharm, 99.9%). The cerium concentration was kept constant at 0.2 M. The nominal weight loading of CuO was fixed at 15 wt% to CeO2. During the FSP progress, a syringe pump conveyed 5 mL min−1 liquid into the flame, where it was atomized by 3L min−1 dispersion oxygen to generate spray droplets. The sprayed precursor was ignited by a premixed supporting flame with a CH4 influx rate of 1.5 L min−1 and O2 influx rate of 3 L min−1. The produced powders were collected on a glass fiber filter with the aid of a vacuum pump. The catalysts with different Mn
5). Precursor solutions were prepared by mixing manganese acetate (Mn(CH3COO)2, Fuchen, >99%), cupric acetate anhydrous (Cu(CH3COO)2, Aladdin, >98%) and cerium acetate (Ce(CH3COO)3·xH2O, Mackin, 99.9%) into 200 mL propionic acid (C3H6O2, Sinopharm, 99.9%). The cerium concentration was kept constant at 0.2 M. The nominal weight loading of CuO was fixed at 15 wt% to CeO2. During the FSP progress, a syringe pump conveyed 5 mL min−1 liquid into the flame, where it was atomized by 3L min−1 dispersion oxygen to generate spray droplets. The sprayed precursor was ignited by a premixed supporting flame with a CH4 influx rate of 1.5 L min−1 and O2 influx rate of 3 L min−1. The produced powders were collected on a glass fiber filter with the aid of a vacuum pump. The catalysts with different Mn![[thin space (1/6-em)]](https://www.rsc.org/images/entities/char_2009.gif) :
:![[thin space (1/6-em)]](https://www.rsc.org/images/entities/char_2009.gif) Cu molar ratios (0
Cu molar ratios (0![[thin space (1/6-em)]](https://www.rsc.org/images/entities/char_2009.gif) :
:![[thin space (1/6-em)]](https://www.rsc.org/images/entities/char_2009.gif) 5, 0.5
5, 0.5![[thin space (1/6-em)]](https://www.rsc.org/images/entities/char_2009.gif) :
:![[thin space (1/6-em)]](https://www.rsc.org/images/entities/char_2009.gif) 5, 1
5, 1![[thin space (1/6-em)]](https://www.rsc.org/images/entities/char_2009.gif) :
:![[thin space (1/6-em)]](https://www.rsc.org/images/entities/char_2009.gif) 5 and 1.5
5 and 1.5![[thin space (1/6-em)]](https://www.rsc.org/images/entities/char_2009.gif) :
:![[thin space (1/6-em)]](https://www.rsc.org/images/entities/char_2009.gif) 5) were labelled as Cu–Ce, 0.5Mn–Cu–Ce, 1Mn–Cu–Ce and 1.5Mn–Cu–Ce, respectively.
5) were labelled as Cu–Ce, 0.5Mn–Cu–Ce, 1Mn–Cu–Ce and 1.5Mn–Cu–Ce, respectively.
2.2 Catalysts characterization
XRD patterns were obtained with a PANalytical X'pert Pro diffraction with Cu Kα (40 kV, 40 mA) (2θ range = 10–90°; scan rate = 0.0333° s−1). The Raman spectra were performed on a Renishaw RM2000 Raman Spectrometer with the 532 nm line of an argon ion laser (objective 50×; acquisitions 10) scanned in the range 200–800 cm−1. The specific surface area, the pore volume and the pore size distribution of the samples were determined by N2 physisorption at −196 °C measured on a Quantachrome Autosorb instrument. The powders (ca. 100 mg) were previously outgassed at 150 °C for 5 h to remove humidity. The morphologies of the samples were recorded using FESEM on a JOEL (JSM-7001F) instrument. XPS experiments were carried out on an XLESCALAB 250Xi electron spectrometer from VG Scientific with monochromatic Al Kα radiation. The binding energies were referenced to the C 1s line at 284.8 eV from adventitious carbon. O2-TPD and H2-TPR were performed on a Chemisorb 2920 pulse chemisorption system, using a thermal conductivity detector (TCD) (Micromeritics) to record the effluent gas. Prior to O2-TPD, the samples (50 mg) were treated with 50 mL min−1 of 5% O2/He held at 500 °C for 1 h. The samples were then cooled down to room temperature under the same atmosphere, and subsequently flushed by He for 40 min to remove the physisorbed molecules. TPD was conducted by flowing 50 ml min−1 of He with temperature ramping at 10 °C min−1. In H2-TPR measurement, 50 mg of the sample was ramped from ambient temperature to 700 °C at the rate of 10 °C min−1 under a gas mixture of 10 vol% H2 in Ar at a flow rate of 30 mL min−1. In situ DRIFTS was measured at a spectral resolution of 4 cm−1 (number of scans = 32) on a Fourier transform infrared spectrometer (Bruker, Vertex 70) equipped with an MCT detector and a reaction cell (PIKE). 20 mg KBr power was placed under proper amount of samples, and a special made steel stick was used to smash the sample to a flat surface. The sample was pretreated at 300 °C in a flowing N2 (70 mL min−1) for 30 min to remove contaminants from the catalyst surface. After being allowed to cool to room temperature, the background spectrum was collected. The samples was subjected to the stream of 1.0% CO, 0.6% O2, balanced with N2 at a rate of 70 mL min−1, which was the same as the CO reaction atmosphere.2.3 Catalytic performance evaluation
The catalytic performances of the synthesized catalysts for CO oxidation were evaluated, involving a gas mixture consisting of 1 vol% CO, 0.6 vol% O2, and N2 balance. Each sample (70 mg) was sieved with a 40–60 mesh, mixed with 140 mg of quartz sand, and loaded in the quartz reactor (i.d., 10 mm) with quartz wool packed at both ends of the catalyst bed. The total flow rate was 70 mL min−1, corresponding to a weight hourly space velocity (WHSV) at 60![[thin space (1/6-em)]](https://www.rsc.org/images/entities/char_2009.gif) 000 mL g−1 h−1. The reaction was stabilized for 60 min at each temperature, and the effluent gases were tested with on-line gas chromatography (Shimadzu GC-2014) equipped with a flame ionization detector (FID).
000 mL g−1 h−1. The reaction was stabilized for 60 min at each temperature, and the effluent gases were tested with on-line gas chromatography (Shimadzu GC-2014) equipped with a flame ionization detector (FID).
The CO conversion (WCO) and the yield of CO2 (ηCO2) were determined using the equation:
CCO, in (ppm), CCO, out (ppm) and CCO2, out (ppm) were the concentrations of CO in the inlet and outlet gas, and CO2 in the outlet gas, respectively.
3. Results and discussion
3.1 Catalyst characterization
Quantification of surface segregation of different elements were implemented. Table 1 shows the surface values of Mn/Cu/Ce of the prepared samples. After introductions of Mn, both the actual surface Mn/Ce (0.58–1.01) and Cu/Ce (1.07–1.49) ratios of the samples measured by XPS are 10–12 and 3–5 times larger than the theoretical ratios (Mn/Ce = 0.03–0.10 and Cu/Ce = 0.33) respectively, which demonstrates the enrichment of Mn and Cu on the surface of CeO2. Meanwhile, we can not exclude that Mn or Cu ions likely further entrance into the CeO2 lattice after incorporation of Mn.| Sample | Mn/Cu/Ce (molar ratio) | Crystal sizea (nm) | Lattice parameter (nm) | Surface area (m2 g−1) | Pore volume (cm3 g−1) | Pore size (nm) | CO oxidation | ||||
|---|---|---|---|---|---|---|---|---|---|---|---|
| Nominal | XPS | rb (mmol m−2 h−1) | T10 (°C) | T50 (°C) | T90 (°C) | ||||||
| a Calculated applying the Scherrer formula.b Specific reaction rate of CO oxidation at 100 °C. | |||||||||||
| Cu–Ce | 0/0.33/1 | 0/1.04/1 | 27.3 | 0.5406 | 39.4 | 0.15 | 11.50 | 28.04 | 75 | 108 | 187 |
| 0.5Mn–Cu–Ce | 0.03/0.33/1 | 0.58/1.07/1 | 29.2 | 0.5410 | 35.4 | 0.16 | 11.34 | 0.52 | 132 | 149 | 159 |
| 1Mn–Cu–Ce | 0.07/0.33/1 | 0.84/1.49/1 | 30.7 | 0.5411 | 44.7 | 0.20 | 10.74 | 36.41 | 66 | 93 | 131 |
| 1.5Mn–Cu–Ce | 0.10/0.33/1 | 1.01/1.43/1 | 36.8 | 0.5404 | 31.3 | 0.16 | 12.88 | 17.78 | 86 | 123 | 171 |
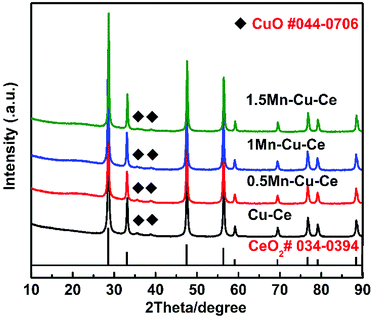
XRD patterns of the prepared samples are exhibited in Fig. 1. All diffractograms show the typical characteristic peaks of fluorite structure of ceria (JCPDS 034-0394), and also, tiny peaks of CuO (JCPDS 044-0706) at 35.7° and 39.0° seem to be present, indicating a small quantities of CuO grains are aggregating on the surface of all samples. The absence of Mn species may be explained that MnOx species are highly dispersed, or parts of them enter into the Cu–Ce binary oxides framework to form solid solution.19 The crystal sizes and lattice parameters calculated for all samples are compiled in Table 1. Comparing with the Cu–Ce sample (27.3 nm), the crystal sizes of the Mn-containing samples are gradually increased from 29.2 to 36.8 nm, which is due to the introduction of foreign cations during high-temperature condition of FSP readily result in sintering.16 Furthermore, although the ionic radii of Mn ions (Mn4+, Mn3+ and Mn2+ are 0.056, 0.062 and 0.067 nm, respectively) are smaller than that of Ce ions (Ce4+: 0.097 nm and Ce3+: 0.114 nm), comparing with the lattice parameter of the Cu–Ce sample (0.5405 nm), the largest expansion of the lattice parameter of the 1Mn–Cu–Ce sample (0.5411 nm) among the Mn containing samples demonstrates Mn or Cu ions further entering into the CeO2 lattice, and achieving higher electron density of Ce3+ for the radius of Ce3+ is larger than Ce4+.20 Ce3+ is associated with the defect concentration, which can promote the oxygen vacancy density and oxygen mobility.13
Raman spectroscopy provides further information about the structure of samples (Fig. S1†). The F2g band around 463 cm−1 is a typical characteristic of CeO2, meaning the oxygen breathing frequency around the Ce4+ cations.21 The shift of the F2g band toward low values of all samples is contributed to the presence of foreign cations into the CeO2 lattice larger than Ce4+.7 In the Mn–Cu–Ce oxides catalysts, the larger cation than Ce4+ is only Ce3+. Comparing with the F2g band of the Cu–Ce sample (459 cm−1), the 1Mn–Cu–Ce sample exhibits the largest red shift (445 cm−1), indicating the incorporation of 1Mn (Mn/Cu molar ratio of 1![[thin space (1/6-em)]](https://www.rsc.org/images/entities/char_2009.gif) :
:![[thin space (1/6-em)]](https://www.rsc.org/images/entities/char_2009.gif) 5) renders the most generation of Ce3+. This is consistent with the XRD results. Notably, another band at 686 cm−1 appeared in the Raman spectra of the 1.5Mn–Cu–Ce sample is assigned to the structure of aggregated MnOx,22 which gives the evidence to the sintering agglomeration of the excessive manganese.
5) renders the most generation of Ce3+. This is consistent with the XRD results. Notably, another band at 686 cm−1 appeared in the Raman spectra of the 1.5Mn–Cu–Ce sample is assigned to the structure of aggregated MnOx,22 which gives the evidence to the sintering agglomeration of the excessive manganese.
In order to investigate the variation of surface microstructure of the samples after Mn doping, BET measurement was carried out. Fig. 2 presents the N2 adsorption–desorption isotherms and the pore size distributions of the as-prepared samples. The N2 adsorption–desorption isotherms are attributed to type IV with an H3-type hysteresis loop, unraveling the presence of mesoporous, which are further confirmed by the distribution of pore size (Fig. 2b). With Mn dopping, there are quasi-micro pores presenting on the Mn–Cu–Ce oxides samples, the 1Mn–Cu–Ce sample exhibits the best textural properties (the biggest specific surface area, the largest pore volume and smallest pore size, as listed in Table 1), which may be ascribe to the cooperative effect between Cu and Mn.23 The fine textural property can afford more unsaturated coordination sites exposed to enhance the active oxygen species adsorption.12
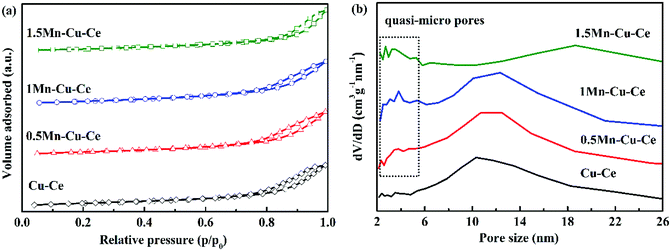 | ||
| Fig. 2 (a) N2 adsorption/desorption isotherms curves and (b) pore size distribution calculated from the desorption branch of as-synthesized samples. | ||
The morphologies of the prepared samples are revealed by FESEM measurement, as depicted in Fig. 3. The 1Mn–Cu–Ce sample exhibited uniform, spherical and porous structure (Fig. 3c), which is in good correspondency with the fine textual properties as observed in the BET characterization. The well pore structure can facilitate the diffusion of reactant molecules, thus reducing limitations of interphase mass transfer to improve the catalytic activity.24
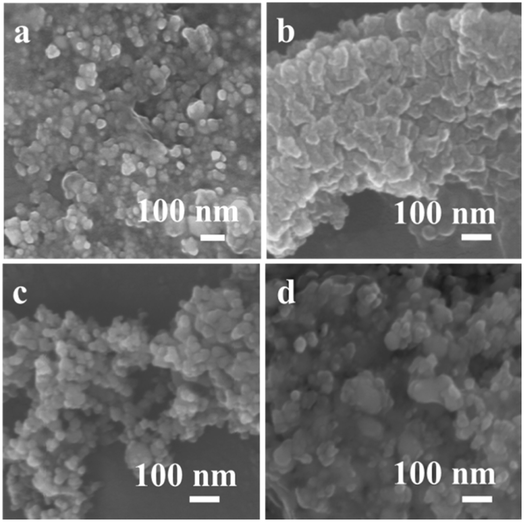 | ||
| Fig. 3 FESEM images of as-synthesized samples (a) Cu–Ce (b) 0.5Mn–Cu–Ce (c) 1Mn–Cu–Ce (d) 1.5Mn–Cu–Ce. | ||
3.2 Evaluation of the catalytic behavior
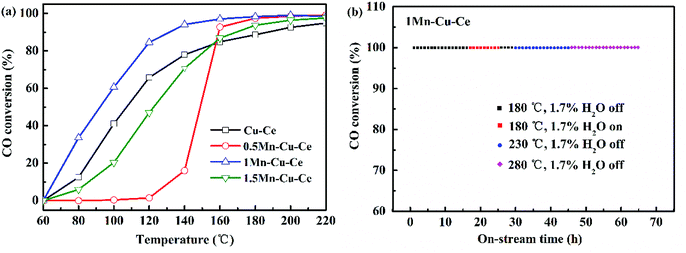
The catalytic performances of the samples are evaluated as a function of the temperature from 60 to 240 °C. Fig. 4 shows the CO conversion over the as-synthesized samples. Table 1 summarises the catalytic performance, in term of 10%, 50% and 90% CO conversion (T10, T50 and T90, respectively) as well as specific reaction r at 100 °C (the rate of CO conversion normalised with respect to specific surface area of the catalysts at the temperature of the maximum area of Cu+–CO band of the catalysts detected at the following in situ DRIFTS section). After introducing Mn into the Cu–Ce sample, the 1Mn–Cu–Ce sample has more superior catalytic activity with better results in term of T10 at 66 °C, T50 at 93 °C, T90 at 131 °C and r at 36.41 mmol m−2 h−1 than these of the Cu–Ce sample (T10 = 75 °C, T50 = 108 °C, T90 = 187 °C and r = 28.04 mmol m−2 h−1), suggesting the CO catalytic oxidation activity of the Cu–Ce sample is enhanced by 1Mn dopping (the Mn![[thin space (1/6-em)]](https://www.rsc.org/images/entities/char_2009.gif) :
:![[thin space (1/6-em)]](https://www.rsc.org/images/entities/char_2009.gif) Cu molar ratio is 1
Cu molar ratio is 1![[thin space (1/6-em)]](https://www.rsc.org/images/entities/char_2009.gif) :
:![[thin space (1/6-em)]](https://www.rsc.org/images/entities/char_2009.gif) 5), which maybe attributed to the enhanced synergetic effect among Mn–Cu–Ce oxides. Additionally, compared to the CuO–MnO2/CeO2 catalyst prepared by the co-impregnation method in the previous literature,13 the 1Mn–Cu–Ce sample prepared by the FSP method is more active, achieving the CO conversion at similar T10, T50 and T90 with higher WHSV at 60
5), which maybe attributed to the enhanced synergetic effect among Mn–Cu–Ce oxides. Additionally, compared to the CuO–MnO2/CeO2 catalyst prepared by the co-impregnation method in the previous literature,13 the 1Mn–Cu–Ce sample prepared by the FSP method is more active, achieving the CO conversion at similar T10, T50 and T90 with higher WHSV at 60![[thin space (1/6-em)]](https://www.rsc.org/images/entities/char_2009.gif) 000 mL g−1 h−1 comparing with 30
000 mL g−1 h−1 comparing with 30![[thin space (1/6-em)]](https://www.rsc.org/images/entities/char_2009.gif) 000 mL g−1 h−1 of the former.
000 mL g−1 h−1 of the former.
The evolutions of time-on-stream of CO conversion at different temperatures (180, 230, and 280 °C) for the 1Mn–Cu–Ce sample and the effect of water vapor were further investigated, the results are shown in Fig. 4b. The catalyst keeps full conversion at 180 °C during the activity test for the first 16 h. In the following 9 h stream of CO with the presence of 1.7% water vapor, it can be seen that water vapor has no negative effect on the catalyst. After removing water vapor for 4 h, and adjusting the temperature to 230 °C to last 16 h, finally rising the temperature further to 280 °C to maintain 20 h, CO conversion remains at 100%, which suggests that the 1Mn–Cu–Ce sample can stand up to the water vapor and keep the high stability under certain extent. In the FSP process, the flame temperature is thought to exceed 1000 °C in the main flame zone.18 Preparation at high temperature produces an oxide with increased stability.25 Moreover, the active species–support interactions often play a pivotal role in shaping the stability of the catalysts.26,27
3.3 Surface chemical states
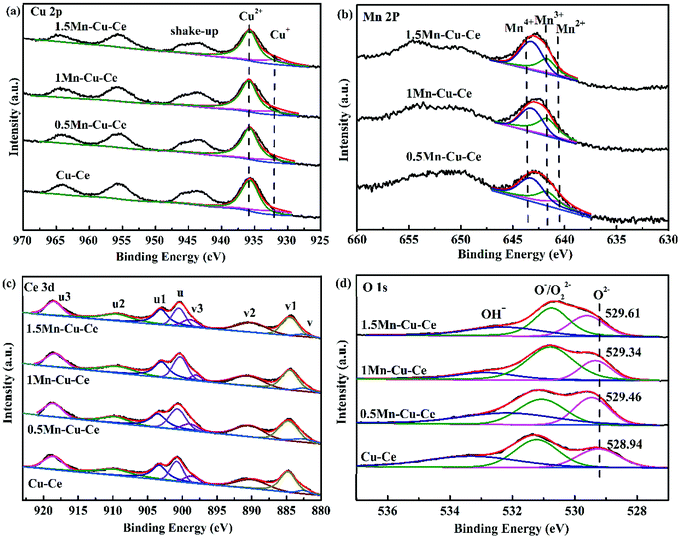
The nature of the synergetic effect of the Mn–Cu–Ce oxides is related to the valence of different elements. The XPS spectra of Cu 2p, Mn 2p, Ce 3d and O 1s core levels of the samples are shown in Fig. 5. The Cu 2p core level XPS spectrum is depicted in Fig. 5a. The one centered at 935.7 eV (Cu 2p3/2) with a shake up satellite peaks in 949.4–940.3 eV is the characteristic peak of Cu2+, and the other one centered at 931.9 eV (Cu 2p1/2) is regarded as the characteristic peak of Cu+ or Cu0.23 Since the peaks of Cu+ and Cu0 in 2p3/2 region are nearly indistinguishable due to an extremely small difference in peak position (BE), hence Cu L3VV Auger electron spectrum is recorded in Fig. S2,† and deconvoluted to main peak at 917.9 eV for Cu2+ and shoulder peak at 913.3 eV for Cu+.28 In contrast, the peak of Cu0 in Cu L3VV Auger electron spectrum is regularly at 918.7 eV, whereas the current peaks appear at lower kinetic energy, suggesting there is no presence of Cu0. The ratio of Cu2+ to Cu is determined according to percentage of corresponding peak areas, it is observed that Cu2+ ions are the main Cu species (Table 2), and the 1Mn–Cu–Ce sample possesses the largest ratio of Cu2+ (83.5%).| Sample | Mn (%) | Cu2+/Cu (%) | Ce3+/Ce (%) | Oads | Olatt | Oads/Olatt | H2-TPR (mmol g−1) | O2-TPDa (μmol g−1) | |||
|---|---|---|---|---|---|---|---|---|---|---|---|
| Mn2+ | Mn3+ | Mn4+ | Theoretical value | Actual value | |||||||
| a The chemical adsorbed oxygen (the sum of β1 and β2 peaks) desorption in the the O2-TPD results. | |||||||||||
| Cu–Ce | — | — | — | 81.0 | 36.0 | 0.40 | 0.25 | 1.63 | 1.63 | 1.66 | — |
| 0.5Mn–Cu–Ce | 18.7 | 37.3 | 44.1 | 81.0 | 35.8 | 0.36 | 0.28 | 1.27 | 1.69 | 1.57 | 0.09 |
| 1Mn–Cu–Ce | 11.0 | 45.0 | 44.0 | 83.5 | 37.5 | 0.60 | 0.21 | 2.90 | 1.74 | 1.88 | 0.24 |
| 1.5Mn–Cu–Ce | 9.9 | 35.0 | 55.1 | 74.0 | 33.9 | 0.45 | 0.28 | 1.58 | 1.80 | 1.73 | 0.12 |
The deconvolution of the Mn 2p3/2 signal is helpful to distinguish the states of Mn2+, Mn3+ and Mn4+ with binding energy values of about 640.6, 641.7 and 643.2 eV respectively,29 as depicted in Fig. 5b. Mn3+ species are the most active species comparing with Mn2+ and Mn4+ in the CO catalytic oxidation,22 and Mn3+ ions are responsible for the catalytic activity in manganese dioxide where electron transfer between Mn4+ and Mn3+ ions can take place.30 The 1Mn–Cu–Ce sample has the largest ratio of Mn3+ (45.0%), as listed in Table 2. Nevertheless, the 0.5Mn–Cu–Ce sample displays the most ratio of Mn2+ (30.3%) which exhibits the lowest reducibility among Mn species.
As observed above, Cu and Mn elements are enriched on the surface of the Mn–Cu–Ce oxides samples, and the 1Mn–Cu–Ce sample has the highest ratio of Cu2+ and Mn3+ species among the Mn–Cu–Ce oxide samples. The presence of two Jahn–Teller ions (Cu2+ and Mn3+) can result in more oxygen defects and chemically adsorbed O species,23 and facilitate the redox cycles: Cu2+ + Mn3+ ↔ Cu+ + Mn4+ shifting to the right in the CO oxidation reaction, leading to more CO active adsorbed center Cu+ to promote the catalytic activity.
The oxidation states of Ce are analyzed by fitting the curves of Ce 3d spectra (Fig. 4c). The lower binding energy peaks labeled as v (at 882.5 eV), v2 (at 889.6 eV) and v3 (at 898.7 eV) correspond to Ce4+ 3d5/2, while the higher binding energy peaks labeled as u (at 900.6 eV), u2 (at 907.7 eV) and u3 (at 916.6 eV) are characteristics of Ce4+ 3d3/2, the other two peaks labeled as v1 (at 885.6 eV) and u1 (at 903.9 eV) can be assigned to Ce3+ 3d5/2 and Ce3+ 3d3/2, respectively.31 The values of Ce3+/Ce are calculated from the ratio of the Ce3+ species to the total cerium species. According to Table 2, only the value of Ce3+/Ce of the 1Mn–Cu–Ce sample (37.4%) is larger than that of the Cu–Ce sample (36.0%), which is in conformity with the XRD and Raman results. Moreover, after dopping the CuO/CeO2 catalyst with Mn, the largest ratios of Cu2+ and Ce3+ of the 1Mn–Cu–Ce sample are beneficial of the redox reaction: Cu2+ + Ce3+ ↔ Cu+ + Ce4+ shifting to the right, forming more Cu+ species.
The O 1s spectra (Fig. 4d) report peaks which can be readily fitted into three feature peaks, the peaks at 528.9–529.7 eV are assigned to the oxygen ions in the surface lattice oxygen (Olatt), the peaks at 530.6 eV are attributed to chemically adsorbed oxygen (Oads), and the peaks at 531.5–532.7 eV belong to hydroxyl oxygen (OOH).32,33 With incorporation of Mn, the peak positions of Olatt of Mn–Cu–Ce oxides samples shift to high binding energy value (Fig. 5d) due to “O → Cu” or “O → Mn” electron transfer, which can enhance the instability related to O species and create active oxygen species (O˙, O2−, and O−).34 The 1Mn–Cu–Ce sample has the largest Oads/Olatt molar ratio than those of other samples (Table 2). As the oxygen vacancy density could facilitate the adsorption of oxygen species,35 so the fine textual properties and the largest ratio of Ce3+ of the 1Mn–Cu–Ce sample are in good agreement with the largest Oads/Olatt molar ratio. It seems that for the CO oxidation reaction both the surface and lattice oxygens play a role.3 Gaseous O2 molecules are preferentially adsorbed on the oxygen vacancies of the catalyst surface and subsequently transfer to active chemically adsorbed oxygen.23 In the meantime, as the supply of gaseous oxygen may be lacking at the low gaseous oxygen concentration, CeO2 support will release lattice oxygen to surface oxygen.
3.4 O2-TPD measurements
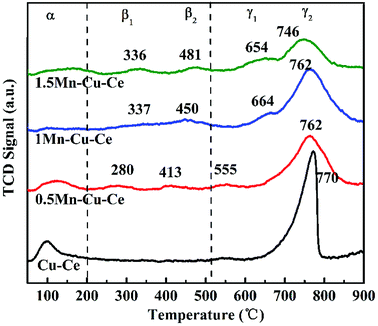
O2-TPD experiment was carried out to further investigated oxygen desorption behaviors, as shown in Fig. 6. There are three kinds of O species desorption peaks presence (denoted as α, β and γ, respectively): α peak below 200 °C is ascribed to the surface physically adsorbed oxygen. β1 and β2 peaks belong to the desorption of chemically adsorbed oxygen species. Finally, the γ1 and γ2 peaks at high temperature are designated as desorption of surface lattice oxygen.36 ϒ2 are the main oxygen desorption peaks. The ϒ2 peak at 770 °C observed on the Cu–Ce sample originates from the lattice oxygen releasing via the reduction Ce4+ → Ce3+ and Cu2+ → Cu+ → Cu0.37 In comparison to the Cu–Ce sample, dopping with Mn, the ϒ2 peaks gradually shift to the lower temperature (746–762 °C), as shown in Fig. 6, accompanying the presence of the new lattice oxygen desorption of ϒ1 peaks with lower desorption temperature (555–664 °C) and chemically adsorbed oxygen desorption peaks (β1 and β2, 280–481 °C), which provides the evidence that the mobility of lattice oxygen is improved via Mn substitution. In the CO oxidation over transition metal doped CeO2 catalyst, the oxygen vacancies can activate lattice oxygen and enhance oxygen transportation from bulk to surface of CeO2 lattice to facilitate CO catalytic oxidation,38 so the 1Mn–Cu–Ce sample displays the optimal mobility of lattice oxygen for the largest amount of oxygen vacancies. Meantime, there are two new kinds of desorption peaks presenting, the β1 and β2 peaks appearing in the range of 280–481 °C. The 1Mn–Cu–Ce sample has the largest chemically adsorbed oxygen (0.24 μmol g−1) among all Mn–Cu–Ce oxides samples (Table 2), which is in good agreement with the XPS results.3.5 H2-TPR measurements
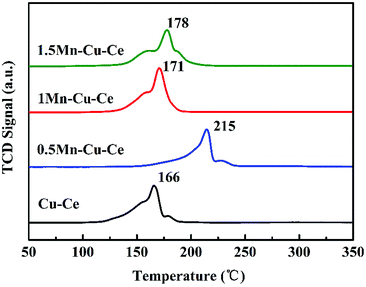
H2-TPR experiment was carried out to investigate the effect of Mn contents on the synergetic effect of the prepared samples, and corresponding results are shown in Fig. 7 and Table 2. The maximum reduction peak of the Cu–Ce sample is at 166 °C. After Mn dopping, the maximum reduction peak of the Mn–Cu–Ce oxides samples all shift to higher temperature, which is ascribed to the lower reducibility of manganese oxides than that of copper oxides due to the more negative free energy of formation of manganese oxides.39 Remarkedly, the shift of the reduction peak of the 1Mn–Cu–Ce sample is very slightly comparing with other samples (just from 166 to 171 °C). The H2 consumptions of the samples are calculated and listed in Table 2, the theoretical H2 consumption of the Cu–Ce sample is based on Cu2+ → Cu0, while the theoretical H2 consumption of the Mn–Cu–Ce oxide samples calculated from Cu2+ → Cu0 and Mn4+ → Mn3+ (because Kapteijn et al. reported that Mn3+ → Mn2+ and Mn2+ → Mn0 came up higher than 380 °C).40 The actual H2 consumption of the Cu–Ce sample (1.66 mmol g−1) is larger than that of the theoretical H2 consumption (1.63 mmol g−1), suggesting not only the reduction of copper species, but also involving the surface oxygen species of CeO2,41 which implies the existence of synergetic effect between CuO and CeO2. After Mn dopping, only the 1Mn–Cu–Ce sample exhibits the larger actual H2 consumption (1.88 mmol g−1) than the theoretical value (1.74 mmol g−1), and the gap between actual and theoretical value (0.14 mmol g−1) is distinctly enlarged than that of the Cu–Ce sample (0.03 mmol g−1), which provides the unambiguous evidence that the synergetic effect among ceria, manganese and copper oxides is promoted.3.6 CO and O2 co-adsorption in situ DRIFTS analysis
In order to investigate the influence of the synergetic effect amongst the Mn–Cu–Ce oxides on the intermediates of the CO oxidation reaction, in situ DRIFTS experiments were carried out. Fig. 8 presents the in situ DRIFTS spectra recorded in operando reaction stream as a function of temperature from 25 to 240 °C over all samples. There is a single band at 2100 cm−1 band presenting in all samples. For CuO–CeO2 system, spectral ranges of 2220–2150 cm−1 and 2160–2080 cm−1 are for CO adsorption on Cu2+ and Cu+ sites respectively.42 In the report,7 the authors agreed CO species adsorbed on 2100 cm−1 belonged to Cu+-CO. The presence of Cu+–CO originates from the easy reduction of Cu2+ to Cu+ by chemisorbed CO,43 also the intensity of Cu+–CO is related with the synergetic interaction between CuO and CeO2.28 Fig. 9 shows the area of the Cu+–CO band monitored under CO reaction conditions for all catalysts as a function of the reaction temperature. The maximum temperatures of carbonyl coverage of all samples are at 100 °C. As the CO oxidation rate is related to the temperature of maximum carbonyl coverage,7 so the temperature at 100 °C is used to calculate the CO reaction rate in the above. The area of the Cu+–CO band obtained with the 1Mn–Cu–Ce sample is the largest among all samples, which confirms the redox reactions of Cu2+ + Mn3+ ↔ Cu+ + Mn4+ and Cu2+ + Ce3+ ↔ Cu+ + Ce4+ are promoted to shift to the right to form more Cu+ species. The strong synergetic effect between active sites and support induced by the electron transfer is feasible for improving CO adsorption to enhance the catalytic performance.26,27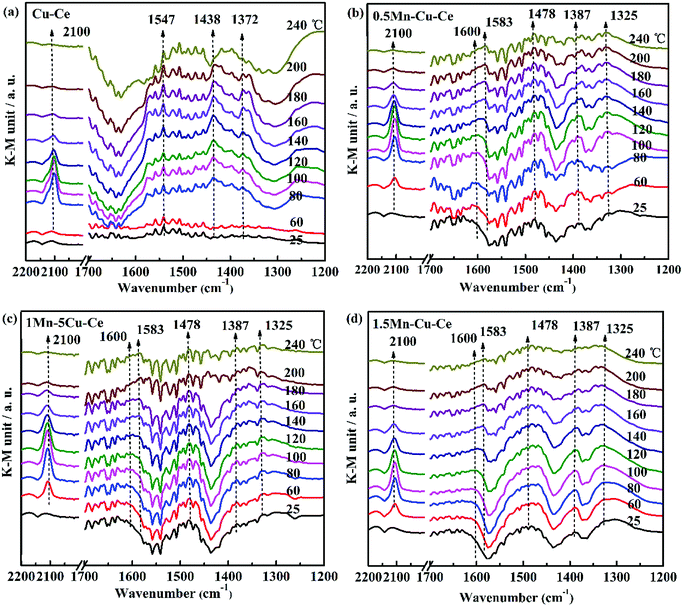 | ||
| Fig. 8 In situ DRIFT spectra as a function of temperature from 25 to 240 °C under operando CO conditions with as-synthesized samples (a) Cu–Ce (b) 0.5Mn–Cu–Ce (c) 1Mn–Cu–Ce (d) 1.5Mn–Cu–Ce. | ||
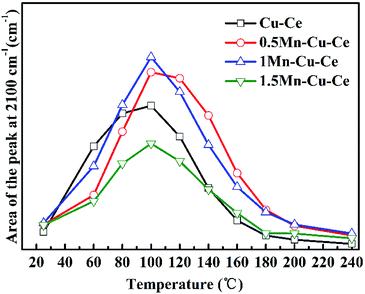 | ||
| Fig. 9 Integrated area of the Cu+–CO band at 2100 cm−1 as a function of the reaction temperature from 25 to 240 °C. | ||
The band in the 1200–1700 cm−1 range is assigned to the carbon intermediates of CO oxidation on CuO/CeO2 catalyst,7 as shown in Fig. 8. For the Cu–Ce sample (Fig. 8a), the bands at 1547 and 1372 cm−1 can correspond to formate species,44 and the 1438 cm−1 band is related with the formation of mono- or poly-dentate carbonates.45 Interestingly, after Mn dopping, all the above bands (1547, 1438 and 1372 cm−1) are disappeared, as shown in Fig. 8b–d. However, there are some new bands of the carbon intermediates presence in 1600 cm−1 (hydrogen carbonate species),45 1583 and 1325 cm−1 (bidentate carbonates),44 1478 cm−1 (the antisymmetric stretching of the terminal CO bonds in mono- or poly-dentate carbonates or a particular type of carbonite species)45,46 and 1387 cm−1 (mono- or poly-dentate carbonates),8 which suggests the specific carbon species on the interfacial sites of the catalysts are modified by incorporation of Mn. It is worthy to note that the intensity of the carbonate-related species detected on the 1Mn–Cu–Ce sample (Fig. 8c) is rather weaker than that of 0.5Mn–Cu–Ce (Fig. 8b) and 1.5Mn–Cu–Ce sample (Fig. 8d) in all temperature range, indicating less carbon intermediates are formed during the CO oxidation. Wang et al.47 proposed the strong metal-support interaction could produce more active oxygen vacancies to leach oxygen atoms from CO2 and break one of the C![[double bond, length as m-dash]](https://www.rsc.org/images/entities/char_e001.gif) O double band than form CO32−. Additionally, oxygen vacancy and mobile lattice oxygen could boost the fast conversion of carbon intermediates between metal and support. Moreover, as the chemically adsorbed oxygen is more easily desorb than the lattice oxygen,48 so after the Cu+–CO reacts with the chemically adsorbed oxygen to form the carbon intermediates, the desorption will be more readily. What is more, the fine textual properties of the catalyst develop a well pathway for active oxygen and carbon intermediate to transfer. Therefore, we can deduce the well textual properties, the large amounts of chemically adsorbed oxygen and oxygen vacancies as well as the high lattice oxygen mobility, which supported by the strongest synergetic effect of the 1Mn–Cu–Ce sample may contribute to less carbon intermediates during the CO reaction to improve the catalytic performance for CO oxidation.
O double band than form CO32−. Additionally, oxygen vacancy and mobile lattice oxygen could boost the fast conversion of carbon intermediates between metal and support. Moreover, as the chemically adsorbed oxygen is more easily desorb than the lattice oxygen,48 so after the Cu+–CO reacts with the chemically adsorbed oxygen to form the carbon intermediates, the desorption will be more readily. What is more, the fine textual properties of the catalyst develop a well pathway for active oxygen and carbon intermediate to transfer. Therefore, we can deduce the well textual properties, the large amounts of chemically adsorbed oxygen and oxygen vacancies as well as the high lattice oxygen mobility, which supported by the strongest synergetic effect of the 1Mn–Cu–Ce sample may contribute to less carbon intermediates during the CO reaction to improve the catalytic performance for CO oxidation.
4. Conclusions
In the present work, the CO catalytic activity of the CuO–CeO2 catalyst was successfully enhanced by dopping with the appropriate Mn (Mn/Cu molar ratio of 1![[thin space (1/6-em)]](https://www.rsc.org/images/entities/char_2009.gif) :
:![[thin space (1/6-em)]](https://www.rsc.org/images/entities/char_2009.gif) 5) via FSP method. The influence of the synergetic effect of the Mn–Cu–Ce oxides catalysts on the CO catalytic oxidation was further investigated. The 1Mn–Cu–Ce sample displayed superior performance than that of the Cu–Ce sample, which was attributed to well textual properties, rich chemically adsorbed oxygen and high oxygen mobility originating from the strong synergetic effect among various oxides, all these further induced formation of more Cu+ species to adsorb CO and less carbon intermediates during the CO oxidation progress to enhance the catalytic performance. Moreover, the 1Mn–Cu–Ce sample exhibited the excellent stability with prolonged time on CO stream and the resistance to water vapor.
5) via FSP method. The influence of the synergetic effect of the Mn–Cu–Ce oxides catalysts on the CO catalytic oxidation was further investigated. The 1Mn–Cu–Ce sample displayed superior performance than that of the Cu–Ce sample, which was attributed to well textual properties, rich chemically adsorbed oxygen and high oxygen mobility originating from the strong synergetic effect among various oxides, all these further induced formation of more Cu+ species to adsorb CO and less carbon intermediates during the CO oxidation progress to enhance the catalytic performance. Moreover, the 1Mn–Cu–Ce sample exhibited the excellent stability with prolonged time on CO stream and the resistance to water vapor.
Conflicts of interest
There are no conflicts to declare.Acknowledgements
This research was supported by the National Key Research and Development Program of China (2016YFC0204903, 2016YFC0207100), and the National Natural Science Foundation of China (No. 51672273).References
- M. Sun, W. Hu, S. Yuan, H. Zhang, T. Cheng, J. Wang and Y. Chen, Mol. Catal., 2018 DOI:10.1016/j.mcat.2017.10.002.
- M. Piumetti, S. Bensaid, T. Andana, N. Russo, R. Pirone and D. Fino, Appl. Catal., B, 2017, 205, 455–468 CrossRef CAS.
- M. Dosa, M. Piumetti, S. Bensaid, T. Andana, C. Novara, F. Giorgis, D. Fino and N. Russo, Catal. Lett., 2017, 148, 298–311 CrossRef.
- Y. Bu, S. Er, J. W. Niemantsverdriet and H. O. A. Fredriksson, J. Catal., 2018, 357, 176–187 CrossRef.
- X. Gong, B. Liu, B. Kang, G. Xu, Q. Wang, C. Jia and J. Zhang, Mol. Catal., 2017, 436, 90–99 CrossRef CAS.
- D. Mukherjee, B. G. Rao and B. M. Reddy, Appl. Catal., B, 2016, 197, 105–115 CrossRef CAS.
- A. Davó-Quiñonero, M. Navlani-García, D. Lozano-Castelló, A. Bueno-López and J. A. Anderson, ACS Catal., 2016, 6, 1723–1731 CrossRef.
- D. Gamarra and A. Martínez-Arias, J. Catal., 2009, 263, 189–195 CrossRef CAS.
- P. Sudarsanam, B. Hillary, B. Mallesham, B. G. Rao, M. H. Amin, A. Nafady, A. M. Alsalme, B. M. Reddy and S. K. Bhargava, Langmuir, 2016, 32, 2208–2215 CrossRef CAS PubMed.
- B. G. Rao, D. Jampaiah, P. Venkataswamy and B. M. Reddy, ChemistrySelect, 2016, 1, 6681–6691 CrossRef.
- D. Jampaiah, S. J. Ippolito, Y. M. Sabri, B. M. Reddy and S. K. Bhargava, Catal. Sci. Technol., 2015, 5, 2913–2924 RSC.
- J. Li, P. Zhu, S. Zuo, Q. Huang and R. Zhou, Appl. Catal., A, 2010, 381, 261–266 CrossRef CAS.
- Y. Guo, C. Zhao, J. Lin, C. Li and S. Lu, Catal. Commun., 2017, 99, 1–5 CrossRef CAS.
- X. Guo, J. Li and R. Zhou, Fuel, 2016, 163, 56–64 CrossRef CAS.
- J. Li, P. Zhu and R. Zhou, J. Power Sources, 2011, 196, 9590–9598 CrossRef CAS.
- R. Kydd, W. Y. Teoh, K. Wong, Y. Wang, J. Scott, Q.H. Zeng, A.B. Yu, J. Zou and R. Amal, Adv. Funct. Mater., 2009, 19, 369–377 CrossRef CAS.
- W. Y. Teoh, R. Setiawan, L. Mädler, J. D. Grunwaldt, R. Amal and S. E. Pratsinis, Chem. Mater., 2008, 20, 4069–4079 CrossRef CAS.
- G. Liu, R. Yue, Y. Jia, Y. Ni, J. Yang, H. Liu, Z. Wang, X. Wu and Y. Chen, Particuology, 2013, 11, 454–459 CrossRef CAS.
- X. Du, Z. Yuan, L. Cao, C. Zhang and S. Wang, Fuel Process. Technol., 2008, 89, 131–138 CrossRef CAS.
- P. Djinović, J. Batista and A. Pintar, Appl. Catal., A, 2008, 347, 23–33 CrossRef.
- W. Zhu, K. Tang, J. Li, W. Liu, X. Niu, G. Zhao, X. Ma, Z. Liu, H. Wei and Y. Yang, RSC Adv., 2016, 6, 46966–46971 RSC.
- K. Ramesh, L. Chen, F. Chen, Y. Liu, Z. Wang and Y.-F. Han, Catal. Today, 2008, 131, 477–482 CrossRef CAS.
- T. Liu, Y. Yao, L. Wei, Z. Shi, L. Han, H. Yuan, B. Li, L. Dong, F. Wang and C. Sun, J. Phys. Chem. C, 2017, 121, 12757–12770 CrossRef CAS.
- W. Tang, W. Li, D. Li, G. Liu, X. Wu and Y. Chen, Catal. Lett., 2014, 144, 1900–1910 CrossRef CAS.
- W. Stark, M. Maciejewski, L. Mädler, S. E. Pratsinis and A. Baiker, J. Catal., 2003, 220, 35–43 CrossRef CAS.
- Q. Liu, Y. Tian and H. Ai, RSC Adv., 2016, 6, 20971–20978 RSC.
- Z. Zhang, Y. Zhu, H. Asakura, B. Zhang, J. Zhang, M. Zhou, Y. Han, T. Tanaka, A. Wang, T. Zhang and N. Yan, Nat. Commun., 2017, 8, 16100 CrossRef CAS PubMed.
- X. Guo and R. Zhou, Catal. Sci. Technol., 2016, 6, 3862–3871 RSC.
- W. Tang, X. Wu, D. Li, Z. Wang, G. Liu, H. Liu and Y. Chen, J. Mater. Chem. A, 2014, 2, 2544–2554 RSC.
- S. B. Kanungo, J. Catal., 1979, 58, 419–435 CrossRef CAS.
- L. E. Gómez, E. E. Miró and A. V. Boix, Int. J. Hydrogen Energy, 2013, 38, 5645–5654 CrossRef.
- N. A. Merino, B. P. Barbero, P. Eloy and L. E. Cadús, Appl. Surf. Sci., 2006, 253, 1489–1493 CrossRef CAS.
- Z. Wang, G. Shen, J. Li, H. Liu, Q. Wang and Y. Chen, Appl. Catal., B, 2013, 138–139, 253–259 CrossRef CAS.
- C. He, Y. Yu, Q. Shen, J. Chen and N. Qiao, Appl. Surf. Sci., 2014, 297, 59–69 CrossRef CAS.
- D. Jampaiah, V. K. Velisoju, P. Venkataswamy, V. E. Coyle, A. Nafady, B. M. Reddy and S. K. Bhargava, ACS Appl. Mater. Interfaces, 2017, 9, 32652–32666 CrossRef CAS PubMed.
- C. He, X. Liu, J. Shi, C. Ma, H. Pan and G. Li, J. Colloid Interface Sci., 2015, 454, 216–225 CrossRef CAS PubMed.
- R. X. Zhou, T. M. Yu, X. Y. Jiang, F. Chen and X. M. Zheng, Appl. Surf. Sci., 1999, 148, 263–270 CrossRef CAS.
- D. Jampaiah, P. Venkataswamy, V. E. Coyle, B. M. Reddy and S. K. Bhargava, RSC Adv., 2016, 6, 80541–80548 RSC.
- J. Papavasiliou, G. Avgouropoulos and T. Ioannides, J. Catal., 2007, 251, 7–20 CrossRef CAS.
- F. Kapteijn, A. D. Vanlangeveld, J. A. Moulijn, A. Andreini, M. A. Vuurman, A. M. Turek, J. M. Jehng and I. E. Wachs, J. Catal., 1994, 150, 94–104 CrossRef CAS.
- L. Qi, Q. Yu, Y. Dai, C. Tang, L. Liu, H. Zhang, F. Gao, L. Dong and Y. Chen, Appl. Catal., B, 2012, 119–120, 308–320 CrossRef CAS.
- M. B. Padley, C. H. Rochester, G. J. Hutchings and F. King, J. Catal., 1994, 148, 438–452 CrossRef CAS.
- B. Qiao, A. Wang, J. Lin, L. Li, D. Su and T. Zhang, Appl. Catal., B, 2011, 105, 103–110 CrossRef CAS.
- C. Li, Y. Sakata, T. Arai, K. Domen, K. I. Maruya and T. Onishi, J. Chem. Soc., Faraday Trans., 1989, 85, 1451–1461 RSC.
- C. Binet, M. Daturi and J.C. Lavalley, Catal. Today, 1999, 50, 207–225 CrossRef CAS.
- C. Binet, A. Badri, M. Boutonnet-Kizling and J.C. Lavalley, J. Chem. Soc., Faraday Trans., 1994, 90, 1023–1028 RSC.
- C. Wang, N. Sun, W. Wei and Y. Zhao, Int. J. Hydrogen Energy, 2016, 41, 19014–19024 CrossRef CAS.
- P. Li, C. He, J. Cheng, C. Y. Ma, B. J. Dou and Z. P. Hao, Appl. Catal., B, 2011, 101, 570–579 CrossRef CAS.
Footnote |
| † Electronic supplementary information (ESI) available. See DOI: 10.1039/c8ra09626k |
| This journal is © The Royal Society of Chemistry 2019 |


