DOI:
10.1039/C8RA06744A
(Paper)
RSC Adv., 2019,
9, 2332-2342
Super stretchable chromatic polyurethane driven by anthraquinone chromogen as a chain extender†
Received
11th August 2018
, Accepted 23rd December 2018
First published on 18th January 2019
Abstract
A novel polyurethane elastomer (PUE) that exhibited high tensile strength, large elongation at break, great color strength and supreme color fastness was successfully designed and synthesized. The PUEs were prepared with isophorone diisocyanate (IPDI) as hard segments, polycarbonate diol (PCDL)/polytetrahydrofuran glycol (PTHF) as mixed soft segments, and anthraquinone chromogen as the chain extender agent. The relationships between the mechanical properties/color performance and chromogen addition content were investigated. The chromogen actual access rate of the obtained BPUEs was evaluated by UV-Vis. The clear tortuous surface and entanglements were exhibited in PUEs micromorphology structure, indicating a significant reinforcement of mechanical properties. Elongation-at-break and tensile strength reached the maximum value 2394% at 1% (BPUE1) and 18.29 MPa at 5% (BPUE5), respectively, and then decreased as chromogen addition content increased. Mechanical testing results correlate well with XRD and SEM findings, which proved that anthraquinone chromogen induced an improvement in phase separation. Furthermore, BPUE films displayed high color strength and excellent color fastnesses. The rubbing fastness and washing fastness of BPUE1 and BPUE0.5 reached grade 5, respectively. These inspiring findings suggest that PUE films with superb performance have potential to be directly applied in the textile field.
Introduction
Polyurethane elastomers (PUEs) have been widely used in various fields including surface coatings, binder resins, biomaterials, footwear, textile fabrics, and sports applications, owing to their good processability, biocompatibility and mechanical performance achievable via varying the chemical compositions of their hard and soft segments.1–5 PUEs are comprised of alternating amorphous soft and semi-crystalline hard segments.6 A soft segment is composed of polyester or polyether polyols while a hard segment is composed of di-isocyanate and a low molecular weight chain extender.8,9 The thermodynamic incompatibility between soft and hard segments leads to phase separation which is formed owing to molecular structure and mole ratio of composition.10,11 The degree of phase separation significantly affects mechanical and thermal properties of PUE.14–17 The properties of PUE can be adjusted through changing the composition and the mole ratio of hard and soft segments during synthesis or through incorporation of a filler into the PUE matrix.7 The hard segments serve as the physical cross-linkers to reinforce PUE. The hardness and tensile strength of PUE are increased with the presence of more hard segments while the stretchability is decreased with a reduction in soft segments.12,13 Consequently, it is difficult to improve the stretchability of PUE without sacrificing its tensile strength. However, it is highly desirable to develop a PUE with outstanding tensile strength as well as stretchability by controlling its phase separations.
PUEs are considered ideal materials for fabricating soft and smart textile materials which require soft and deformable properties to establish safe and flexible interactions with humans, externally and internally.18–22 PUEs with easy-processing performance can meet a wide range of needs for numerous applications. To produce waterproofing breathable coating for fabrics with highly hydrophilic waterborne polyurethanes, Kim et al. investigated a new approach for PUE synthesis in which 4′4-diisocyanato dicyclohexylmethane (H12MDI) is employed as a diisocyanate, accompanied by PEG/DMPA as a hydrophilic/ionic component, ethylenediamine (EDA) as a chain extender, and aliphatic triisocyanate as a hardener.23 A series of polyurethane-urea based liquid bandage materials with suitable softness, good elasticity, moisture absorption, and water vapor permeability were prepared from H12MDI as an aliphatic diisocyanate, hydrophilic PEG/hydrophobic PDMS blend as a soft segment and EDA as a chain extender.24 Most PUEs exhibit relatively low strain at break, poor wearing-comfort as textiles, and are not suitable to be used as textile fabrics.
Traditional colored PUEs are manufactured with a mixture of pigments and PUE matrix. Many additives are added to improve pigment dispersion uniformity. The physical blending method brings some problems, including poor compatibility between pigments and PUE matrix, due to the multiple phase reaction system. Meanwhile, PUE may also be dyed with an acid dye or a disperse dye at a relatively high temperature of 90–100 °C and a long time of 50–60 min, in a complex and time consuming process. Colored PUE films from such processes usually show a poor color fastnesses and color stability. To overcome these limitations, efforts have been made in the literature to synthesize colored PU with chromogens covalently bonded to the polymer chain.25–27 A series of stable and homogeneous blue waterborne polyurethanes were developed using colorant diols as chain extender. Experimental results indicate that the increase of colorant diol content will substantially increase the tensile strength without significantly decreasing the elongation of polyurethanes.25 Mao et al. successfully synthesized waterborne polyurethane polymeric dyes with excellent color properties.26–29
The present work aims at the fabrication of a new PUE suitable for textile applications with not only excellent color properties but also good tensile strength and high stretchability. In the elastomer design, isophorone diisocyanate (IPDI) is used as hard-segments, meanwhile polycarbonate diol (PCDL, Mn = 2000) and polytetrahydrofuran glycol (PTHF, Mn = 2000) are employed as mixed soft-segments. Moreover, various compositions are explored to examine the effect of anthraquinone chromogen and other factors (such as crystallinity and phase separation) on mechanical properties of the PUEs. A novel approach is proposed to synthesize super stretchable chromatic polyurethane elastomer by introducing anthraquinone chromogen as chain extender for potential applications in textile field, such as elastic fiber (SPANDEX), film materials, fabric coating composite colorant, composite materials high-temperature modifier.
Experimental
Materials and methods
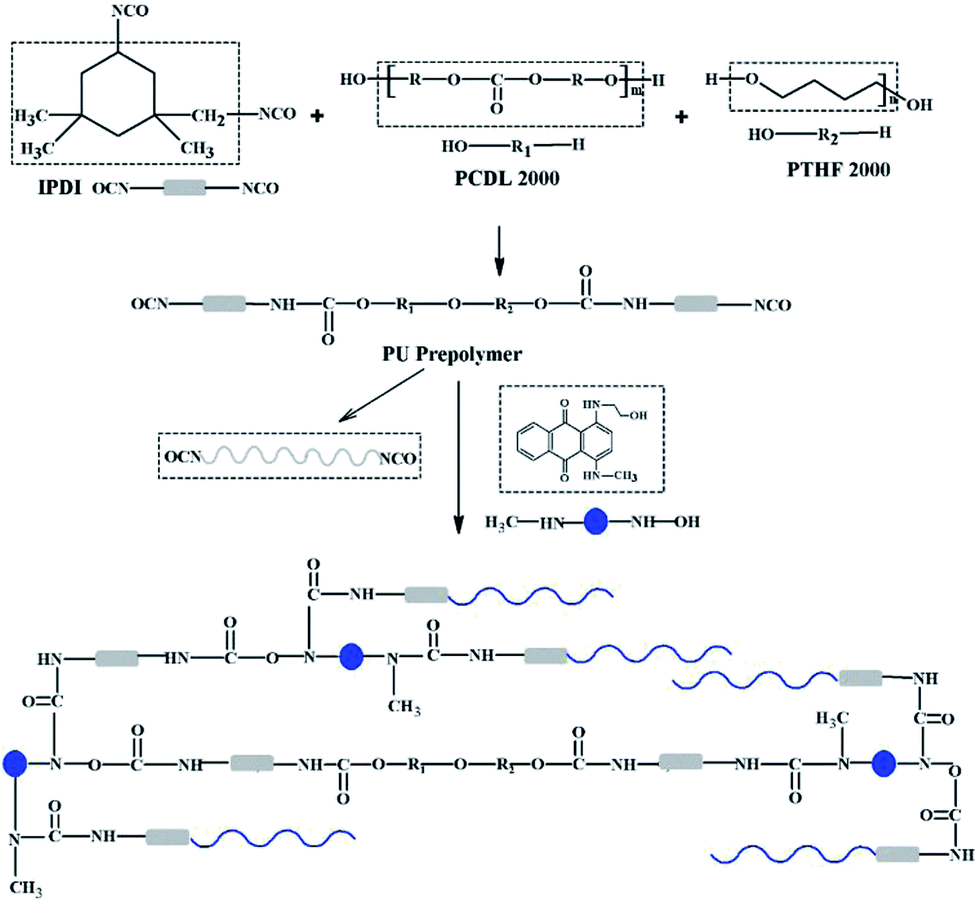
Isophorone diisocyanate (IPDI) and polytetrahydrofuran glycol 2000 (PTHF2000) were bought from Aladdin (Shanghai) Co., Ltd. Polycarbonate diol 2000 (PCDL2000) was procured from Nanjing Chemical Material Corporation Co., Ltd. The 1-((2-hydroxyethyl)amino)-4-(methylamino)-10-anthracenedione (NH–blue–OH, as shown in Scheme 1) in a raw powder form was acquired from FILO Color & Chemicals (Wuxi) Co., Ltd. Dibutyltin dilaurate (DBTDL) and acetone were all obtained from Sinopharm Chemical Reagent Co., Ltd. Acetone was dried with CaH2 and always kept with 4A molecular sieves before utilization.
 |
| | Scheme 1 Synthesis process and chemical structure of the BPUEs. | |
Synthesis of PUEs
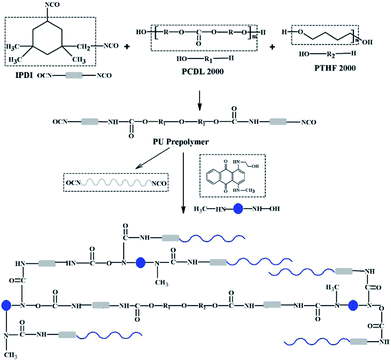
The PUEs were synthesized by a pre-polymerization method, as shown in Fig. 1 and Scheme 1. The PCDL and PTHF were dried with dry nitrogen under reduced pressure. PCDL was used as the major soft segment (80 mol%) and blended with PTHF (20 mol%) at the beginning of the synthesis. Prepolymers were prepared from PCDL/PTHF and IPDI with a ratio of K = [NCO]/[OH] = [IPDI]/[PCDL/PTHF] = 5/[3/1] at 70 °C for 2 h under a nitrogen atmosphere. The extent of the reaction was determined by an amine equivalent method. After the pre-polymerization was finished, the prepolymer and chain extender NH–blue–OH reacted at 70 °C for 2 h and then the catalyst DBTDL was added to enhance the reaction for 1 h. At last, the reaction products (inter-products 1) were precipitated in water solution. Then, they were poured into molds constructed of Teflon plates.
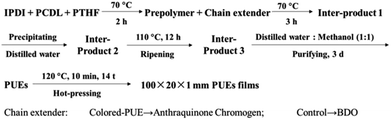 |
| | Fig. 1 Synthesis route of PUE films (chain extender: anthraquinone chromogen for BPUEs, BDO for control). | |
Preparation of PUEs films
The inter-products 1 were cut into pieces and thoroughly washed with magnetic stirring for 3 d in 50% distilled water and 50% methanol (2 L × 3) to remove any remaining chromogens, which were named as inter-products 2. Then the PUEs were suction filtered and ripened at 110 °C for 12 h, which were marked as inter-products 3. Finally, 100 × 20 × 1 mm PUEs films were prepared through hot-pressing at 120 °C.
When the chain extender NH–blue–OH was replaced by 1,4-butylene glyco (BDO), the product was marked as control. The NH–blue–OH mole ratio of PUEs were 0, 0.5%, 1.0%, 5.0%, and 10.0%, respectively, corresponding to the samples which were named control, BPUE0.5, BPUE1, BPUE5, and BPUE10.
Analytical methods
UV-visible absorption spectroscopy. Suitable aliquots of anthraquinone chromogen and PUE tetrahydrofuran (THF) solutions, kept at room temperature, were transferred to 10 mL volumetric flasks. The absorbance of each solution was measured (1 cm cell) by a UV-visible Spectrophotometer (Cary 50, Varian) within the wavelength range of 200 and 800 nm.
ATR-IR characterization of PUEs films. The structures of 1-((2-hydroxyethyl)amino)-4-(methylamino)-10-anthracenedione (NH–blue–OH) monomolecular chromogen and the PUEs films were recorded using an attenuated total reflection infrared spectroscope (NicoletiS10, Thermo Scientific, Co. Ltd, China) in the scanning range of 4000–500 cm−1 with a resolution of 4 cm−1.
Molecular weight. Gel permeation chromatography (GPC, Waters 1515 Isocratic HPLC, USA) was used to estimate the molecular weight of the PUEs with solvent dimethyl formamide (DMF) at room temperature. The molecular weight spectrogram was then recorded in 190–800 nm scanning wavelength and 0–20 cm3 min−1 flow rate. The number-average molecular weight, Mn, and the dispersity of the PUEs (solutions in DMF, 1 g dL−1) were determined.
XRD. Wide Angle X-ray Diffraction (WAXD) testing was performed on a Shimadzu XRD-6100 Diffractometer, using the Ni-filtered Cu-Kα radiation 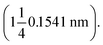 The test condition was 36 kV and 30 mA. All the diffractograms were investigated in the range 2–50° (2θ) at room temperature. The d-spacings were calculated from Bragg's equation as follows:
| |
λ = 2d![[thin space (1/6-em)]](https://www.rsc.org/images/entities/char_2009.gif) sinθ sinθ
| (1) |
where λ is the wavelength of the incident X-ray beam; d is the distance between adjacent planes of atoms (d-spacing) and θ is the angle of incidence of the X-ray beam.
Color properties (color strength, color fastness). The color properties are normally characterized by a set of parameters, such as K/S value, L*, a*, b*, which were measured using an Xrite-8400 spectrophotometer under the illuminant D65 using a 10° standard observer. K/S value represents the relative color strength. The rubbing fastnesses of PUE films were tested according to AATCC 8-2007. PUE films were separately rubbed for 50 cycles with dry and wet (moisture content 95–105%) standard crocking cloth under 9 N vertical pressure by a crocking fastness tester (Y571, Electron Instrument Co., Ltd., Laizhou, China). The washing fastnesses were measured on the basis of AATCC Test Method 61-2006 standard with 5 g L−1 soap and 2 g L−1 Na2CO3 at 60 °C for 30 min using a washing fastness tester (Wenzhou Darong Textile Instrument Co., Ltd., China). The PUE films were immersed in 10% H2SO4 and 10% NaOH solutions for 24 h at 37 °C, respectively. After removing the excess surface solutions with filter paper, the weight of the swollen sample was dried until there was no further decrease in weight. The weight loss represents the acid and alkali resistance of PUE films.
Mechanical properties. Tests for mechanical properties were performed on an Instron 5967 testing machine. Five dumb-bell shaped testing specimens of each sample were tested. Uniaxial tensile tests were carried out at a rate of 50 mm min−1 until specimen failure. The Young's modulus were calculated as the slope at the initial linear region.Shore A hardness measurements were carried out on a AICE A:90 digital hardness testing apparatus at room temperature following ASTM A 2240 standard.
Morphologies of PUEs. The surface morphologies of PUEs films were observed with a scanning electron microscope (SEM, TM3030, Hitachi). The specimens were coated with a thin layer of gold.
Thermal analysis. Differential scanning calorimetry (DSC) measurements were recorded on a TA instrument (Q200, United States) thermal analyzer. Liquid aluminum crucibles containing 3–5 mg of PUE samples were heated from −80 °C to 300 °C at a heating rate of 10 °C min−1 in nitrogen atmosphere.
Results and discussion
Polyurethanes elastomers (PUEs) consist of hard segments and soft segments. In this work, polycarbonate diol (PCDL) and polytetrahydrofuran glycol (PTHF) were used as mixed soft segments, providing excellent film forming property and stretchability. Because 1-((2-hydroxyethyl)amino)-4-(methylamino)-10-anthracenedione (NH–blue–OH) was a component forming the hard segments, the NH–blue–OH content will affect the properties of PUEs.
Quantitative analysis of NH–blue–OH (UV-Vis)
PUEs films for UV-Vis spectra analysis were fabricated by casting the solution on quartz cells. UV-Vis absorption spectra of NH–blue–OH tetrahydrofuran (THF) solutions are presented corresponding to five levels of NH–blue–OH concentrations of 25 μM, 50 μM, 100 μM, 200 μM and 400 μM. Two absorbance maxima at the wavelengths of 596.50 nm and 644.00 nm can be observed in Fig. 2.
 |
| | Fig. 2 Absorption spectra of different NH–blue–OH concentrations in THF solution. | |
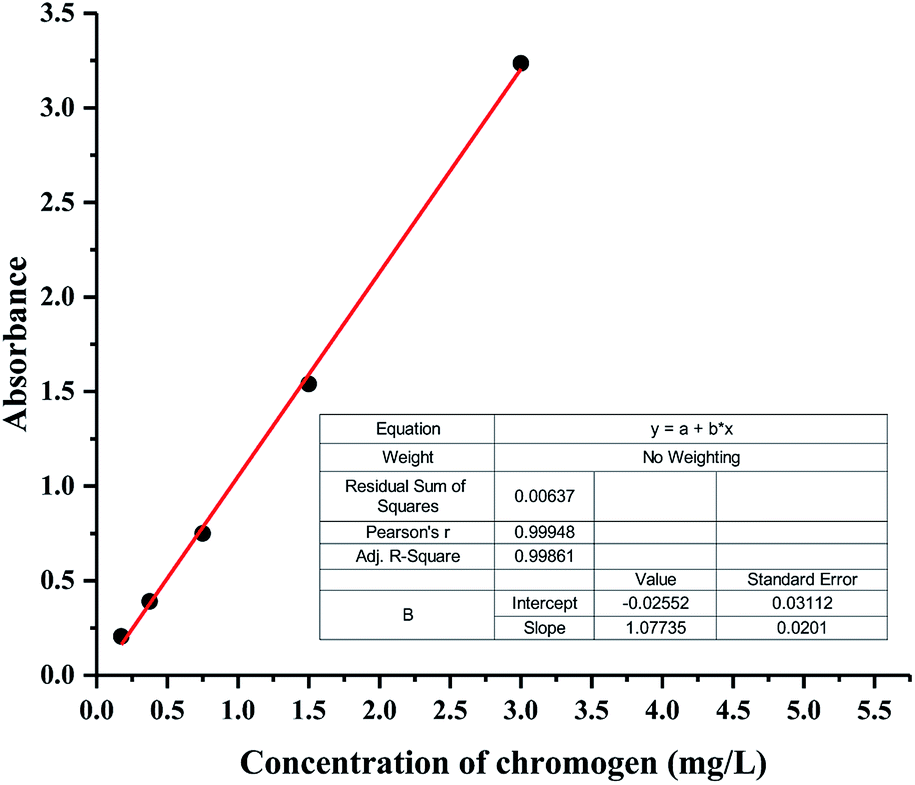
There are two absorbance maxima in every UV-Vis absorption spectra in Fig. 2 and the averages of absorbance at the wavelengths of 596.50 nm and 644.00 nm are analyzed by linear regression. A linear equation for the calibration spectra was obtained by liner regressing analysis based on the spectra of different NH–blue–OH concentrations in THF solution as shown in Fig. 3, with a correlation coefficient (R2) of 99.9%.
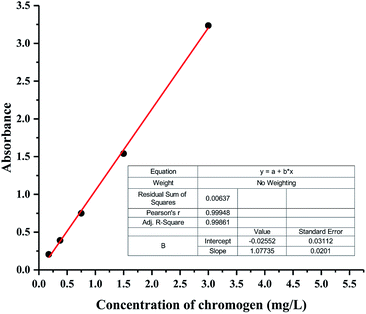 |
| | Fig. 3 Calibration spectra of different NH–blue–OH concentrations in THF solution. | |
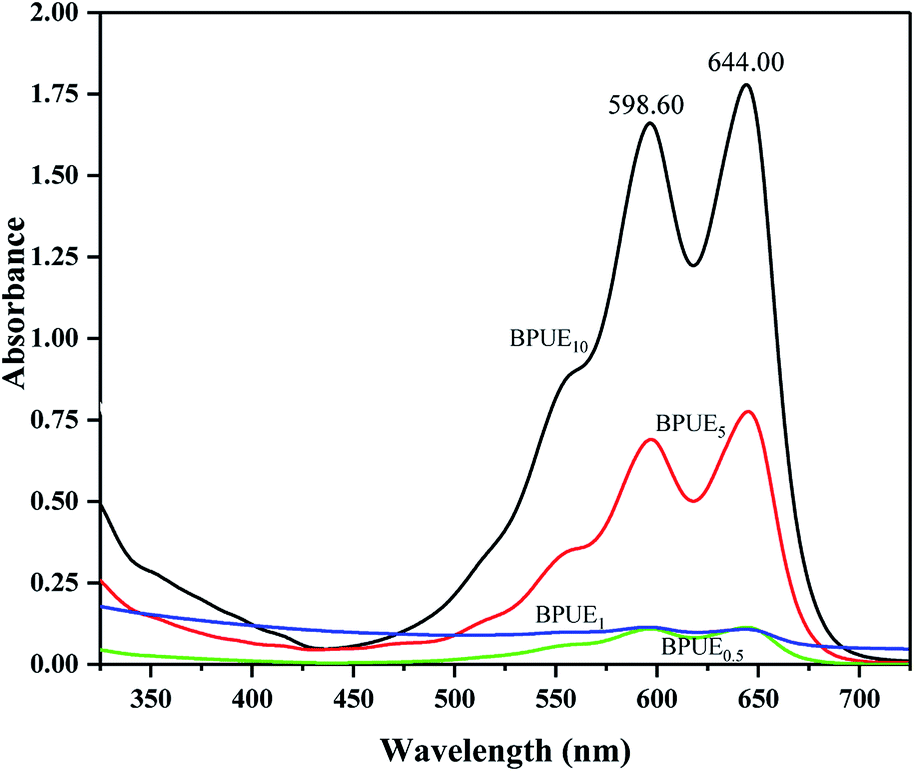
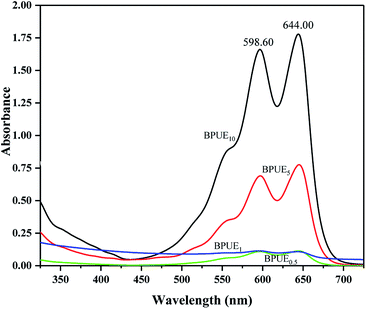
The same absorption peaks can also be observed in the spectra of BPUEs dissolved in THF solutions, as shown in figure. Since the absorption spectra of BPUEs in THF solutions (Fig. 4) correspond to the spectra of NH–blue–OH THF solutions (Fig. 2), the absorption spectra of Fig. 2 can be used for quantitative analysis of NH–blue–OH reaction rate with the aid of chemometrics methods. The difference in magnitude between the experimental and calculated values is below 5%.
 |
| | Fig. 4 Absorption spectra of the BPUEs in THF solution. | |
As displayed in Fig. 4, the maximum absorption wavelengths (λmax) exhibit at 598.60 nm and 644.00 nm, associating with the anthraquinone chromophore and auxochrome groups. It can be seen from Fig. 2 and 4, the THF solutions of BPUEs and the NH–blue–OH monomolecular dye show similar absorption curves in the ultraviolet region and visible region, demonstrating that NH–blue–OH has been successfully introduced into the BPUEs chain. Furthermore, the λmax of BPUE10, BPUE5, BPUE1 and BPUE0.5, are the same as that of individual NH–blue–OH. Since no bathochromic or hypsochromic shift of λmax is observed between the NH–blue–OH monomer dye and BPUEs, it has no significant effect on the n–π* and π–π* transitions in the anthraquinone unit whether the NH–blue–OH group is introduced into the PUEs chain or not. In general, a hypsochromic shift appears mainly because the auxochromic groups (–NH2) directly conjugated with anthraquinone react with –NCO and therefore influence the n–π* and π–π* transitions in the aromatic rings. Thus, if the active groups did not directly link with the chromophore, the λmax would not change after the NH–blue–OH monomer was embedded into the BPUEs chain.
As seen in Table 1, the actual mass percentages of BPUE0.5, BPUE1, BPUE5, and BPUE10 are 0.240%, 0.211%, 0.594% and 1.577% respectively, which were calculated according to the absorbance values of λmax. The theoretical mass values of BPUE0.5, BPUE1, BPUE5, and BPUE10 are 0.256%, 0.324%, 0.953% and 3.150%. Actual conversion rates can be obtained by comparing the theoretical mass values and the actual mass values. The chromogen actual conversion rate of BPUE0.5 was 93.85%, which confirmed that when the mole ratio of NH–blue–OH was 0.5% it nearly all the chromogen was reacted.
Table 1 Chromogen conversion rates of BPUEs
| Sample |
Wavelength (nm) |
Theoretical mass (%) |
Actual mass (%) |
Actual conversion rate (%) |
| 598.60 |
644.00 |
| BPUE10 |
1.666 |
1.784 |
3.150 |
1.578 |
50.10 |
| BPUE5 |
0.689 |
0.785 |
0.953 |
0.594 |
62.33 |
| BPUE1 |
0.109 |
0.114 |
0.324 |
0.211 |
65.12 |
| BPUE0.5 |
0.114 |
0.108 |
0.256 |
0.240 |
93.85 |
Structure characterization
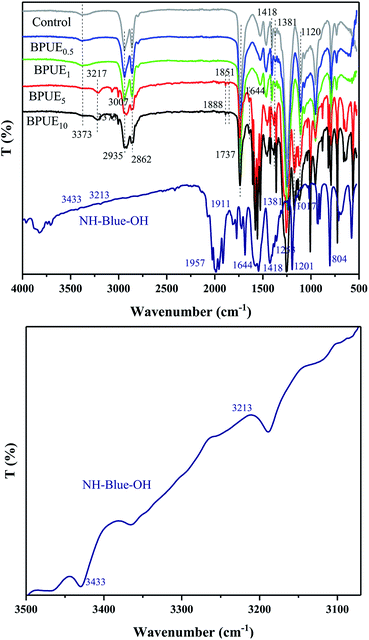
ATR-IR absorption spectra of PUE films and NH–blue–OH chromogen are displayed in Fig. 5. The absorption peaks corresponding to NH–blue–OH molecular chromogen are observed at around 3433 cm−1 (–OH), 3213 cm−1 (–NH–), 2924–2853 cm−1 (–CH2–, –CH3), 1737 cm−1 (C![[double bond, length as m-dash]](https://www.rsc.org/images/entities/char_e001.gif) O), 1600–1425 cm−1 (CC, anthraquinone ring), 1201 cm−1 (C–N), 1017 cm−1 (C–H in-plane bending vibration, anthraquinone ring) and 804 cm−1 (C–H out-plane bending vibration, anthraquinone ring). The appearance of strong bands at around 1017 cm−1 and 804 cm−1 due to C–H in-plane and out-plane bending vibrations in anthraquinone ring confirms that NH–blue–OH chromogen has been successfully introduced into the polyurethane chains,30 as indicated by the UV-Vis results. The peaks at 1737 cm−1 and 1253 cm−1 are assigned to CO and C–O in the carbonate group, and those at 3373 cm−1, 1737 cm−1 and 1381 cm−1 correspond to the stretching band of N–H, CO and C–O in the urethane group, while the peak at 1120 cm−1 is ascribed to the ether group. All the above peaks are associated with the formation of polyurethane chains.31 Additionally, the absence of characteristic stretching vibration at 2270 cm−1 (–NCO) reveals that isocyanate groups have been completely exhausted.
O), 1600–1425 cm−1 (CC, anthraquinone ring), 1201 cm−1 (C–N), 1017 cm−1 (C–H in-plane bending vibration, anthraquinone ring) and 804 cm−1 (C–H out-plane bending vibration, anthraquinone ring). The appearance of strong bands at around 1017 cm−1 and 804 cm−1 due to C–H in-plane and out-plane bending vibrations in anthraquinone ring confirms that NH–blue–OH chromogen has been successfully introduced into the polyurethane chains,30 as indicated by the UV-Vis results. The peaks at 1737 cm−1 and 1253 cm−1 are assigned to CO and C–O in the carbonate group, and those at 3373 cm−1, 1737 cm−1 and 1381 cm−1 correspond to the stretching band of N–H, CO and C–O in the urethane group, while the peak at 1120 cm−1 is ascribed to the ether group. All the above peaks are associated with the formation of polyurethane chains.31 Additionally, the absence of characteristic stretching vibration at 2270 cm−1 (–NCO) reveals that isocyanate groups have been completely exhausted.
 |
| | Fig. 5 ATR-IR spectra for different PUE films and NH–blue–OH chromogen. | |
ATR-IR absorption spectra is frequently used to analyze structural changes in the polyol polyurethane networks both qualitatively and quantitatively. As displayed in Fig. 5, there is no obvious peak in 2270 cm−1 region for all PUE films, indicating that all –NCO groups were consumed during the reaction.
In order to compare different samples, all absorbance peaks were normalized with respect to the carbonyl hydrogen bonding (around 1737 cm−1), because this peak changed with the amount of hydrogen bonding. Amrollahi et al.32 reported that hydrogen bonding index increases with no hard segment content (hydrogen bonding) due to thermodynamic incompatibility of hard and soft segments in polyurethanes. Moreover, Chen et al.33 showed that steric shielding and crowding lead to some –NH– groups with no hydrogen bonding interaction in polyurethane system. This phenomenon could be caused by two factors, the chemical interaction (crosslinking) and the length of soft segments. Through quantitative analysis, it can be seen that with the increasing NH–blue–OH mole ratio of BPUEs, the 1737 cm−1 absorption peak strength is increased, which further proves that the chromogen was successfully introduced into the polyurethane chains.
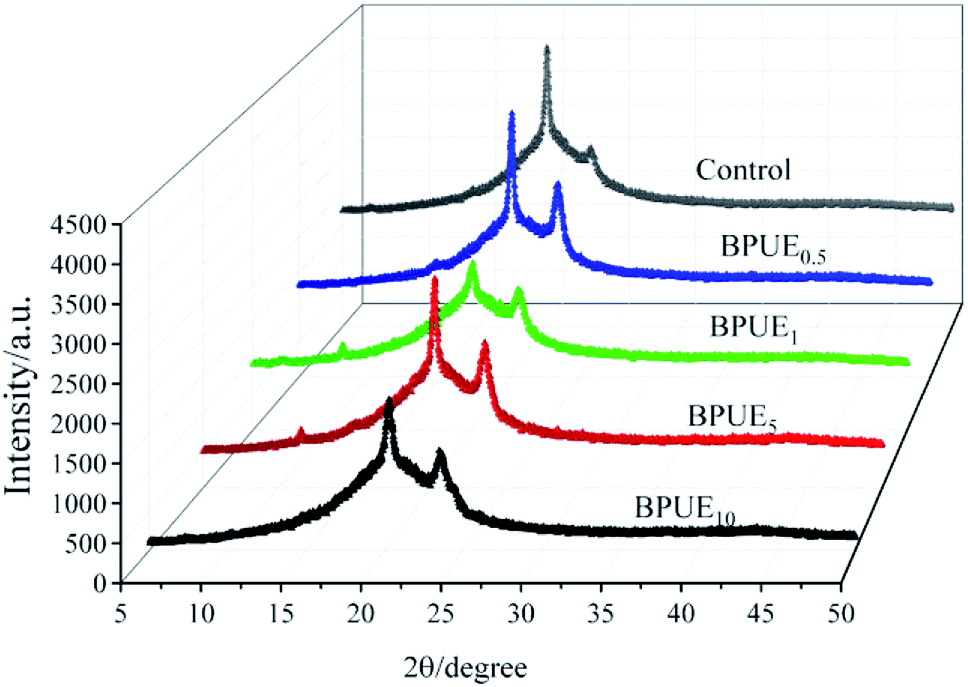
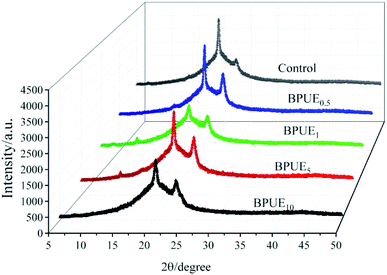
X-ray powder diffraction (XRD) testing was carried out to identify the difference of the crystalline structure among different PUEs (control, BPUE0.5, BPUE1, BPUE5, and BPUE10). In the PUEs, the degree of phase separation between soft segments and hard segments varies with their relative contents, structural regularity and thermodynamics incompatibility. The addition of chromogen supports the formation of more ordered structure, as higher peak intensities are observed for the PUEs extended with chromogen than 1,4-butane diol (BDO). XRD curves of PUEs in Fig. 6 show that the intensity of the peak around 23.62° (2θ) much depends on the concentration of chromogen in the polyurethane backbone.
 |
| | Fig. 6 X-ray diffraction patterns of PUE films. | |
It can be observed in Table 2 that increasing the chromogen content results in increased intensity of the peak around 23.62° (2θ) for the 200 lattice plane. This confirms that soft segments containing PCDL and PTHF tend to crystallize more easily so as to exhibit better distinct peaks. Additionally, the peaks for −111 lattice plane around 22.08° (2θ) mainly based on IPDI are attributed to the hard segments. In general, the crystallinity of PUEs is provided by the soft segments. In term of hard segments, they have a higher polarity than soft segments and the hard segments formed structure of PUEs would be much less crystalline than the soft segments formed structure. It is worth mentioning that hard segments also present a relatively small diffraction peak at 11.48° (2θ). The XRD patterns of the PUEs films indicate that a more ordered orientation structure is shown in these samples.
Table 2 Crystallinity characteristics of PUE films
| Sample |
2θ, ° |
Crystal plane |
I |
PWH |
| Control |
20.11 |
−111 |
838 |
0.466 |
| 23.40 |
200 |
424 |
0.481 |
| BPUE0.5 |
20.14 |
−111 |
942 |
0.374 |
| 23.44 |
200 |
321 |
0.703 |
| BPUE1 |
20.32 |
−111 |
1042 |
0.367 |
| 23.66 |
200 |
653 |
0.728 |
| BPUE5 |
11.48 |
006 |
106 |
0.306 |
| 20.08 |
−111 |
314 |
0.572 |
| 23.29 |
200 |
386 |
0.802 |
| BPUE10 |
11.48 |
006 |
83 |
0.237 |
| 20.29 |
−111 |
826 |
0.390 |
| 23.57 |
200 |
522 |
0.725 |
As it is reported, the molecular weight of PUs based on colorant diol/diamine as chain extender has significant effect on the properties. The molecular weight of PUEs also has an obvious impact on the color and other properties.
The molecular weight of PUEs can be obtained via gel permeation chromatography. The number-average molecular weight (Mn), weight-average molecular weight (Mw) and polydispersity index (PDI) of PUEs are summarized in Table 3. The average molecular weight is closely related to the proportion of diisocyanates in IPDI and hydroxyl in PCDL2000/PTHF2000 and chain extender. Theoretically, when the proportion of –NCO and –OH groups is close to 1:1, the molecular weight of PUEs can increase infinitely. The –NCO groups of prepolymer and IPDI react with the –OH and –NH groups of chain extender until the –NCO groups are exhausted completely, reaching the end of polyreaction. As can be seen in Table 3, the Mn and Mw of the control are 164094 and 371499, respectively, which is much larger than BPUEs. The polydispersity of control, BPUE0.5, BPUE1, BPUE5, and BPUE10 is 2.26, 2.09, 2.15, 1.86 and 1.72, indicating a relatively homogeneous distribution of molecular weight. Therefore, the study shows that the kinds of chain extender plays a very important role on Mn, Mw and PDI of PUEs.
Table 3 PUEs molecular weight with different content of NH–blue–OH chromogen
| Sample |
Mn |
Mw |
Poly dispersity |
| Control |
164094 |
371499 |
2.26 |
| BPUE0.5 |
138313 |
289646 |
2.09 |
| BPUE1 |
175502 |
377007 |
2.15 |
| BPUE5 |
79365 |
147402 |
1.86 |
| BPUE10 |
68140 |
117283 |
1.72 |
Color property
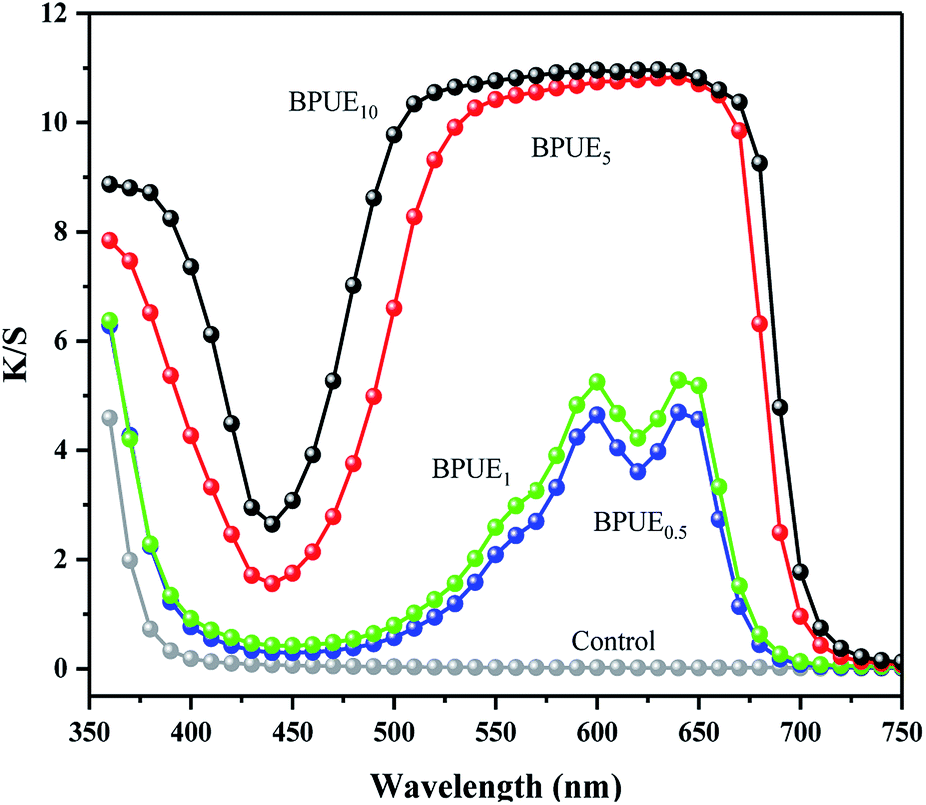
The chromatic values (K/S) and color parameters (L*, a* and b*) of the PUEs films were examined to investigate the influence of chromogen contents on the color properties. The results are shown in Fig. 7 and Table 4. The K/S vs. wavelength curves and maximum absorption wavelengths for the BPUE1 and BPUE0.5 films were similar despite the different in chromogen content.
 |
| | Fig. 7 K/S value curves of PUE films. | |
Table 4 Color properties of PUE films
| Sample |
K/S value |
L* |
a* |
b* |
| Control |
0.03 |
91.42 |
−0.20 |
7.69 |
| BPUE0.5 |
4.19 |
52.57 |
−8.45 |
−34.61 |
| BPUE1 |
5.28 |
49.13 |
−6.50 |
−33.52 |
| BPUE5 |
10.79 |
26.95 |
15.34 |
−33.82 |
| BPUE10 |
10.99 |
25.78 |
10.76 |
−22.21 |
The K/S values of BPUE0.5, BPUE1, BPUE5, and BPUE10 films are 4.19, 5.28, 10.79 and 10.99, which show the K/S values reduce by 61.87%, 51.96%, 1.82% and 0% as the chromogen contents increases from 0.5%, 1.0% to 5.0%, 10.0%. The color lightness (L*) decrease with increasing chromogen addition molar ratio. In general, when L* is fixed, the red color value (a*) increase with increasing blue color value (b*). However, if the L* value is not constant and changes obviously, a* and b* values may not change regularly. The changes in these chromatic values and color parameters indicate that as the chromogen contents increase, the colors of the BPUE films turn dark and gloomy.
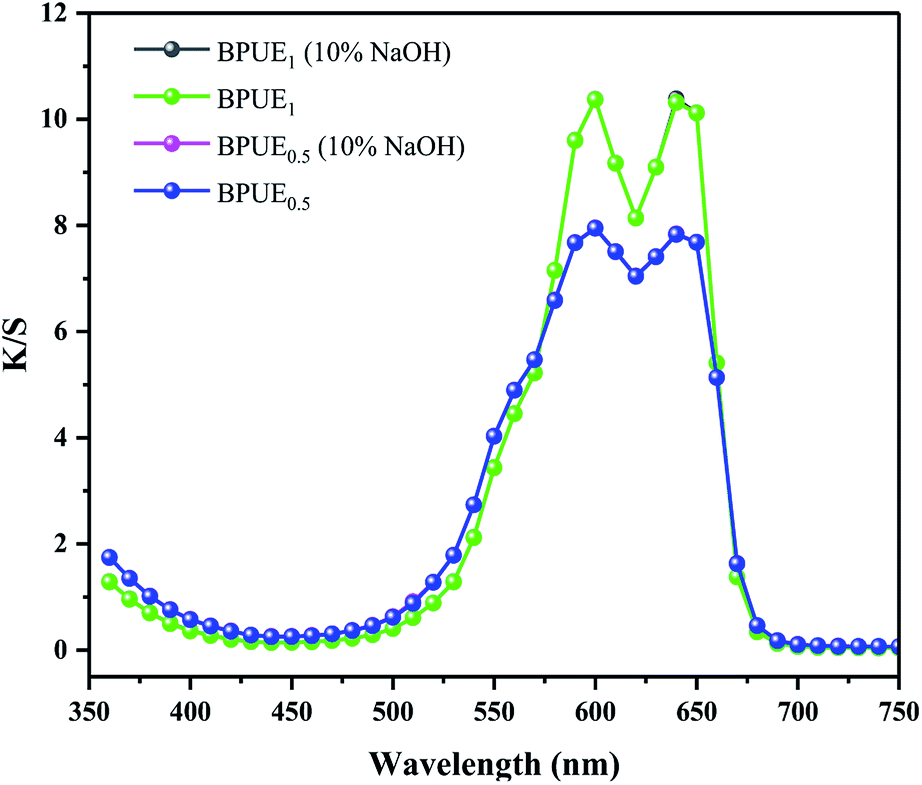
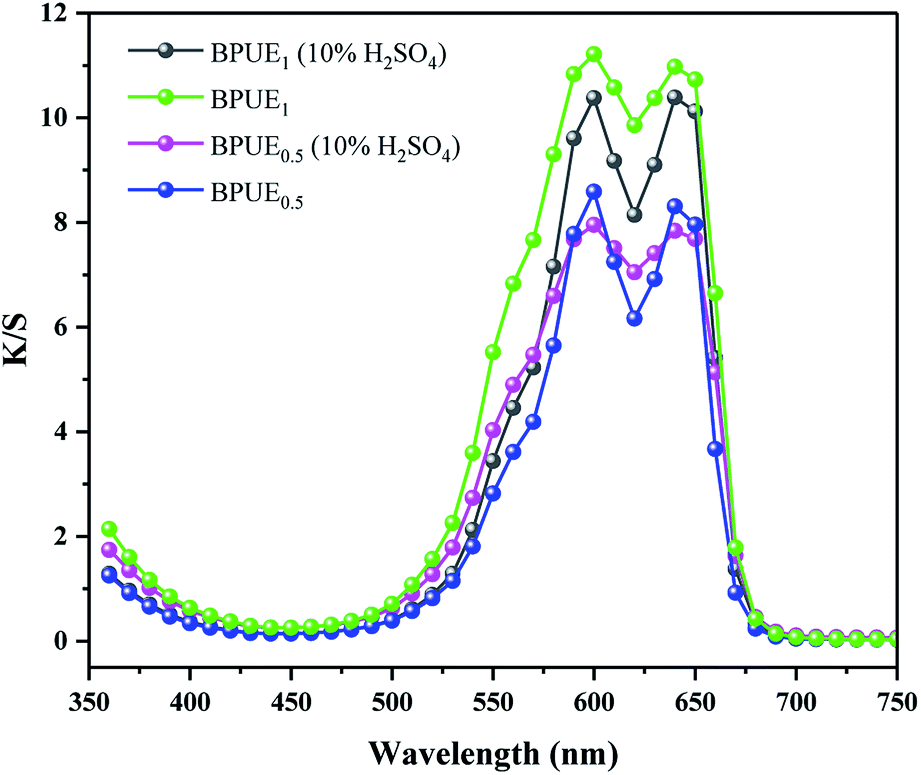
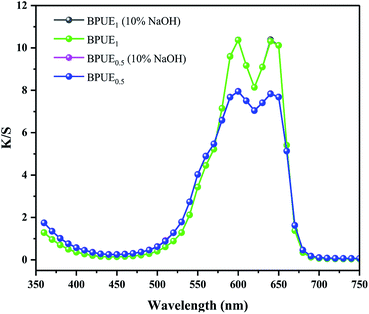
Color properties of BPUE1 and BPUE0.5 which were immersed in 10% H2SO4 and 10% NaOH solutions, respectively, for 24 h at 37 °C are shown in Fig. 8 and 9. The K/S values of BPUE1 and BPUE0.5 are similar before and after being immersed in 10% NaOH, demonstrating good alkali resistance of BPUE1 and BPUE0.5. There was a slightly change for the K/S values of BPUE1 and BPUE0.5 after being immersed in 10% H2SO4 as a small amount of chromogen was dissolved in the acid solutions, but overall good acid resistances of BPUE1 and BPUE0.5 was observed.
 |
| | Fig. 8 Alkali resistance of BPUE1 and BPUE0.5 films (immersed in 10% NaOH for 24 h). | |
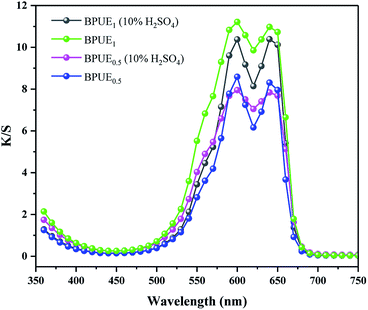 |
| | Fig. 9 Acid resistance of BPUE1 and BPUE0.5 films (immersed in 10% H2SO4 for 24 h). | |
The color fastnesses of textiles are given in five grades, from grade 1 (severe loss) to grade 5 (no color change), and the results for the BPUE films are reported in Table 5. The rubbing and washing fastnesses of BPUE films changed from grade 5 for low chromogen content to grade 1 for high chromogen content. Color fastness mainly depends on the bonding strength between polymer chain and chromogen. The rubbing fastnesses of BPUE1 and BPUE0.5 are both grade 5, whereas, the rubbing fastnesses of BPUE10 and BPUE5 are grade 1. The –NCO groups in PUEs form hydrogen bonds with –OH active sites. However, excessive –NCO groups often conduct self-polymerization and the product tends to accumulate on the film surface, which can easily fall off from the films in rubbing or washing process. This explains why the color fastnesses of BPUE1 and BPUE0.5 with low chromogen content are superb. Another interesting point is that the shape and thickness of BPUE1 films after washing remain unchanged from their original dimensions (Fig. 10). Therefore, the BPUE1 and BPUE0.5 films with superior color properties and fastnesses have the potential to be directly used as fabrics.
Table 5 Rubbing and washing fastnesses of BPUEs films
| Sample |
Rubbing fastnesses |
Washing fastnesses |
| Dry |
Wet |
Change |
Staining |
| BPUE0.5 |
5 |
5 |
5 |
5 |
| BPUE1 |
5 |
5 |
5 |
5 |
| BPUE5 |
1 |
2 |
— |
— |
| BPUE10 |
1 |
1 |
— |
— |
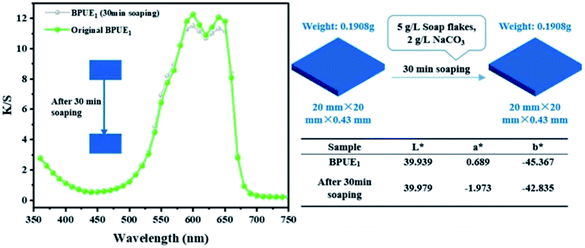 |
| | Fig. 10 Effect of washing on K/S values and specimen dimensions of BPUE1 films. | |
Mechanical property
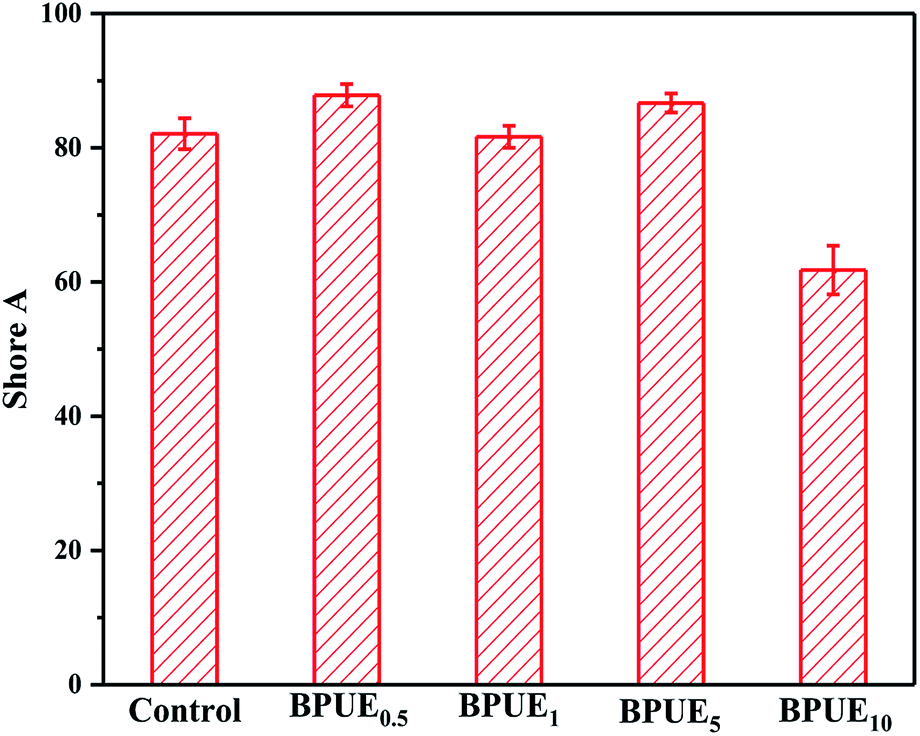
A unique feature of PUEs is that they can be processed to cover a wide range of hardness, which is an important mechanical property for PUEs. The hardness can be adjusted for the PUE films between Shore A 81–88 in Fig. 11. Shore A hardness of PUEs corresponding to different contents of chromogen is largely influenced by the content and the morphology of the hard phase, and the values are consistent with soft rubbers.34 The hardness of the PUE films are affected by many factors such as H-bonding, phase separation and crosslink density. In contrast, the Shore A hardness for BPUE10 (10% molar ratio chromogen) is much lower (Shore A 61.7), which may be caused by an overdose of chromogen affecting hydroxyl activity.
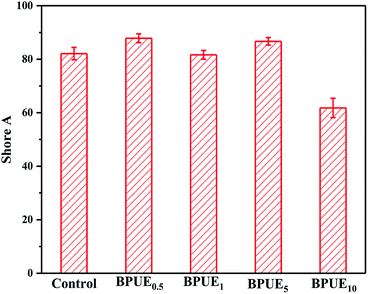 |
| | Fig. 11 Shore A hardness of PUEs films. | |
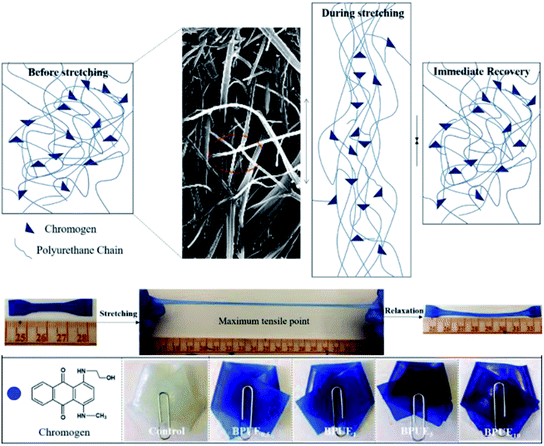
The mechanical properties of the PUE films are affected by the structural difference between control and BPUEs, crosslinking density and intermolecular interactions between their hard segments. The tensile–strain curves of control and BPUEs with different molar ratios of NH–blue–OH are shown in Fig. 12. Compared to the average strain of control sample (1259%), it can be observed that the average strains of BPUE0.5, BPUE1, BPUE5, and BPUE10 are 2108%, 2394%, 1300% and 2010%, respectively. Meanwhile the average stresses of control, BPUE0.5, BPUE1, BPUE5, and BPUE10 are 14.49 MPa, 7.84 MPa, 13.38 MPa, 18.29 MPa and 16.71 MPa, respectively. The optimal stress–strain property is obtained from BPUE1, exhibiting a tensile stress at break of 13.35 MPa and strain of 2394%. The chemical cross-linking is the critical factors to result in the PUEs' high stretchability, meanwhile the synergistic combination of physical interactions is also the secondary cause, which includes π–π stacking between segments, hydrogen bonding and crystallization of the soft segments.35,36 Fig. 13 illustrated the enhancement mechanisms of PUE films reinforced with chromogen as chain extender.
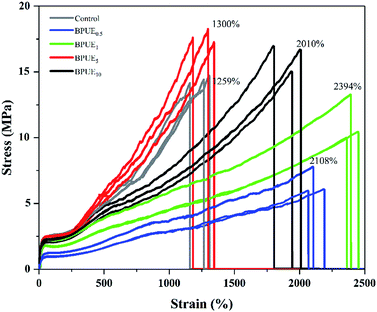 |
| | Fig. 12 Effects of chromogen addition mole ratio on the tensile behavior of PUEs. | |
 |
| | Fig. 13 Enhancement mechanisms of BPUE films. | |
Surface morphology
The surface morphology of PUE films is analyzed with SEM and typical images are depicted in Fig. 14. The PUE films show a continuous and smooth surface. Compared to control PUE film, BPUEs display a relatively coarse and apparently phase separated morphology. Moreover, with the addition of 1.0 wt% chromogen, the micrograph become significantly rough of BPUE1 are observed. The clear tortuous surface and entanglements are found in BPUEs. Chromogen induced phase separation and acted as cross-linkers, which improve the cohesion force between hard segments and suppress the spread of cracks, meanwhile the stiffness and toughness of BPUEs are enhanced.
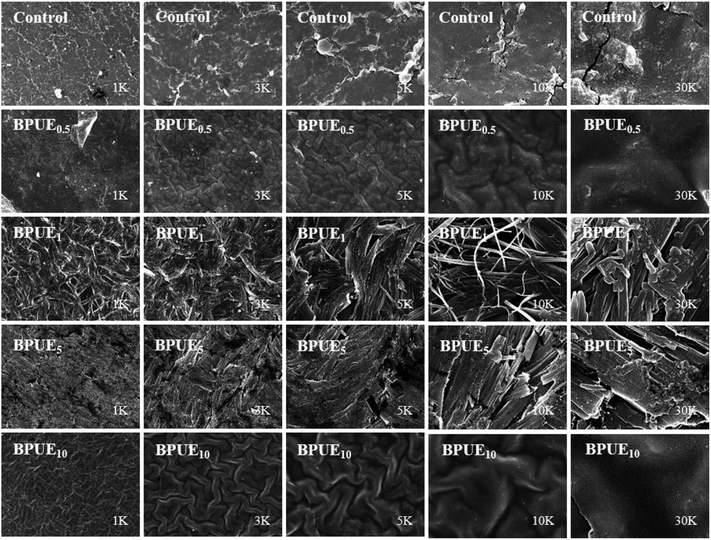 |
| | Fig. 14 Surface morphologies of the PUE films with different chromogen contents. | |
Thermal analysis
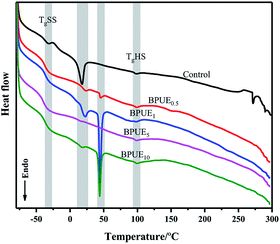
The thermal behavior of the PUEs based on PCDL 2000 and PTHF 2000 with chromogen as chain extender was obtained from DSC curves as displayed in Fig. 15 and Table 6. PUEs (control, BPUE0.5, BPUE1, BPUE5, and BPUE10) exhibited TgHS (hard segment glass transition temperature) and TgSS (soft segment transition temperature) in the range of −39.48 to −36.87 °C and 97.17–98.68 °C, respectively, implying microphase separation between the hard and soft segments, which demonstrated a very slight difference between the samples. TgSS and TgHS are related to the flexibility of PUE segment. In general, higher Tg indicates that PUE contains more immobile segments. A relatively high TgSS was observed in the PUE because the hard segments were evenly dispersed in the PUE, which greatly limited the flexibility of soft segments. In fact, the lower TgSS generally correspond to the higher degree of phase separation in PUE. BPUEs exhibit a lower TgSS, indicating that the addition of chromogen increase the phase separation between the soft and hard segments, thereby enhancing the mechanical properties of the PUE. On the other hand, with the increase amount of the chromogen, the strong interaction between the chromogen and the hard segment will bring more obstacles to the movement of the hard segment, which leads to the increase of TgHS. The results showed the degree of microphase separation of PUE increased with the increase of chromogen amount.
 |
| | Fig. 15 DSC curves of PUEs. | |
Table 6 Basic thermal parameters of control and BPUEs
| Sample |
TgSS/°C |
TgHS/°C |
Tr1/°C |
ΔHr1/(J g−1) |
Phase transition |
Tr2/°C |
ΔHr2/(J g−1) |
Phase transition |
| Control |
−36.87 |
98.12 |
10.84 |
3.21 |
Solid–solid |
— |
— |
— |
| BPUE0.5 |
−37.83 |
98.68 |
15.51 |
0.51 |
Solid–solid |
44.85 |
0.34 |
Solid–solid |
| BPUE1 |
−36.89 |
97.17 |
14.99 |
1.32 |
Solid–solid |
41.95 |
4.64 |
Solid–solid |
| BPUE5 |
−39.48 |
98.68 |
13.77 |
0.07 |
Solid–solid |
— |
— |
— |
| BPUE10 |
−38.45 |
98.30 |
16.04 |
0.25 |
Solid–solid |
39.92 |
3.02 |
Solid–solid |
Conclusions
In this work, PUEs (polyurethane elastomers) with excellent color properties and superb stretchability were successfully synthesized with anthraquinone chromogen as chain extender. The results of UV-Vis quantitative analysis, K/S values and color fastnesses for PUEs confirm that anthraquinone chromogens were successfully introduced to PUE chains. Meanwhile, the PUE films exhibit high tinting strength and accomplish an excellent color fastness performance. The introduction of anthraquinone chromogens into polyurethane chain enhance the color strength and improve the color fastness. High tensile stress and strain are also achieved, especially for BPUE1 (1.0 wt% chromogen) which shows high tensile stress (13.35 MPa) and very excellent strain (2394%). FTIR, XRD and SEM results also suggest chromogen induced an improvement in phase separation which helps to enhance mechanical properties. This study provides us a facile approach to prepare BPUEs with excellent color properties and superb stretchability based on anthraquinone chromogen as chain extender for potential application. Based on the excellent properties of BPUEs, the potential applications of BPUEs were explored. As film materials, the excellent coloring properties, supreme mechanical performance and high-temperature processing properties have laid a foundation for their direct application in the textile field. It also provides a simple and feasible coloring method of aramid fabric. In order to overcome the hard/brittle and difficult coloring problems of polylactic acid (PLA), the BPUEs can be used as blending modifier to improve the mechanical properties of PLA and give PLA excellent color properties.
Conflicts of interest
There are no conflicts to declare.
Acknowledgements
The authors are grateful for the financial support of National Natural Science Foundation of China (21174055), Fundamental Research Funds for the Central Universities (JUSRP51724B), National First-Class Discipline Program of Light Industry Technology and Engineering (LITE2018-21), 111 Project (B17021), International Joint Research Laboratory for Advanced Functional Textile Materials of Jiangnan University, Postgraduate Research & Practice Innovation Program of Jiangsu Province in China (KYCX17_1471).
References
- S. Hsu, C. T. Hsieh and Y. M. Sun, J. Mater. Chem. B, 2015, 3, 9089–9097 RSC.
- M. V. Pergal, J. Nestorov, G. Tovilović, S. Ostojić, D. Gođevac, D. Vasiljević-Radović and J. Djonlagić, J. Biomed. Mater. Res., Part A, 2014, 102, 3951–3964 CrossRef PubMed.
- S. A. Guelcher, K. M. Gallagher, J. E. Didier, D. B. Klinedinst, J. S. Doctor, A. S. Goldstein, G. L. Wilkes, E. J. Beckman and J. O. Hollinger, Acta Biomater., 2005, 1, 471–484 CrossRef PubMed.
- Y. Chen, Y. Li, D. Xu and W. Zhai, RSC Adv., 2015, 5, 82034–82041 RSC.
- D. V. Anokhin, M. A. Gorbunova, Y. I. Estrin, V. V. Komratova and E. R. Badamshina, Phys. Chem. Chem. Phys., 2016, 18, 31769–31776 RSC.
- B. Fernández-d'Arlas, J. Balko, R. P. Baumann, E. Pöselt, R. Dabbous, B. Eling and T. Thurn-Albrecht, Macromolecules, 2016, 49, 7952–7964 CrossRef.
- S. A. Madbouly, Y. Xia and M. R. Kessler, Macromolecules, 2013, 46, 4606–4616 CrossRef CAS.
- J. A. Miller, S. B. Lin, K. K. Hwang, K. S. Wu, P. E. Gibson and S. L. Cooper, Macromolecules, 1985, 18, 32–44 CrossRef CAS.
- C. Zhang, S. A. Madbouly and M. R. Kessler, ACS Appl. Mater. Interfaces, 2015, 7, 1226–1233 CrossRef CAS PubMed.
- P. K. Behera, K. M. Usha, P. K. Guchhait, D. Jehnichen, A. Das, B. Voit and N. K. Singha, RSC Adv., 2016, 6, 99404–99413 RSC.
- V. V. Tereshatov and V. Y. Senichev, J. Macromol. Sci., Part B: Phys., 2014, 53, 575–587 CrossRef CAS.
- Q. Liu, L. Jiang, R. Shi and L. Zhang, Prog. Polym. Sci., 2012, 37, 715–765 CrossRef CAS.
- R. G. Heijkants, R. V. van Calck, T. G. van Tienen, J. H. de Groot, P. Buma, A. J. Pennings, R. P. Veth and A. J. Schouten, Biomaterials, 2005, 26, 4219–4228 CrossRef CAS PubMed.
- Z. Liu, Y. Luo, H. Bai, Q. Zhang and Q. Fu, ACS Sustainable Chem. Eng., 2015, 4, 111–120 CrossRef.
- M. J. Wiggins, M. MacEwan, J. M. Anderson and A. Hiltner, J. Biomed. Mater. Res., Part A, 2004, 68, 668–683 CrossRef PubMed.
- H. S. Lee, Y. K. Wang and S. L. Hsu, Macromolecules, 1987, 20, 2089–2095 CrossRef CAS.
- C. W. Meuse, X. Yang, D. Yang and S. L. Hsu, Macromolecules, 1992, 25, 925–932 CrossRef CAS.
- S. Mondal and J. L. Hu, J. Membr. Sci., 2006, 274, 219–226 CrossRef CAS.
- J. K. Yun, H. J. Yoo and H. D. Kim, J. Appl. Polym. Sci., 2007, 105, 1168–1176 CrossRef CAS.
- A. Mukhopadhyay and V. K. Midha, Handbook of Technical Textiles, 2016, pp. 27–55 Search PubMed.
- R. Narayan, D. K. Chattopadhyay, B. Sreedhar, K. V. S. N. Raju, N. N. Mallikarjuna and T. M. Aminabhavi, J. Appl. Polym. Sci., 2016, 99, 368–380 CrossRef.
- S. Hollande and J. L. Laurent, J. Appl. Polym. Sci., 1999, 73, 2525–2534 CrossRef CAS.
- E. Y. Kim, J. H. Lee, D. J. Lee, Y. H. Lee, J. H. Lee and H. D. Kim, J. Appl. Polym. Sci., 2013, 129, 1745–1751 CrossRef CAS.
- S. J. Choi, J. H. Lee, Y. H. Lee, D. Y. Hwang and H. D. Kim, J. Appl. Polym. Sci., 2011, 121, 3516–3524 CrossRef CAS.
- J. Su, X. Zhang, J. Dai and J. Zhang, J. Dispersion Sci. Technol., 2012, 33, 1373–1378 CrossRef CAS.
- H. Mao, C. Wang and Y. Wang, New J. Chem., 2015, 39, 3543–3550 RSC.
- F. Yang, C. W. Y. Wang, D. Yao and Y. Yin, RSC Adv., 2015, 5, 30631–30639 RSC.
- H. Mao, S. Qiang, F. Yang, C. Zhao, C. Wang and Y. Yin, J. Appl. Polym. Sci., 2015, 132, 42780 Search PubMed.
- H. Mao, S. Qiang, Y. Xu and C. Wang, New J. Chem., 2017, 41, 619–627 RSC.
- C. Wang, Y. Zheng, Y. Sun, J. Fan, Q. Qin and Z. Zhao, Polym. Chem., 2016, 7, 6120–6132 RSC.
- H. Xia and M. Song, Soft Matter, 2005, 1, 386–394 RSC.
- M. Amrollahi, G. M. M. Sadeghi and Y. Kashcooli, Mater. Des., 2011, 32, 3933–3941 CrossRef CAS.
- J. Chen, B. Guo, T. W. Eyster and P. X. Ma, Chem. Mater., 2015, 27, 5668–5677 CrossRef CAS PubMed.
- I. Fink, B. Eling, E. Pöselt and G. A. Luinstra, J. Polym. Sci., Part A: Polym. Chem., 2018, 56, 1162–1172 CrossRef CAS.
- J. Li, L. Ma, G. Chen, Z. Zhou and Q. Li, J. Mater. Chem. B, 2015, 3, 8401–8409 RSC.
- Y. Wang, T. Li, X. Wang, P. Ma, H. Bai, W. Dong, Y. Xie and M. Chen, Biomacromolecules, 2016, 17, 3782–3789 CrossRef CAS PubMed.
Footnote |
| † Electronic supplementary information (ESI) available. See DOI: 10.1039/c8ra06744a |
|
| This journal is © The Royal Society of Chemistry 2019 |
Click here to see how this site uses Cookies. View our privacy policy here. 
 Open Access Article
 This Open Access Article is licensed under a Creative Commons Attribution-Non Commercial 3.0 Unported Licence
 *a,
Youjiang Wangb and
Donggang Yaob
*a,
Youjiang Wangb and
Donggang Yaob

 The test condition was 36 kV and 30 mA. All the diffractograms were investigated in the range 2–50° (2θ) at room temperature. The d-spacings were calculated from Bragg's equation as follows: