DOI:
10.1039/C8RA09618J
(Paper)
RSC Adv., 2019,
9, 10454-10464
4-(Pyridin-4-yl)thiazol-2-amine as an efficient non-toxic inhibitor for mild steel in hydrochloric acid solutions
Received
22nd November 2018
, Accepted 21st March 2019
First published on 3rd April 2019
Abstract
A novel eco-friendly corrosion inhibitor, namely, 4-(pyridin-4-yl)thiazol-2-amine (PTA), was synthesized and evaluated as a corrosion inhibitor for mild steel in 1 M HCl solution. Its inhibition effect against mild steel corrosion was investigated via weight loss methods, electrochemical measurements, and surface analyses. The experimental results showed that PTA is an effective corrosion inhibitor for mild steel in an acid medium, and the maximum inhibition efficiency reached 96.06% at 0.2 mM concentration. Polarization studies showed that PTA acted as a mixed inhibitor. The sorption behavior on the steel surface complies with the Langmuir adsorption isotherm, exhibiting both physisorption and chemisorption. The constitution and characteristic of the protective layer on the steel surface were verified using scanning electron microscopy (SEM)/energy-dispersive X-ray spectroscopy (EDX) and UV-Vis spectroscopy. Quantum chemistry calculations were used to study the relationship between the inhibition efficiency and molecular structure of the inhibitor.
Introduction
Mild steel is an excellent metal material (good mechanical properties, easy synthesis, etc.) that has been widely used in metallurgy, machinery, power, chemical, and other industries. However, during the acid cleaning process, mild steel is prone to corrosion, resulting in huge economic losses and potential safety problems. In all kinds of anticorrosion measures, adding inhibitors is a quick, economical, and practically effective measure. In particular, organic heterocyclic compounds containing N, O, S, and unsaturated bonds have excellent adsorption properties to metal surfaces, and they can effectively inhibit the acid corrosion of metals.1–6 Among them, N-heterocyclic organic compounds, particularly azoles and pyridines, have become the focus of research because of their good water solubility, low cost, and excellent corrosion inhibition. For example, Yüce et al.4 studied 2-amino-4-methyl-thiazole (AMT) in a hydrochloric acid (HCl) solution as a corrosion inhibitor for mild steel; the results show that AMT exhibited good inhibition efficiency and can form a dense layer of a protective film on the surface of mild steel toward corrosion inhibition of the metal. Zhang et al.7 studied the inhibition mechanism of two thiazole derivatives for corrosion prevention of mild steel in acid solutions by theoretical calculations. They found that the difference in the corrosion resistance was mainly caused by the electronic structure of the inhibitor molecules. In addition, Verma et al.8 studied three kinds of chromenopyridine corrosion inhibitors in HCl solution with regard to the corrosion of steel; the results reveal that pyridine inhibitors in acid solutions exhibit excellent corrosion inhibition. The presence of polar groups significantly increases the inhibition efficiency. It is well known that thiazoles and pyridines show good inhibition efficiency in HCl solution;7–9 therefore, we envisioned that a combination of thiazoles and pyridines might provide a new corrosion inhibitor platform. Furthermore, 4-pyridinylthiazole-2-amines are non-toxic and environmentally friendly since they are widely used in medicine and have the potential to become green corrosion inhibitors.10,11
In this article, a novel eco-friendly inhibitor, namely, 4-(pyridin-4-yl)thiazol-2-amine (PTA), was smoothly synthesized by using a modified synthesis procedure, and it was selected as the corrosion inhibitor mainly based on the following factors: (1) could be easily synthesized at lower costs; (2) could contain multiple active centers and aromatic rings; (3) has special affinity toward the inhibition of metal corrosion in acidic solutions; (4) has bulky steric hindrance. The corrosion inhibition properties of the compound in a HCl medium were investigated by weight loss methods, potentiodynamic polarization measurements, and electrochemical impedance spectroscopy (EIS). The formation and characteristics of the protective film on the steel surface were determined by scanning electron microscopy (SEM), energy-dispersive X-ray spectroscopy (EDX), and UV-vis spectroscopy. The inhibition mechanism of corrosion inhibition in mild steel has been discussed by calculating the electronic structures of the inhibitor molecule.
Experimental
Synthesis and characterization of inhibitors
PTA was synthesized in the laboratory on the basis of the represented experimentation,11 and the synthesis procedure is shown in Fig. 1. A mixture of 4-(bromoacetyl)pyridine hydrobromide (843 mg, 3 mmol) and thiourea (274 mg, 3.6 mmol) was added to a 100 mL flask that contained 20 mL ethanol; then, this mixture was heated to 353 K under magnetic stirring and refluxing. After 10 h, the solvent was removed under vacuum, and the crude reaction mixture was purified by flash chromatography on a SiO2 column with EtOAc/PE solvent system. The molecular structure of PTA was verified by 1H NMR and 13C NMR (Fig. 2), as shown below:
 |
| | Fig. 1 Synthesis route of the studied PTA. | |
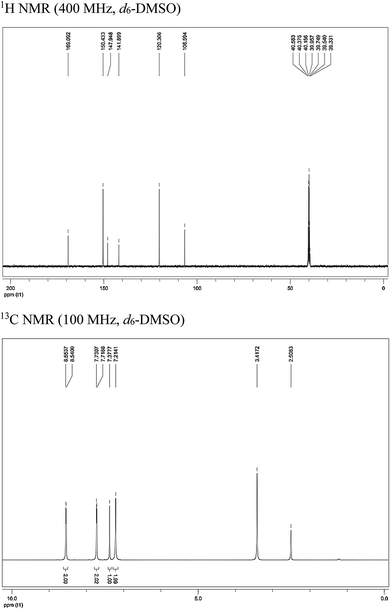 |
| | Fig. 2 Characterization data for PTA. | |
1H NMR (400 MHz, d6-DMSO): δ 8.55 (d, J = 5.2 Hz, 2H, –ArH), 7.72 (d, J = 5.2 Hz, 2H, –ArH), 7.38 (s, 1H, ![[double bond, length as m-dash]](https://www.rsc.org/images/entities/char_e001.gif) CHS–), 7.21 (s, 2H, –NH2); 13C NMR (100 MHz, d6-DMSO): δ/ppm = 169.1, 150.4, 147.9, 141.9, 120.3, 106.6.
CHS–), 7.21 (s, 2H, –NH2); 13C NMR (100 MHz, d6-DMSO): δ/ppm = 169.1, 150.4, 147.9, 141.9, 120.3, 106.6.
Electrodes and electrolytes
The experimental material is mild steel. Its chemical composition (wt) is 0.17 C, 0.38 Mn, 0.22 Si, 0.03 S, 0.02 P, and the balance is Fe. The specifications of the sample used in the electrochemical and surface analysis experiments were conducted by mechanically cutting it into dimensions of 3.0 cm × 0.6 cm × 0.5 cm and 1.0 cm × 1.0 cm × 0.02 cm, respectively. In the electrochemical experiment, the working electrode was implanted in the epoxy resin, and the exposure proportion was maintained at 0.30 cm2. Prior to each test, the electrode surface was polished to 1200# by SiC abrasive papers, washed with acetone, and dried at room temperature. Then, 1 M HCl was used as the corrosion test solution prepared with analytical grade 37% HCl and ultrapure water, and the corrosion inhibitor concentration was 0.05–0.20 mm.
Weight loss experiments
Weight loss tests were performed under the condition of different concentrations of PTA inhibitors in 1 M HCl medium at room temperature [(25 ± 0.1) °C] for 72 h. After the corrosion test was completed, the specimens' surfaces were carefully rinsed with ultrapure water, dried, and weighed. The corrosion rate (v) was obtained from the average of three parallel experimental data.5 Moreover, the effect of temperature (25 °C to 55 °C) on the corrosion inhibition performance of PTA was also determined by the weight loss method.
Electrochemical measurements
The electrochemical tests in PARSTAT2273 electrochemical workstation were performed using a traditional three-electrode system: saturated calomel electrode (SCE) as the reference electrode, Pt electrode as the auxiliary electrode, and mild steel as the working electrode. Before testing, the electrode was immersed in a solution for 0.5 h to obtain a stable working surface. The potentiodynamic polarization curves were measured in the potential range from −750 to −250 mV (vs. SCE) at a scan rate of 1 mV s−1. EIS measurements were conducted at EOCP in the frequency range from 100 kHz to 100 MHz and the amplitude was 5 mV. ZSimpWin software was used to fit the experimental results, and the corresponding EIS parameters and corresponding equivalent circuit were obtained.
Surface morphology investigation: SEM and EDX
The surface morphology of the steels immersed in 1 M HCl solution with or without a 0.2 mM corrosion inhibitor was observed by SEM and EDX. The SEM study was performed on a SUPR™55 instrument (Zeiss, Germany) at 2000× magnification.
UV-vis spectroscopy experiments
A UV-vis spectrophotometer (PerkinElmer, LAMBDA 25) was employed to confirm that the Inh–Fe complex was formed between the inhibitor molecules and mild steel. The absorption spectra of the corrosion inhibitors for steel before and after 24 h immersion in 1 M HCl were recorded and HCl was used as the blank control.
Quantum chemical calculations
All the quantum chemical calculations were performed using density functional theory (DFT) at the B3LYP/6-31G(d,p) level with the Gaussian 09 program package.12 The quantum chemical parameters of the studied inhibitor molecules were calculated, including the lowest unoccupied molecular orbital energy (ELUMO), highest occupied molecular orbital energy (EHOMO), energy gap (ΔE = ELUMO − EHOMO), natural bond orbital (NBO) charges, and 3D MEP plot.
Results and discussion
Weight loss study
The weight loss method is one of the simplest monitoring methods and has high reliability in the evaluation of corrosion inhibition capability of organic corrosion inhibitors. Fig. 3 shows v and inhibition efficiency (ηw) of steel in 1 M HCl with different concentrations of PTA at 30 °C. The v and ηw values can be calculated by using the following equations:| |
 | (1) |
| |
 | (2) |
where v is the corrosion rate, W1 and W2 (mg) are the weight of the steel specimens before and after immersion, s (cm2) is the exposed area of the steel samples, t (h) is the soaking time, and vo and v denote the corrosion rates in the solution without and with inhibitors, respectively. As seen in Fig. 3, the v value of mild steel observably decreased and the ηw value increased as the inhibitors were added. At 0.3 mM, the maximum ηw value of PTA was 97.92%. The results indicated that the presence of PTA could effectively inhibit the corrosion of steel in 1 M HCl, and the high inhibition efficiency of PTA could be attributed to the presence of multiple polar nitrogen/sulfur atoms and amino groups that enhances the adsorption of the inhibitor; therefore, PTA has larger surface coverage and more adsorption active centers on the steel surface.
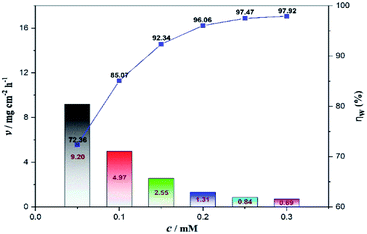 |
| | Fig. 3 Variation in corrosion rate and inhibition efficiency at different concentrations of PTA by weight loss. | |
Effect of temperature
In order to understand the effect of temperature on corrosion inhibition, the weight loss of mild carbon steel was measured in 1 M HCl at different temperatures from 25 °C to 55 °C without and with 0.2 mM PTA inhibitor (Table 1). From Table 1, it is evident that the values of v increased with the temperature in both uninhibited and inhibited solutions, which can be attributed to the desorption of initially adsorbed inhibitor molecules, leading to the exposure of a large metal surface area to corrosive media; therefore, the efficiency of the inhibitor decreases at higher temperatures. This implies that PTA is a temperature-related corrosion inhibitor.
Table 1 Weight loss results of mild steel in 1 M HCl with 0.2 mM PTA at different temperatures
| T (°C) |
Blank |
PTA |
| va (mg cm−2 h−1) |
v (mg cm−2 h−1) |
ηw (%) |
| 25 |
33.29 ± 0.092 |
1.31 ± 0.073 |
96.06 |
| 35 |
46.67 ± 0.054 |
3.47 ± 0.034 |
92.56 |
| 45 |
64.25 ± 0.066 |
8.76 ± 0.052 |
86.37 |
| 55 |
88.96 ± 0.075 |
18.30 ± 0.087 |
79.43 |
On one side, the kinetic analysis was performed to better understand the effect of temperature on the inhibition mechanism. The activation energy (Ea) of the corrosion process can be obtained by the Arrhenius equation, namely, eqn (3):
| |
 | (3) |
where
vcorr denotes the rate of corrosion,
R is the gas constant,
T is the absolute temperature, and
A is the pre-exponential factor.
Fig. 4 shows the Arrhenius plots for steel immersed in 1 M HCl without and with inhibitors. The
Ea values determined from the slopes of the straight lines are listed in
Table 2. According to
Table 2, all the regression coefficients practically draw near unity, suggesting that the corrosion of mild steel in 1 M HCl solution is fitted in the kinetic model. The values of
Ea in the solutions with three inhibitors are higher than those of the solutions in the absence of inhibitors, which may be related to the presence of the physical adsorption phenomenon by the formation of an adsorptive film of an electrostatic character on the mild steel surface, as reported in the literature.
13,14 The enthalpy and entropy of activation (Δ
H* and Δ
S*, respectively) of the process can be obtained by the transition state equation (
eqn (4)), as listed in
Table 2.
| |
 | (4) |
where
h and
N are the Planck constant and Avogadro number, respectively. The plot of ln(
vcorr/
T)
vs. 1/
T for steel in 1 M HCl in the presence and absence of inhibitors at different temperatures is shown in
Fig. 5.
Table 2 shows that the values of Δ
H* are positive, which suggests that the activation process is an endothermic corrosion process. According to various reports, it is understood that inhibitors can retard the dissolution of metals in solution.
14 Therefore, the Δ
H* value obtained in the current study (
Table 2) showed that the dissolution of mild steel is an endothermic process and was influenced by PTA inhibitors. The higher values of Δ
S* in the presence of PTA may be caused by the adsorption of inhibitor molecules, which could be considered as a quasi-substitution process between the inhibitor molecules in solution and the water molecules on the steel surface; similar results have been reported elsewhere.
13,14
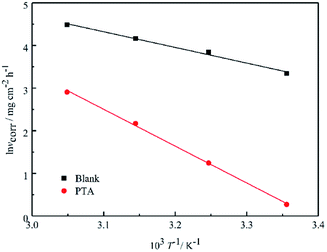 |
| | Fig. 4 Arrhenius plots of ln![[thin space (1/6-em)]](https://www.rsc.org/images/entities/char_2009.gif) vcorr vs. 1/T for steel in 1 M HCl in the absence and presence of inhibitors. vcorr vs. 1/T for steel in 1 M HCl in the absence and presence of inhibitors. | |
Table 2 Activation parameters for steel dissolution in 1 M HCl in the absence and the presence of inhibitors
| Inhibitors |
R2 |
Ea (kJ mol−1) |
ΔH* (kJ mol−1) |
ΔS* (J mol−1 K−1) |
| Blank |
0.991 |
30.60 |
28.00 |
−123.28 |
| PTA |
0.998 |
71.89 |
69.29 |
−10.42 |
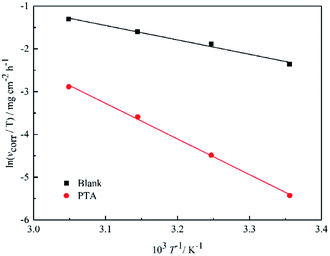 |
| | Fig. 5 Arrhenius plots of ln(vcorr/T) vs. 1/T for steel in 1 M HCl in the absence and presence of inhibitors. | |
Adsorption isotherms
The adsorption mechanism of inhibitors was usually described by the adsorption isotherm. The data obtained from the weight loss (ηw) were fitted by Langmuir, Temkin, and Frumkin adsorption isotherms to discuss the adsorption mechanism of the corrosion inhibitors, which can be calculated by the following equations:| |
 | (5) |
| | |
Temkin: exp(fθ) = Kadsc
| (6) |
| |
 | (7) |
where c is the inhibitor concentration, θ represents the surface coverage calculated according to eqn (2), f is the factor of energetic inhomogeneity, and Kads is the adsorption equilibrium constant. Fig. 6 shows the plots obtained from eqn (5)–(7), where the correlation coefficient R2 of the Langmuir isotherm (Fig. 6a) was above 0.999, which was better than those for the Temkin isotherm (Fig. 6b) and Frumkin isotherm (Fig. 6c). The results show that the experimental data are fitted in the Langmuir isotherm and exhibit single-layer adsorption characteristics.15–17 The standard adsorption free energy (ΔG0ads) of the adsorption process related to Kads can be calculated by the following equation:| |
ΔG0ads = −RT![[thin space (1/6-em)]](https://www.rsc.org/images/entities/char_2009.gif) ln(55.5Kads) ln(55.5Kads)
| (8) |
where ΔG0ads denotes the free energy of adsorption, T is the thermodynamic temperature, and R represents the gas constant. The calculated ΔG0ads value is −36.33 kJ mol−1; a negative value of ΔG0ads indicates that the inhibition of the PTA molecular adsorption on the steel surface is spontaneous. In general, if |ΔGads| < 20 kJ mol−1, the inhibitor molecules are attracted to the surface of the metal substrate through electrostatic attraction, belonging to a physical adsorption characteristic; when |ΔGads| > 40 kJ mol−1, organic molecules are adsorbed on the metal surface with charge sharing or transfer from chemical bonds, which belongs to a chemical adsorption characteristic.18–22 In this study, the value of ΔG0ads was calculated as −36.33 kJ mol−1, revealing that the corrosion inhibitor molecules adsorbed on the steel surface were not an adsorption process simply induced by a physical function or chemistry, but it was the result of a joint action between the two types of adsorptions. The higher |ΔG0ads| also shows that the stronger adsorption of PTA molecule on a material surface induces better corrosion inhibition through chemical adsorption. A more detailed relationship between gentle adsorption erosion will be elaborated further in the subsequent section on quantum chemical calculations.
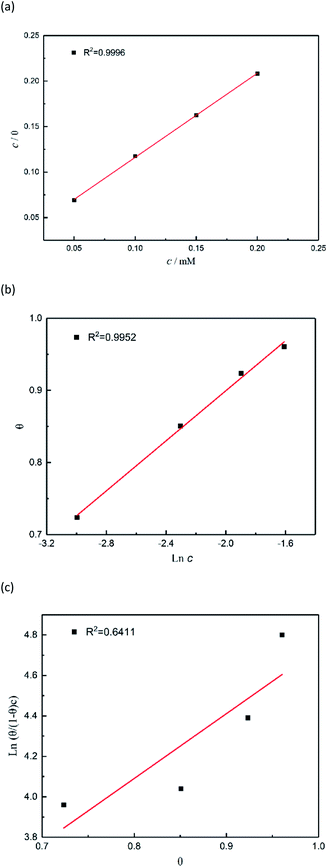 |
| | Fig. 6 Plots of (a) Langmuir, (b) Temkin, and (c) Frumkin isotherms for the adsorption of inhibitors on the surface of mild steel in 1 M HCl. | |
Potentiodynamic polarization curves
Fig. 7 shows the polarization curves of the working electrode in 1 M HCl solution without and with different concentrations of PTA inhibitors. From Fig. 6, it is evident that after the addition of PTA inhibitors, the cathode and anode polarization curves were positively shifted and the corrosion current density was significantly reduced. Namely, there was an inhibitory effect on the anodic dissolution of the electrode, and the evolution of the cathodic hydrogen was inhibited. The higher the concentration of the inhibitory effect, the higher is the inhibitory efficiency. However, the corrosion potential has negative displacement with the maximum displacement of 24 mV, which is less than 85 mV, indicating that PTA is a mixed corrosion inhibitor that mainly inhibits the cathodic reaction. In an acidic medium, other N/O-heterocyclic corrosion inhibitors also have analogous results with regard to steel corrosion, which have been reported.23–25 In addition, the cathodic polarization curves showed no obvious parallel changes, indicating that the hydrogen evolution reaction mechanism remained unchanged with an increase in the corrosion inhibitors. The reduction of hydrogen ions on a mild steel surface was mainly via the charge transfer mechanism, and the hydrogen evolution reaction on the metal surface of the active site was inhibited by the adsorption of corrosion inhibitors.7 In the anodic region, when the electric potential is greater than −280 mV, the anodic current density sharply increases with the electric potential, indicating that if the electric potential exceeds a certain value, the inhibitors begin to desorb, which is often called the desorption potential. According to Zhang,3 this phenomenon at the anode implies that the rate at which steel dissolves is faster than the rate at which the protective film forms, leading to the desorption of inhibitor molecules on the active surface of the steel. The calculation of the electrochemical parameters such as corrosion potential (Ecorr), anodic and cathodic Tafel slopes (βa and βc, respectively), corrosion current density (icorr), and inhibition efficiency (η) are summarized in Table 3. The inhibition efficiency can be calculated as follows: | |
 | (9) |
Here, i0corr and icorr indicate the corrosion current densities of mild steel in the solution without and with a corrosion inhibitor, respectively. Table 3 shows that with an increase in the concentration of inhibitor, icorr gradually decreased and η gradually increased. When the concentration reached 0.20 mM, the inhibition efficiency reached 96.57%. Therefore, PTA has excellent corrosion inhibition performance in HCl solutions. Further, Ecorr, bc, and ba did not significantly change with the addition of an inhibitor, showing that corrosion mainly occurs on the metal surface on which a protective film is formed, which suppresses the contact area between the metal and corrosive medium and reduces the corrosion rate of steel. Based on these data, we can conclude that PTA has an excellent inhibition effect on steel corrosion in 1 M HCl solution, and the results are in good agreement with the data obtained by the weight loss method.
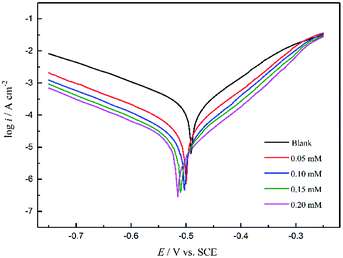 |
| | Fig. 7 Potentiodynamic polarization curves of mild steel in 1 M HCl solution without and with different concentrations of PTA. | |
Table 3 Polarization curve parameters for the corrosion of mild steel in 1 M HCl solution without and with different concentrations of inhibitors
| c (mM) |
Ecorr (mV) |
icorr (μA cm−2) |
βa (mV dec−1) |
βc (mV dec−1) |
η (%) |
| Blank |
−491 |
163.1 |
83.0 |
−163.5 |
— |
| 0.05 |
−499 |
41.8 |
82.2 |
−158.6 |
74.37 |
| 0.10 |
−503 |
24.2 |
78.4 |
−161.0 |
85.16 |
| 0.15 |
−510 |
9.6 |
84.3 |
−162.8 |
94.11 |
| 0.20 |
−515 |
5.6 |
86.7 |
−167.6 |
96.57 |
EIS
The Nyquist plots of steel in 1 M HCl solution without and with various concentrations of the inhibitors under investigation are shown in Fig. 8. Evidently, the Nyquist plots show a slightly depressed semicircular capacitive loop, implying that only one constant is associated with the charge transfer process. Due to the surface roughness and other inhomogeneity of the electrode, the phenomenon of a depressed capacitive loop is often attributed to frequency dispersion.26–28 Moreover, in the presence of inhibitors, the diameters of the capacitance loop are larger than those in noninhibitory acidic solutions, and the diameters of the high-frequency loop significantly increase with the inhibitor concentration, which indicates that the PTA inhibitor has a corrosion inhibition effect with regard to steel in 1 M HCl. It is also noteworthy that the shape of the impedance spectroscopy spectrum has no significant change under different inhibitor concentrations, showing that the addition of inhibitors does not change the corrosion mechanism of the carbon steel electrode, which is consistent with the polarization curve test results.
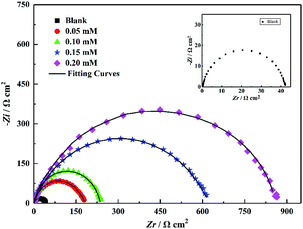 |
| | Fig. 8 Nyquist plots for mild steel in 1 M HCl solution without and with different concentrations of PTA. | |
Fig. 9 shows the Bode plots corresponding to the Nyquist plot, which shows only one peak at the intermediate frequency, implying that only one-time constant at the steel–solution interface is related to the double-charge layer.29,30 In addition, Fig. 9 shows that at lower frequencies, the absolute impedance increases with the corrosion inhibitor concentration. This is because the larger the inhibitor concentration, more molecules are adsorbed on the mild steel surface; further, the thicker the adsorption film, the more difficult it is for the charge transport process. Because the adsorption characteristics of the inhibitor molecules have a significant influence on the charge transfer process, for the purpose of obtaining additional accurate experimental data, the double-layer capacitor (Cdl) is optimized by using a constant phase element (CPE).31–33 The impedance of CPE (ZCPE) is represented as follows:
Here,
Y0 represents the CPE constant, j is an imaginary number,
ω is the angular frequency, and
n is the phase shift. In order to better analyze the electrochemical impedance characteristics, the data were fitted by the ZSimpWin software and the corresponding electrochemical parameters were obtained by using the equivalent circuit shown in
Fig. 10. The accuracy of the fitted data was evaluated using a chi-squared (
χ2) test.
Table 4 shows that the
χ2 values were of the order of 10
−3, indicating that the fitted data agreed well with the experimental data. The electrochemical impedance parameters are also listed in
Table 4. Here,
Cdl and inhibition efficiency (
ηz) can be expressed as follows:
| |
 | (12) |
Here,
Y0 represents the CPE constant and
n is a CPE exponent that can be employed as a measure of the roughness of the metal surface; further,
R0ct and
Rct represent the value of the charge transfer resistance of mild steel electrode in the corrosive medium without or with an inhibitor, respectively.
Table 4 shows that as the concentration of the inhibitor increases, the
Rct and
ηz values significantly increase; when the PTA concentration reaches 0.2 mM, the maximum
ηz value can be as high as 95.06%, which shows that the corrosion of mild steel can be effectively inhibited by the corrosion inhibitor molecules in HCl solutions. In comparison, as the local dielectric constant decreases or the thickness of the electric double-layer capacitor increases with the increase in the inhibitor concentration, the
Cdl value tends to decrease.
20 These results show that the corrosion inhibitor molecules replace the water molecules on the steel surface and exhibit an adsorption role at the electrode–solution interface. In addition, another interesting finding from
Table 4 is that the
n values were close to unity, showing no significant fluctuations, revealing that the interfacial behavior was almost capacitive and possessed the charge transfer control of the dissolution mechanism of steel.
3 Finally, it is noteworthy that the value of
ηz calculated by EIS has the same trend as that obtained by the weight loss and electrodynamic polarization curve methods.
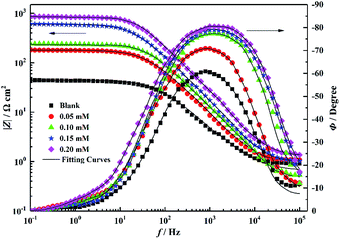 |
| | Fig. 9 Bode plots for mild steel in 1 M HCl solution without and with different concentrations of PTA. | |
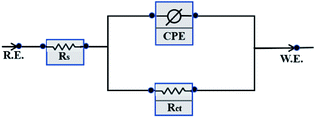 |
| | Fig. 10 Equivalent circuit used to fit the EIS experiment data. | |
Table 4 EIS parameters for the corrosion of mild steel in 1 M HCl solution without and with different concentrations of inhibitors
| c (mM) |
Rs (Ω cm2) |
Cdl (μF cm−2) |
n |
Rct (Ω cm2) |
χ2 (10−3) |
ηz (%) |
| Blank |
0.21 ± 0.04 |
250.7 ± 2.21 |
0.91 |
42.3 ± 1.46 |
6.41 |
— |
| 0.05 |
0.16 ± 0.03 |
153.2 ± 2.56 |
0.90 |
178.6 ± 2.53 |
3.47 |
76.32 |
| 0.10 |
0.17 ± 0.04 |
148.4 ± 2.81 |
0.89 |
237.5 ± 5.12 |
3.26 |
82.19 |
| 0.15 |
0.18 ± 0.03 |
136.1 ± 1.92 |
0.89 |
609.7 ± 3.62 |
4.77 |
93.06 |
| 0.20 |
0.19 ± 0.05 |
81.5 ± 1.25 |
0.92 |
856.3 ± 7.54 |
5.28 |
95.06 |
When compared with the earlier studied pyridine-derivative inhibitors by the EIS method in 1 M HCl (Table 5), PTA exhibited better corrosion inhibition behaviors. This phenomenon is related to the aromatic ring system and the number of heteroatoms in the structure.
Table 5 Comparison of the inhibition efficiency of PTA with the literature data as corrosion inhibitors for mild steel in acidic solutions
| Inhibitor |
10−4 c (M) |
Medium of testing |
Experimental techniques |
η (%) |
Ref. |
| 4-(Pyridin-4-yl)thiazol-2-amine |
2 |
1 M HCl |
EIS |
95.06 |
This paper |
| 2-(Imidazol-2-yl)-pyridine |
2 |
1 M HCl |
EIS |
90.3 |
1 |
| 1-(2-Pyridyl)-2-thiourea |
2 |
1 M HCl |
EIS |
86.6 |
1 |
| 3-Pyridinecarboxaldehyde thiosemicarbazone |
2.5 |
1 M HCl |
EIS |
88 |
32 |
| 3-Pyridinecarboxaldehyde-4-phenyl thiosemicarbazide |
2.5 |
1 M HCl |
EIS |
90 |
2 |
| 4-Pyridinecarboxaldehyde-4-phenylthiosemicarbazide |
2.5 |
1 M HCl |
EIS |
88 |
2 |
| Pyridine-2-aldehyde-2-quinolylhydrazone |
8 |
1 M HCl |
EIS |
79.9 |
13 |
| (5-Methyl-1-pyridin-2-yl-1H-pyrazol-3-yl)methanol |
5 |
1 M HCl |
EIS |
83 |
5 |
| 5-Methyl-1-pyridin-2-yl-1H-pyrazol-3-carboxylate |
5 |
1 M HCl |
EIS |
70 |
5 |
| 2-Phenylimidazo[1,2-a]pyridine |
10 |
1 M HCl |
EIS |
89 |
27 |
| 2-(3-Methyl-1H-pyrazol-5-yl) pyridine |
10 |
1 M HCl |
EIS |
86 |
26 |
| 2,5-Bis(4-pyridyl)-1,3,4-thiadiazole |
2 |
1 M HCl |
EIS |
55.5 |
31 |
Surface characterization: SEM and EDX
Fig. 11 shows the SEM image of mild steel specimens immersed in a 1 M HCl solution without 0.2 mM PTA inhibitor for 72 h. From this diagram, it is evident that when the corrosion inhibitor (Fig. 11a) is not added, the mild steel test plate is seriously corroded due to the action of acid, the surface is not glossy and smooth, and there are many large and deep holes formed by corrosion. By adding an inhibitor (Fig. 11b), the corrosion degree of mild steel is considerably reduced and the surface is smooth; only a very small amount of shallow corrosion pits are observed. It can be concluded that the PTA inhibitor can form a dense protective film, which has an inhibitive effect on the steel surface.
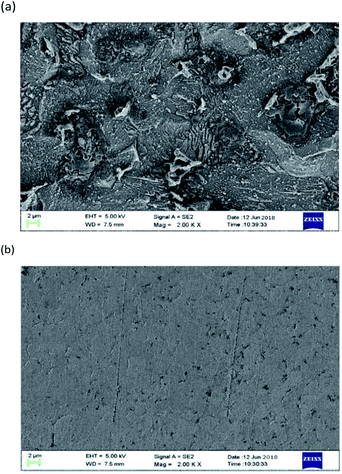 |
| | Fig. 11 SEM images of mild steel surfaces: (a) 1 M HCl and (b) PTA. | |
EDX energy spectrum analysis results of mild steel specimens in HCl solution without and with the addition of 0.2 mM inhibitor are shown in Fig. 12. From Fig. 12a and b, it is evident that the C and O peaks are relatively close and difficult to distinguish. After the addition of inhibitors, the peaks of N and S appear in the EDX energy spectrum (Fig. 12b), which can be derived from the N and S elements in the PTA, respectively. The percentages of the elemental compositions obtained from the EDX spectra are listed in Table 6. It is clearly determined that in the presence of PTA, the percentage atomic content of Fe remarkably reduces due to the coverage of the mild steel surface by PTA molecules. This finding further suggests that PTA molecules are adsorbed on the steel surface.
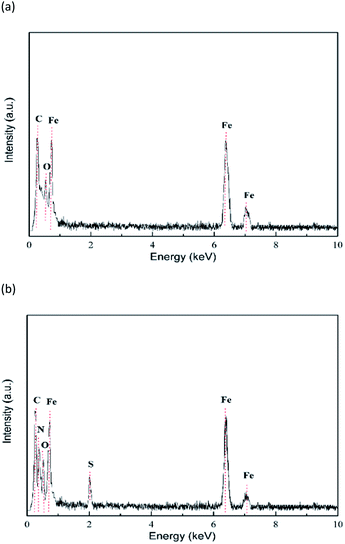 |
| | Fig. 12 EDX images of the mild steel surface in 1 mol L−1 HCl solution (a) without and (b) with 0.2 mM PTA. | |
Table 6 Percentage atomic contents of elements obtained from the EDX spectra for PTA
| Inhibitors |
Fe |
C |
N |
O |
S |
| Blank |
84.19 |
13.27 |
— |
2.54 |
— |
| PTA |
77.26 |
16.65 |
3.17 |
1.03 |
1.89 |
UV-vis spectroscopy analysis
In order to support the complex formation between corrosion inhibitor and steel surface, UV-vis absorption spectra of 1 M HCl solution containing 0.2 mM PTA before and after steel immersion for 24 h are shown in Fig. 13. Before the steel was immersed, the absorption spectra of PTA exhibited absorption bands at shorter wavelengths at 226 nm and 259 nm due to the π → π* transition of the aromatic ring in the PTA compound. Further, the wider absorption band around 326 nm was attributable to the n → π* electron transition due to the lone pair electrons of the N and/or S atom.1 After immersion for 24 h in the corrosion inhibitor, Fig. 13 shows that the band at 259 nm completely disappears, and the maximum band of the n → π* transition shows a red-shift, which may be due to the charge transfer from the ligand to the metal. The transfer process indicates that N and/or S interacted with Fe to form a complex.
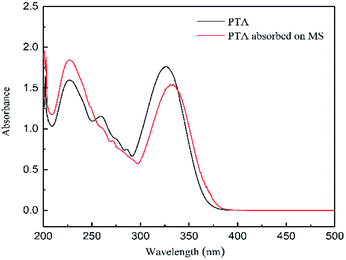 |
| | Fig. 13 UV-vis spectra of pure inhibitor and PTA inhibitors adsorbed on mild steel surface. | |
At the same time, the short-wavelength absorption band's absorbance increases and the long-wavelength absorption band's absorbance reduces. In general, the changes in the position of the maximum absorbance and/or changes in the absorbance values indicate that there is a formation of a complex between the two substances in the solution, as reported in the literature.33 From these experimental results, convincing evidences are provided regarding the possibility of Fe2+ and inhibitors forming complexes in 1 M HCl solution.
Quantum chemical calculations
The frontier molecular orbitals facilitated studying the adsorption activity of the inhibitor molecules to the electrons distribution. Moreover, DFT calculations were also performed on the protonated species to explore the likelihood of inhibitor molecules being protonated in HCl and the potential anticorrosion mechanism of the protonated molecules on the metallic surface. Table 7 shows the proton affinity and energy in the protonation process; evidently, the largest value of PA exists on the N13 atom; further, N13 exhibits the lowest energy in the protonation process, which suggests that N13 is the most probable site of protonation.34 Fig. 14 shows the electron density distribution of the HOMO and LUMO levels for the inhibitor and protonated molecules. From these characteristic electron density distributions, it is evident that the inhibitor molecule has different LUMO distribution in the neutral and protonated forms. In the neutral form, the LUMO electron density is almost distributed among the entire molecule. In contrast, the LUMO electron density lies largely over the pyridine and thiazole ring in the protonated form. However, their HOMO electron density is similar and distributed over the entire molecule. The results of the theoretical arguments are shown in Table 8. Here, EHOMO and ELUMO are related to the ability of the inhibitor molecules to provide and receive electrons, respectively. As reported earlier,35,36 the higher the EHOMO value, the more likely the molecule is to provide electrons. In contrast, the lower the ELUMO value, the stronger is the electron acceptability of the inhibitor molecules. Moreover, the separation energy (ΔE = ELUMO − EHOMO) usually determines the adsorption activity of the inhibitor molecules on the metal surface. Generally, the decrease in ΔE leads to an increase in the reactivity of the inhibitor molecules, which makes it more easily adsorbable on the steel surface.37 From Table 8, it is clear that the inhibitor molecule has the highest EHOMO value in the neutral form and lower ELUMO value in the protonated form. This reveals that the neutral form has a stronger ability of donating electrons as compared to the protonated form, but the ability of accepting electrons is the opposite. In addition, the smaller ΔE value (2.99 eV) of the protonated form indicates that it is easier to adsorb on the steel surface. Therefore, the protonated inhibitor molecule undergoes physisorption on the steel surface via electrostatic interactions, and its neutral form undergoes chemisorption to the steel surface through donor interactions between the free electron pairs of the heteroatoms (N, S), as well as the π-electrons and unoccupied d-orbitals of the iron atoms. This is in accordance with the value of ΔG0ads determined from the experiments.
Table 7 Relative energies of the protonation sites of the inhibitor at the B3LYP/6-31G(d,p) basis set level
| Energies |
N13 |
N14 |
N17 |
Inh |
| PA (kJ mol−1) |
987.188 |
924.176 |
816.531 |
— |
| H (hartree) |
−871.882 |
−871.858 |
−871.817 |
−871.508 |
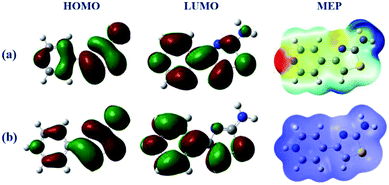 |
| | Fig. 14 Frontier molecular orbital density distributions and 3D MEP plots of the (a) neutral and (b) protonated forms. | |
Table 8 Calculated quantum parameters for neutral and protonated forms of PTA
| Compounds |
EHOMO (eV) |
ELUMO (eV) |
ΔE (eV) |
ΔN |
| Inh |
−6.16 |
−1.65 |
4.51 |
0.686 |
| InhH+ |
−9.49 |
−6.50 |
2.99 |
−0.333 |
The connection between corrosion inhibition and molecular structure can also be analyzed by determining the electron fraction of the corrosion inhibitor molecules transferred to the metal surface in order to determine the adsorption active sites in the molecule. On the basis of Pearson theory,38 the fraction of electrons transferred to the metal surface can be calculated as follows:
| |
 | (13) |
where
χ is the absolute electronegativity and
η is the global hardness, which can be calculated using the following equation:
| |
 | (14) |
| |
 | (15) |
For Fe, the theoretical values of χFe and ηFe are 7 and 0 eV mol−1, respectively.38 Based on earlier reports,4,38 if ΔN < 3.6, the stronger the electron-donating ability of the inhibitor, the higher is the inhibition efficiency. In this study, from Table 8, it is clear that the neutral form has a positive ΔN value, while the protonated form is the opposite. Therefore, the inhibitor molecule generates coordination bonds to donate electrons to the empty d-orbital of the Fe atom mainly in the neutral form, and it forms a back-donating bond to accept electrons from the Fe atom with its vacant π* orbital mainly in the protonated form; therefore, the adsorption of the corrosion inhibitor molecule on the steel surface is enhanced.
The MEP contains information about the total electronic constitution of the molecule and provides a visual method to understand the relative polarity. The 3D MEP surface for the inhibitor molecule and its protonated form are also shown in Fig. 14. The negative region in the electrostatic potential is prone to an electrophilic attack (shades of red), while most of the reactive sites are in the positive potential region (shades of blue) susceptible to a nucleophilic attack. As shown in Fig. 14, the negative regions of the electrostatic potential are mainly located in the pyridine/thiazole ring and amino group, indicating the possible sites for electrophilic attacks. However, the positive potential regions are located around the hydrogen atoms and are the possible sites for nucleophilic attacks. It is expected that the protonated structure has excess positive potential regions, which implies that the protonated form is more likely to undergo a nucleophilic attack and has a stronger ability of accepting electrons from the steel surface. Identical conclusions were obtained from the frontier molecular orbitals (HOMO and LUMO) and ΔN analyses (Table 8). Therefore, the adsorption of the inhibitor molecule in this study is mostly attributed to chemisorption, coinciding with the adsorption isotherms data.
Conclusions
For the first time, PTA was found to be a potential corrosion inhibitor for mild steel in 1 M HCl solution. The main conclusions are as follows:
(1) A corrosion inhibitor (PTA compound) for mild steel in 1 M HCl was studied. The greater the inhibitor concentration, the better is the corrosion inhibition effect. The corrosion inhibition effect is best at 0.2 mM, reaching 96.06%.
(2) The electrochemical test results show that PTA can inhibit the cathodic and anodic reactions in the corrosion process and belong to a mixed corrosion inhibitor. The adsorption of the mild steel surface follows the Langmuir adsorption isotherm, including physical adsorption and chemical adsorption.
(3) Surface analyses (SEM/EDX/UV-vis) showed that the PTA molecules could be adsorbed on the surface of the mild steel to form a protective film with good corrosion inhibition performance.
(4) The study of the frontier molecular orbitals revealed that the inhibitor molecule forms a coordination bond with the Fe atom mainly in the neutral form, and the formation of a back-donating bond was mainly protonated, which also proved that the adsorption activity centers are pyridine/thiazole ring and amino group, playing an important role in the corrosion resistance of steel.
Conflicts of interest
There are no conflicts to declare.
Acknowledgements
The authors thank the support of the National Natural Science Foundation of China (NSFC) under Grant No. 61404012, 11247028, 61306122, 11347021, 61106126, and 91121021. The work is also sponsored by the Science and Technology Office Project of Jiangsu Province and the Six Talent Peaks Project of Jiangsu Province.
References
- W. W. Zhang, H. J. Li, Y. W. Wang, Y. Liu, Q. Z. Gu and Y. C. Wu, New J. Chem., 2018, 42, 12649–12665 RSC.
- Y. Meng, W. Ning, B. Xu, W. Yang, K. Zhang, Y. Chen, L. Li, X. Liu, J. Zheng and Y. Zhang, RSC Adv., 2017, 7, 43014–43029 RSC.
- W. W. Zhang, R. Ma, H. H. Liu, Y. Liu, S. Li and L. Niu, J. Mol. Liq., 2016, 222, 671–679 CrossRef CAS.
- A. O. Yüce, B. D. Mert, G. Kardas and B. Yazici, Corros. Sci., 2014, 83, 310–316 CrossRef.
- K. Tebbji, H. Oudda, B. Hammouti, M. Benkaddour, M. El Kodadi and A. Ramdani, Colloids Surf., A, 2005, 259, 143–149 CrossRef CAS.
- B. M. Mistry, N. S. Patel, S. Sahoo and S. Jauhari, Bull. Mater. Sci., 2012, 35, 459–469 CrossRef CAS.
- W. W. Zhang, R. Ma, S. Li, Y. Liu and L. Niu, Chem. Res. Chin. Univ., 2016, 32, 827–837 CrossRef CAS.
- C. Verma, L. O. Olasunkanmi, I. B. Obot, E. E. Ebenso and M. A. Quraishi, RSC Adv., 2016, 6, 53933–53948 RSC.
- W. W. Zhang, H. J. Li, M. Wang, L. J. Wang, A. H. Zhang and Y. C. Wu, New J. Chem., 2019, 43, 413–426 RSC.
- M. P. Hay, S. Turcotte, J. U. Flanagan, M. Bonnet, D. A. Chan, P. D. Sutphin, P. Nguyen, A. J. Giaccia and W. A. Denny, J. Med. Chem., 2010, 53, 787–797 CrossRef CAS PubMed.
- T. Cao, J. T. Chen, C. L. Yang and Z. Y. Ma, Acta Pharmacol. Sin., 2016, 51, 1436–1440 Search PubMed.
- M. J. Frisch, G. W. Trucks, H. B. Schlegel, G. E. Scuseria, M. A. Robb, J. R. Cheeseman, G. Scalmani, V. Barone, B. Mennucci, G. A. Petersson, H. Nakatsuji, M. Caricato, X. Li, H. P. Hratchian, A. F. Izmaylov, J. Bloino, G. Zheng, J. L. Sonnenberg, M. Hada, M. Ehara, K. Toyota, R. Fukuda, J. Hasegawa, M. Ishida, T. Nakajima, Y. Honda, O. Kitao, H. Nakai, T. Vreven, J. A. Montgomery Jr, J. E. Peralta, F. Ogliaro, M. Bearpark, J. J. Heyd, E. Brothers, K. N. Kudin, V. N. Staroverov, T. Keith, R. Kobayashi, J. Normand, K. Raghavachari, A. Rendell, J. C. Burant, S. S. Iyengar, J. Tomasi, M. Cossi, N. Rega, J. M. Millam, M. Klene, J. E. Knox, J. B. Cross, V. Bakken, C. Adamo, J. Jaramillo, R. Gomperts, R. E. Stratmann, O. Yazyev, A. J. Austin, R. Cammi, C. Pomelli, J. W. Ochterski, R. L. Martin, K. Morokuma, V. G. Zakrzewski, G. A. Voth, P. Salvador, J. J. Dannenberg, S. Dapprich, A. D. Daniels, O. Farkas, J. B. Foresman, J. V. Ortiz, J. Cioslowski and D. J. Fox, Gaussian 09, Revision D.01, Gaussian, Inc., Wallingford, CT, 2010 Search PubMed.
- W. W. Zhang, H. J. Li, Y. W. Wang, Y. Liu and Y. C. Wu, Mater. Corros., 2018, 69, 1638–1648 CrossRef CAS.
- J. Aljourani, K. Raeissi and M. A. Golozar, Corros. Sci., 2009, 51, 1836–1843 CrossRef CAS.
- K. R. Ansari, M. A. Quraishi and A. Singh, Measurement, 2015, 76, 136–147 CrossRef.
- J. Aljourani, K. Raeissi and M. A. Golozar, Corros. Sci., 2009, 51, 1836–1843 CrossRef CAS.
- M. Behpour and S. M. Ghoreishi, Corros. Sci., 2010, 52, 4046–4057 CrossRef CAS.
- M. Mahdavian and S. Ashhari, Electrochim. Acta, 2010, 55, 1720–1724 CrossRef CAS.
- M. Kissi, M. Bouklah, B. Hammouti and M. Benkaddour, Appl. Surf. Sci., 2006, 252, 4190–4197 CrossRef CAS.
- A. Döner, R. Solmaz, M. Ozcan and G. Kardas, Corros. Sci., 2011, 53, 2902–2913 CrossRef.
- M. Outirite, M. Lagrenée, M. Lebrini, M. Traisnel, C. Jama, H. Vezin and F. Bentiss, Electrochim. Acta, 2010, 55, 1670–1681 CrossRef CAS.
- J. Sudheer and M. A. Quraishi, Corros. Sci., 2013, 70, 161–169 CrossRef.
- S. A. A. El-Maksound and A. S. Fouda, Mater. Chem. Phys., 2005, 93, 84–90 CrossRef.
- N. S. Ayati, S. Khandandel, M. Momeni, M. H. Moayed, A. Davoodi and M. Rahimizadeh, Mater. Chem. Phys., 2011, 126, 873–879 CrossRef CAS.
- X. He, Y. Jiang, C. Li, W. Wang, B. Hou and L. Wu, Corros. Sci., 2014, 83, 124–136 CrossRef CAS.
- M. Bouklah, A. Attayibat, B. Hammouti, A. Ramdani, S. Radi and M. Benkaddour, Appl. Surf. Sci., 2005, 240, 341–348 CrossRef.
- A. Ghzaoui, R. Saddik, N. Benchat, M. Guenbour, B. Hammouti and S. S. Aldeyab, Int. J. Electrochem. Sci., 2012, 7, 7080–7097 Search PubMed.
- W. W. Zhang, H. J. Li, Y. C. Wu, Q. Luo, H. H. Liu and L. Niu, Chem. Res. Chin. Univ., 2018, 34, 817–822 CrossRef CAS.
- O. K. Abiola and N. C. Oforka, Mater. Chem. Phys., 2004, 83, 315–322 CrossRef CAS.
- R. Solmaz, G. Kardas, B. Yazici and M. Erbil, Colloids Surf., A, 2008, 312, 7–17 CrossRef CAS.
- M. Lebrini, F. Bentiss, H. Vezin and M. Lagrenee, Corros. Sci., 2006, 48, 1279–1291 CrossRef CAS.
- B. Xu, Y. Liu, X. Yin, W. Wang and Y. Chen, Corros. Sci., 2013, 74, 206–213 CrossRef CAS.
- K. R. Ansari and M. A. Quraishi, Corros. Sci., 2014, 74, 5–15 CrossRef.
- M. Makowski, E. D. Raczynska and L. Chmurzynski, J. Phys. Chem. A, 2001, 105, 869–874 CrossRef CAS.
- Z. Cao, Y. Tang, H. Cang, J. Xu, G. Lu and W. Jing, Corros. Sci., 2014, 83, 292–298 CrossRef CAS.
- I. B. Obot and Z. M. Gasem, Corros. Sci., 2014, 83, 356–366 CrossRef.
- W. W. Zhang, H. J. Li, M. R. Wang, L. J. Wang, F. Shang and Y. C. Wu, J. Phys. Chem. C, 2018, 122, 25349–25364 CrossRef CAS.
- M. Lebrini, M. Lagrenee, M. Ttaisnel, L. Gengembre, H. Vezin and F. Bentiss, Appl. Surf. Sci., 2007, 253, 9267–9276 CrossRef CAS.
|
| This journal is © The Royal Society of Chemistry 2019 |
Click here to see how this site uses Cookies. View our privacy policy here.  Open Access Article
 *c
*c
![[double bond, length as m-dash]](https://www.rsc.org/images/entities/char_e001.gif) CHS–), 7.21 (s, 2H, –NH2); 13C NMR (100 MHz, d6-DMSO): δ/ppm = 169.1, 150.4, 147.9, 141.9, 120.3, 106.6.
CHS–), 7.21 (s, 2H, –NH2); 13C NMR (100 MHz, d6-DMSO): δ/ppm = 169.1, 150.4, 147.9, 141.9, 120.3, 106.6.


![[thin space (1/6-em)]](https://www.rsc.org/images/entities/char_2009.gif) vcorr vs. 1/T for steel in 1 M HCl in the absence and presence of inhibitors.
vcorr vs. 1/T for steel in 1 M HCl in the absence and presence of inhibitors.


![[thin space (1/6-em)]](https://www.rsc.org/images/entities/char_2009.gif) ln(55.5Kads)
ln(55.5Kads)


